
84 Rutgers Business Review Spring 2020
Paths to Purchase: The Seven Steps of
Customer Purchase Journey Mapping
Barry Berman
Hofstra University
Abstract
A consumer purchase map details the decision paths and key interactions
customers encounter with a firm or brand as they move throughout the
purchase process. This article details a seven-step process that channel
members can use to better plan and implement customer journey mapping: (1)
developing an organization unit to manage the consumer purchase journey
mapping process; (2) mapping touch and interaction points; (3) identifying the
characteristics of effective journeys; (4) using maps to identify and reach
specific target markets; (5) measuring the strengths and weaknesses of the
customer experience through consumer purchase journey mapping; (6)
quantifying the benefits and costs of journey mapping and (7) avoiding pitfalls
in planning and implementing purchase journey mapping.
The Importance of Customer Journey Mapping
The consumer purchase map details the decision paths and key
interactions with a firm or brand as the customer moves through the
purchase process from awareness, to consideration, to search, to purchase
and to post-purchase behavior. The map identifies the firm’s most important
customer touchpoints in each target market, shows the different decision
paths taken by these audiences, and enables a marketer to measure the
overall value of each touchpoint. The mapping process identifies weak points
in a firm’s marketing strategy by comparing the actual versus desired
sequence among devices (PC and smartphone), departments (sales and
customer service), and channels (Web and store).
Customer purchase maps were first discussed in a McKinsey Quarterly
publication.
1
The process outlined by McKinsey is similar to the Buyer Utility
Map that is part of the Blue Ocean Strategy.
2
Both the journey map and Buyer

Seven Steps of Customer Purchase Journey Mapping
Rutgers Business Review
Vol. 5, No. 1
85
Utility Map focus on the sequence of stages in the purchase cycle and the
customer experience.
The increased use of consumer purchase mapping is associated with the
use of omnichannel marketing strategies. Unlike multichannel strategies that
focus solely on either Web or store-based strategies, omnichannel marketing
recognizes that consumers often channel hop among channels and devices.
Customer journey mapping is an alternative to traditional segmentation
and cross-tabulation based studies that confine their analysis to a single
touchpoint. In contrast, journey mapping looks at the cumulative customer
experience across multiple touchpoints and multiple channels.
3
Mapping is
an effective technique to analyse a consumer group’s sequence of activities
and the proper handoff of customers from one touchpoint to another. The
purchase map enables marketers and academics to answer a series of
questions. These relate to customers’ use of an omnichannel strategy, the
quality of the customers’ experience at each stage of the buying process, and
synergies and disruptions at each purchase process stage. Through mapping,
touchpoints are viewed as complementary as opposed to being competitive
with one another.
Table 1. Major Differences between Consumer Purchase Mapping and
Traditional Market Research Techniques to Study Consumer Behavior
Consumer Purchase Mapping
Techniques
Traditional Market Research
Examines touchpoint interaction across
channels and devices
Looks at consumer behavior within a
specific channel or device
Assumes that the purchase path can be
either linear or curvilinear
Assumes a linear consumer purchase
path
Looks at the customer’s total purchase
process experience
Examines the customer’s experience at a
single stage of the purchase process
Takes an omnichannel perspective Takes a single or multichannel
perspective
Table 1 examines the major differences between analyzing consumer
behavior using traditional techniques versus consumer purchase journey
mapping. While traditional techniques focus on a single channel or device
(PC, tablet, iPad) at one point in time, consumer purchase mapping looks at
the touchpoint interactions across channels and devices within the entire
purchase process. Many cross tabulation-based or segmentation studies

Seven Steps of Customer Purchase Journey Mapping
86 Rutgers Business Review Spring 2020
assume that a customer’s decision path is linear, while consumer purchase
journeys seek to determine whether linear or curvilinear purchase journeys
best describe consumer behavior. Lastly, traditional studies look at a
customer’s experience at one stage of the purchase process. In contrast,
journey mapping looks at the customer’s total experience across channels
and devices. In summary, journey mapping embodies an omnichannel
perspective, while traditional research has a single or multichannel
viewpoint.
Table 2. Key Marketing Issues that Can Be Resolved via Consumer Purchase
Mapping
Effective Use of Omnichannel Strategies
To what extent do shoppers use online, store, mobile marketing or social media in
various stages of the consumer purchase process?
Do gaps between consumer expectations and experiences exist between devices,
departments and channels?
What are the potential synergies among touchpoints?
What types of promotions and product information facilitate customer movement along
the purchase process? … hinder movement?
Where are the significant defections in the buying process?
Can a marketer reallocate resources, messages, and the touchpoint sequence to reduce
consumer defections along the consumer purchase process?
Response to Changes in Consumer Behavior
How does consumer behavior change over time as a customer obtains experience with
a good or service provider?
Do mapping results coincide with the growth of mobile phone and APP usage?
Effectiveness of Strategies for Each Major Target Market
What combination of strategies and touchpoints are most effective for each major target
market?
How effective is a firm’s marketing effort in low involvement versus high involvement
purchasing contexts?... B2B versus B2C environments?... complex versus commoditized
contexts?
Evaluation of the Customer Experience
Do consumers face very inconsistent experiences and satisfaction levels based on the
touchpoints used? …the sequence of touchpoints used?
Every two years the Marketing Science Institute (MSI) asks its member
company trustees to list their most pressing concerns. MSI listed

Seven Steps of Customer Purchase Journey Mapping
Rutgers Business Review
Vol. 5, No. 1
87
“Understanding Customers and the Customer Experience” as a Tier 1 priority
for 2014-2016 for both practitioners and academics.
4
This paper focuses on purchase journey mapping from a managerial
perspective. It develops a seven-step process to better plan and implement
journey mapping: (1) developing an organization unit to manage the
consumer purchase journey mapping process; (2) mapping touch and
interaction points; (3) identifying the characteristics of effective journeys; (4)
using maps to identify and reach specific target markets; (5) measuring the
strengths and weaknesses of the customer experience through consumer
purchase journey mapping; (6) quantifying the benefits and costs of journey
mapping and (7) avoiding pitfalls in planning and implementing purchase
journey mapping. See Table 2 for a listing of key marketing issues that can be
answered via journey mapping.
Customer Journey Mapping: Research Findings
This section summarizes the contribution of customer journey mapping
to two important research streams. The first stream questions the traditional
linear model of consumer behavior. The second looks at the role of the store
in an omnichannel environment.
Prior to consumer journey mapping many academics viewed the
consumer purchase process (from awareness, to familiarity, to consideration,
to purchase, and to loyalty) as funnel-shaped. The funnel shape suggests that
consumers narrow their alternatives as they move from one stage of the
purchase process to another. A study of National Hockey League membership
services found its customers rarely skip steps in their buying behavior.
Instead they move in a pattern characterized by increased commitment.
5
The
funnel shape implies that consumers drop out of the purchase for a given
brand and choose other brands instead or none at all. This explains why a 50
percent increase in brand consideration does not translate into a 50 percent
increase in sales.
In a nonlinear model consumer actions may overlap and be repeated as
opposed to being successive. Several studies question the funnel-shaped view
of the consumer purchase process. For example, due to conflicting users’
reviews the consumer research process can become more intensive.
6
A
McKinsey study, based on a sample size of 20,000 consumers across five
industries (automobiles, skin care, insurance, consumer electronics and
mobile telecom) and three continents, found that the funnel concept failed
to capture all of the touchpoints and key buying factors.
7
The study
concluded that the number of brands under consideration expanded as
consumers sought additional information during an extended evaluation
phase. In addition, two-thirds of the touchpoints during the active evaluation

Seven Steps of Customer Purchase Journey Mapping
88 Rutgers Business Review Spring 2020
stage were consumer driven such as Internet-based reviews, word-of-mouth
recommendations, in-store interactions, and recollections of past
experiences.
8
Another McKinsey report found that, Business-to-Business (B2B) selling
had become less linear.
9
Likewise, a KPMG study concluded that the
traditional linear purchase path now appears as a cycle or a web. This shows
that customers often move back and forth at each stage due to the influence
of offline and online factors.
10
Research by Gartner found that that most B2B buyers are not clear about
how to get from problem to solution via a common series of jobs: finding
decision-enabling information, validating the information obtained, and
getting approval among internal stakeholders. As opposed to being a rational
series of steps, the B2B customer’s journey was found to better resemble a
maze rather than a linear path.
11
Despite these findings, funnel-based models
are still widely used.
The second stream of mapping-related research examines the role of store
versus other channels in the purchase process. An A.T. Kearney study of over
2,500 U.S. shoppers found that the most common of 30 possible purchase
journeys is a consumer solely using online for the initial product discovery
stage and the retailer’s store for trial, purchase, pickup, and return. Stores
were found to be the preferred single channel of all age groups.
12
Two-thirds
of customers purchasing online used a physical store before or after the
transaction. In addition, the returns stage is where consumers demonstrate
the highest preference for physical stores as compared with online
shopping.
13
These findings suggest that consumer mapping studies need to be flexible
in terms of their linear versus nonlinear shapes. Secondly, despite the heavily
publicized store closings and store-based retailer bankruptcies, the store is
still a vital channel to many consumers.
Planning and Implementing the Customer Journey Mapping
Process
The following section outlines a seven-step process that channel
members can use to better plan and implement journey mapping. These
steps include: (1) developing an organization unit to manage the consumer
purchase journey mapping process; (2) listing and mapping touchpoints and
interaction points; (3) describing the characteristics of effective journey
maps; (4) using maps to identify and reach specific target markets; (5)
measuring the strengths and weaknesses of specific touchpoints; (6)
quantifying the benefits and costs of mapping and (7) avoiding pitfalls in
planning and implementing purchase journey mapping. See Figure 1.
Seven Steps of Customer Purchase Journey Mapping
Rutgers Business Review
Vol. 5, No. 1
89
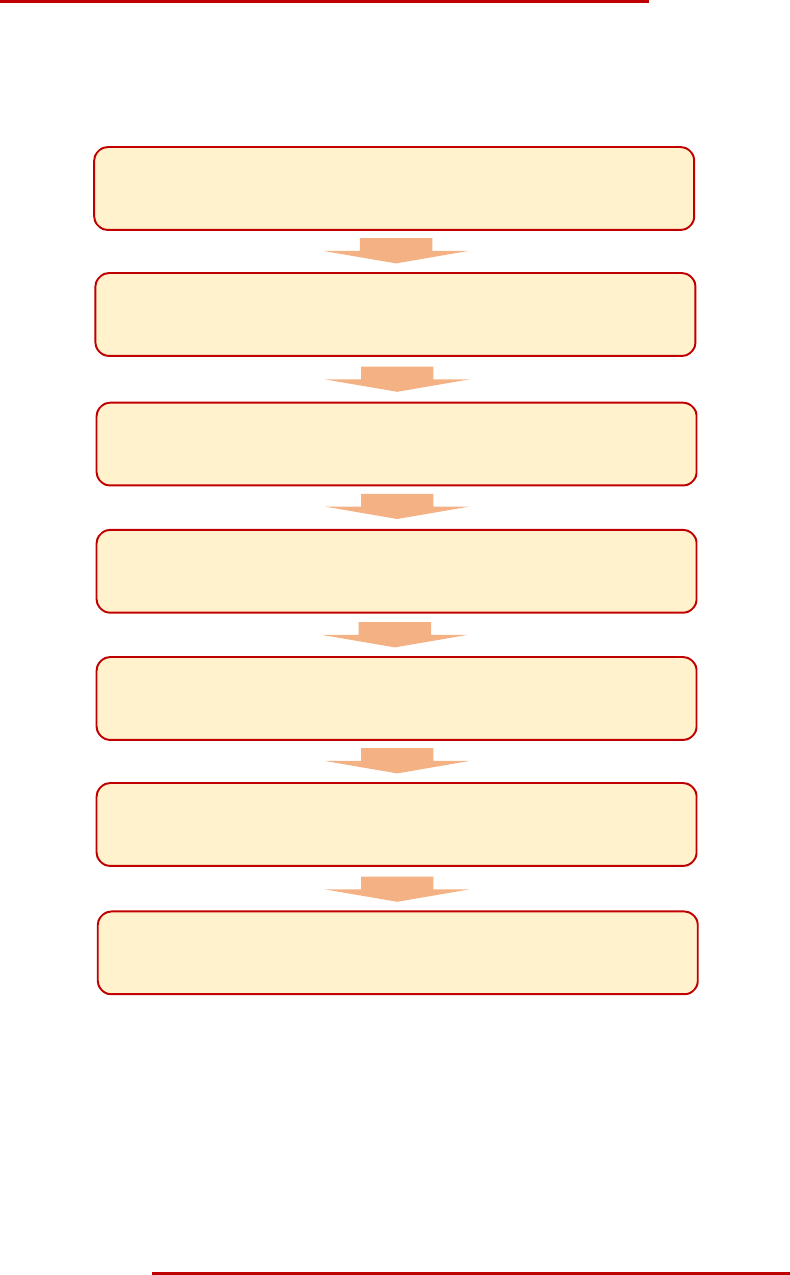
Figure 1. Steps in Planning and Implementing an Effective Customer Journey
Map
Developing an Organization Unit to Manage the Consumer
Purchase Journey Mapping Process
A major challenge to the adoption of consumer purchase mapping is the
siloed nature of service delivery that exists at many organizations. In error,
many companies focus their efforts on improving existing processes as
opposed to of improving the customer experience.
14,15
With a silo perspective,
Developing an Organization Unit to Manage the
Consumer Purchase Mapping Process
Mapping Touch and Interaction Points
Identifying the Characteristics of Effective
Journeys
Using Maps to Identify and Reach Specific Target Markets
Measuring the Strengths and Weakness of Customer Experience
through Consumer Purchase Journey Mapping
Quantifying the Benefits and Costs of Journey Mapping
Avoiding Pitfalls in Planning and Implementing Purchase
Journey Mapping

Seven Steps of Customer Purchase Journey Mapping
90 Rutgers Business Review Spring 2020
retailers and product managers separately examine each element of the
customer experience, such as a call center contact, television, Email, store,
kiosk, a Web site, an in-store experience, and/or Web forum. In contrast,
mapping examines all of the interactions across each touchpoint and device.
According to one study, the greatest challenge in creating an excellent
customer experience is not in creating separate well-designed touchpoints,
but in creating effective linkages across each touchpoint.
16
One way of overcoming a silo mentality is to assign responsibility for
purchase journey mapping to a consumer journey product manager. This
position leads scrum teams (or specialists across IT, analytics, operations,
marketing and other functional areas) responsible for examining synergies
across touchpoints, refining existing journeys, and eliminating pitfalls
customers encounter as they proceed through the purchase process.
The Royal Bank of Scotland eliminated its silo mentality by creating a
multi-functional committee to oversee its customer experience program. The
committee’s responsibilities include overseeing the full range of expertise
needed to design experiences at the bank. Previously, each service delivery
unit restricted its activities to a limited area.
17
Listing and Mapping Touchpoints and Interaction Points
Many of the steps in the purchase journey involve complex handoffs
between multiple internal groups where problems could easily occur. One
study of an energy company’s customer decision paths found that there were
19 customer interactions with complex handoffs among internal groups.
18
Another study of the mortgage application and receipt process had four high-
level services (purchase, administer, pay and redeem), 10 second-level
services, and 64 additional granular-level services.
19
One can simplify the
data collection and analysis process by focusing on select markets and
popular customer journey interactions. According to a McKinsey report,
targeting about 15 to 20 top journeys generally results in obtaining the most
value in the shortest time period.
20
The second part of this process lists each product journey mapping stage.
These stages are: awareness, evaluation, experiment, purchase use, and
brand/store loyalty. Another way to classify these stages is based on need,
research, decide, adopt, use, and recommend.
21
The more stages a firm choses
to study, the more complex the map becomes. One researcher concluded that
marketers should target stages in the decision journey as opposed to focusing
on the allocation of spending across media such as television, radio, online,
etc.
22
See Table 3 for a sample of touchpoint strategies for each consumer
purchase journey stage.

Seven Steps of Customer Purchase Journey Mapping
Rutgers Business Review
Vol. 5, No. 1
91
Table 3. Sample Touchpoint Tactics for Each Consumer Purchase Journey
Stage
Awareness Stage:
Placing relevant banner ads on mobile phone, laptop, PC
Using referral marketing programs in-store, and online
Advertising in traditional print, TV and radio media
Utilizing the always on, always connected, and personalization features of mobile
media
Providing promotion money directed at retail salespeople
Evaluation Stage:
Utilizing consumer online product reviews
Providing product ratings and awards from independent reviewing institutions
Allowing live chat experiences with customer service personnel
Making product manuals accessible online
Developing Web-based videos detailing product set-up directions
Promoting price matching policy on all channels and touchpoints
Placing product specification sheets and frequently asked questions (FAQs) online
Experiment Stage:
Enabling try on, try out, and product demonstrations in-store
Providing store-based product assistance
Promoting ease of store return
Purchase Stage:
Listing in-store inventory on a firm’s Web site
Promoting ease of store return regardless of place of purchase (store versus Web)
Offering locational-sensitive offers visible on a mobile phone
Promoting availability of two-day free shipping online
Providing price matching guarantees that are promoted in-store and online
Advertising credit availability
Brand/Store Loyalty Stage:
Enabling consumers to track loyalty program data
Allowing online tracking and reporting of past purchases and need for product
replacement, product servicing, and consumable purchases
One author recommends that the customer journey be constructed in
stages with the first stage consisting of sales personnel including inside sales,
outside sales, enterprise sales, account managers and sales operations.
23

Seven Steps of Customer Purchase Journey Mapping
92 Rutgers Business Review Spring 2020
Additional data for mapping process journeys can come from mobile
marketing interactions, consumer surveys, loyalty program data, sales
databases, customer service satisfaction scores, panel data, and social media
sites. The Customer Experience Professionals Association & Heart of the
Customer survey found that the top five sources were in-person interviews,
in-person focus groups, Web-based surveys, workshops involving customers,
and phone-based interviews.
24
A number of software mapping firms have developed tools to illustrate
the touchpoints used at different stages of the buying process. Mapping
vendors include: Autopilot, CustomersFirstNow, Smaply, SugarCRM,
TandenSeven, Touchpoint Dashboard, and UXPressia. Many of these software
applications allow users to develop customized flowchart type maps to
examine customer experiences by target market, to show how journey maps
change over time, and to determine which messages and interactions are
most effective and which need corrective action. According to a consulting
firm no single application captures, aggregates and analyzes customer
activities in all touchpoints. As a result, marketers need to purchase, and
integrate and analyze a number of consumer journey analytics applications
and to compare the findings.
25
Describing the Characteristics of Effective Journeys
Effective journeys have four characteristics: automation, proactive
personalization, contextual interaction, and journey innovation.
26
Automation enables customers to quickly execute complex processes such as
obtaining specific directions from one’s home to a close-by retail store.
Proactive personalization customizes the customer experience based on
his/her past behavior such as past purchases and customer service
interactions. Contextual interaction recognizes where a customer is in the
purchase journey such as reading a product’s online reviews and then draws
the customer to the next interaction (such as a $10 off limited time coupon
offer). Lastly, journey innovation identifies new sources of value for the both
the customer and the firm such as integrating multiple services into a single
customer experience (like booking an airplane seat, hotel, car rental, and
dinner at a hotel with one transaction).
A study of bookstore buying behavior found similar characteristics
associated with effective mapping. The study found the three main drivers of
excellence: (1) customization (expecting to design specific order and
promotions based on their usage profile); (2) making the consumer feel
integrated—customers want to be part of the bookstore and to offer a
pleasant environment through organizing events and through attractive
window displays; and (3) getting consumers to actively participate through

Seven Steps of Customer Purchase Journey Mapping
Rutgers Business Review
Vol. 5, No. 1
93
book presentations, cocktail receptions, and dinners with authors.
27
Table 4
provides examples of strategies to reduce dropouts and increase customer
flow across channels and devices.
Table 4. Selected Tactics to Increase Customer Flow Across Channels and
Devices
Tactics to Increase Customer Flow: Web to Store
Providing in-store inventory information on a firm’s Web site, including aisle location
Indicating the closest store locations, directions and hours on Web site
Listing models on display at a retailer’s nearest store location on the retailer’s Web site
Accepting Web purchases for in-store returns
Designating a special in-store pickup location for online purchases
Listing a store’s weekly store-based sales brochure on the retailer’s Web site
Using iBeacons to refer Web customers to closest store
Tactics to Increase Customer Flow: Store to Web
Referring store-based customers to the firm’s Web site for additional product
information and/or customer reviews
Enabling in-store customers to order goods online when goods are not in stock at store
Providing free Web access to store-based customers to see reviews, obtain additional
product information, and to increase customer engagement
Tactics to Increase Customer Flow within the Firm’s Web Site
Listing alternative trade-up models detailing extra features, warranty, etc.
Indicating store policy of matching prices of select Web-based competitors on each
screen
Incorporating augmented reality in Web site to enable consumers to better visualize
product placement and use
Tactics to Increase Customer Flow within the Firm’s Store
Providing free in-store Wifi access for customers to get additional product information
and product reviews
Offering to ship goods from closest store or to reserve goods at nearby location when
goods are out of stock
Incorporating augmented reality in the store to enable consumers to better visualize
product placement and use and to increase engagement
Using Maps to Identify and Reach Specific Target Markets
An important aspect of customer journey mapping is its ability to view
how different segments progress through the buying process. Large
segments, such as the mass market, and profitable segments (such as

Seven Steps of Customer Purchase Journey Mapping
94 Rutgers Business Review Spring 2020
relationship customers and heavy users), merit separate study. Different
types of content can appeal to different target audiences.
A study of 505 Dutch panel members looked at household purchases of
financial services within a 12-month period.
28
Researchers identified four
different consumer search strategies: information seekers, reassurance
seekers, peace-of-mind seekers, and convenience seekers. Each subgroup had
different search behaviors. Information seekers focused mostly on the
Internet, whereas reassurance seekers were just as likely to use offline
channels, as well as the Internet. Peace-of-mind seekers preferred personal
contact, while convenience seekers were less likely to consult their personal
contacts than the other three groups.
An analysis of over 1,100 bookstore consumers found two segments with
distinctly different purchase journeys: curious consumers and planners.
Curious consumers visited the bookstore very carefully and were very open
to the customer experience. On the contrary, planner consumers acted in a
focused manner and were very precise in their activities. Curious consumers
spent more time in the bookstores, even if they did not make any purchase,
while planners sought a brief visit. Curious consumers interacted with other
people in the bookstore, while planners interacted with technology in their
desire to be autonomous and independent.
29
Measuring the Strengths and Weaknesses of Specific Touch Points
Measures used to evaluate purchase journeys need to change from
specific touchpoint-related goals, such as shopping cart abandonment, Web
pages viewed per visit, and same store sales growth, to broader journey
outcome measures. As an example, a telecommunications firm now holds
sales agents, technicians, the call center, and the back-office agents all
responsible for a trouble-free installation, as opposed to requiring each
person to hand off the customer to the next touchpoint. Likewise, an energy
company has adopted new cross-functional measures for each frontline
employee that handles address changes.
30
It is also important that marketers measure service quality in a similar
manner as its consumers. Royal Bank of Scotland monitored its service
quality using such measures as days from mortgage application to mortgage
offer, the number of incomplete applications, and incorrect property
valuations. These and other bank key performance indicators were not
aligned with consumer views of the service experience.
31
Marketo, a marketing automation software provider, uses three major
classes of analytics. It first looks at the customer journey map to better
understand where people are in the journey, how quickly they move from
stage to stage, and where they are getting stuck. The second class of analytics

Seven Steps of Customer Purchase Journey Mapping
Rutgers Business Review
Vol. 5, No. 1
95
personalizes the information and interactions. The third class ties analytics
to sales and profit impacts.
32
Nokia uses Marketo to obtain statistics as to
whether a customer has visited a Web site, downloaded a white paper, or
attended a Webinar. Nokia claims that this process helps it to better
understand customer needs, provide the right content, and nurture the
customer.
Analytics that measure the success of touchpoints should look at
customer’s earlier communications activity, their carryover and spillover
effects, and their relative incremental impact. One study found that neither
the last click nor the seven-day average metric are good measures for
understanding the impact of firm and consumer-initiated channels. These
single metrics only consider visits that result in immediate conversion.
33
Quantifying the Benefits and Costs of Mapping
One study argues that the ability to shape customer journeys will become
a decisive source of competitive advantage.
34
Researchers found that
performance on journeys is 30 to 40 percent more strongly correlated with
customer satisfaction than performance on specific touchpoints and 20 to 30
percent more strongly correlated with such business outcomes as high
revenue, repeat purchase, low customer churn, and positive word of mouth.
35
A McKinsey study of over 100 B2B sales organizations found that
organizations that are ready to meet customers at different points in their
purchase journeys are better able to exploit digital tools, allocate sales and
marketing resources, and stimulate collaboration between sales and
marketing functions. Among the benefits of mapping were an up to 20
percent increase in customer leads, a 10 percent growth in first-time
customers, and a decrease of up to 20 percent of the time interval between
qualifying a lead and closing a sale.
36
A major European bank sought to improve customer satisfaction and
reduce its overall costs by 35 percent. The bank mapped its 10 most important
journeys including the mortgage process, new business and personal
customers, and retirement planning. After an 18 month process, the bank
achieved lower operating costs, a close to 20 percent increase in online
customers, and an over 50 percent increase in the number of customers using
its mobile app.
37
Another important financial benefit of mapping is the better allocation of
marketing budgets to different consumer buying process stages. Through an
analysis of dozens of marketing budgets, McKinsey consultants found that 70
to 90 percent of advertising and retail promotion expenditures were
incorrectly directed at the consider and buy stages.
38
The study concluded
that consumers are more influenced during the evaluate and enjoy-advocate-

Seven Steps of Customer Purchase Journey Mapping
96 Rutgers Business Review Spring 2020
bond stages. In many categories the single most important impetus to
purchase was another consumer’s advocacy. A product with weak reviews or
without online discussion is not likely to survive the winnowing process.
Likewise, an analysis of the purchase journey of National Hockey League
ticket holders found several past strategies to be ineffective. Contrary to
belief among salespeople with little experience, text-based communications
alone had a negative effect on the sale of full memberships. Individuals that
purchased single game tickets were found to be less likely to buy season
tickets. Data from customer purchase mapping suggests that moving
customers first to smaller plans is more effective in selling bigger ticket
subscriptions.
39
Accurately estimating the costs for delivering each service element can be
difficult. The Royal Bank of Scotland found that its accounting system did not
accumulate costs for each customer journey. As a result, the total costs of
service delivery were not visible to those making customer management-
based decisions. To correct this problem, the bank changed its simple
overhead allocation approach to consumption volume cost accounting. This
enabled costs to be allocated costs by product, by journeys within each
product, and finally by individual services in each product journey.
40
Traditional Web-based measures (such as shopping cart abandonment,
acquisition rate, bounce rate) and store-based measures (such as sales per
square foot or same store sales growth) need to be replaced by measures that
look at the interaction of touchpoints, the flow of consumers from trial to
purchase, and consumer satisfaction throughout the purchase process.
Interaction-based measures include net promoter scores, customer loyalty
measures, and customer satisfaction measures. These metrics measure a
customer’s overall experience as opposed to their experience at one stage of
the overall customer journey.
Avoiding Pitfalls in Planning and Implementing Purchase Journey
Mapping
There are a number of pitfalls firms need to avoid in planning and
implementing purchase mapping. These deal with treating each touchpoint
as a separate experience, ignoring the customer’s omnichannel experience,
errors in data collection and analysis, and not recognizing that the consumer
purchase map is subject to rapid change.
A common error is for a firm to look at each touchpoint as a separate
experience rather than as the interaction of a series of experiences. A
consumer defection, for example, can be the culmination of a series of
unsatisfactory experiences as opposed to the most recent negative
experience. The customer experience also needs to be evaluated from a

Seven Steps of Customer Purchase Journey Mapping
Rutgers Business Review
Vol. 5, No. 1
97
holistic perspective and include contact with personnel connected to billing,
scheduling of service calls, and service delivery.
Another set of pitfalls involves management policies that interfere with
an omnichannel-based purchase process flow. These include an omnichannel
retailer’s having different prices in-store versus online, using different SKU
designations in different channels, and/or a Web site’s having a different look
and feel on laptops, mobile devices and tablets.
Managing the complexity of data collection and analysis related to
touchpoints, channels, and customer satisfaction is quite difficult. Some of
the data are quantitative, while others are qualitative. One study of 350
executives found that 41 percent of respondents did not feel confident that
they have all of the information to understand their consumers and to deliver
better experiences.
41
Lastly, mapping needs to be continually updated to reflect changes in
competition, technology, and consumer behavior. As an example, the role of
geofencing in mobile marketing can have a drastic effect on consumer
behavior. Similarly, solutions suggested by journey mapping need to be
validated. Firms need to be aware that clearing up one problem area may lead
to issues involved in another.
Conclusion
Consumer purchase mapping is an important technique to better
understand consumer behavior in the current omnichannel environment. It
is not uncommon for a consumer to become aware of a product from a
specialty magazine, to evaluate the product based on an in-store
demonstration, to read product reviews online, to research in-store product
availability online, and to purchase the product at the nearest store.
Much current research looks at the role of selected devices and
touchpoints and not their interaction, or evaluates marketing based on the
accumulation of experiences as opposed to individual paths.
42
In contrast,
the mapping process enables marketers and academics to see the interaction
among touchpoints, to determine the most relevant message for each stage
and device, and to better visualize and more fully understand drop-outs
within the purchase process.
The transition to mapping requires firms reexamine their organization
format, seek synergies and reduce drop-outs across multiple touchpoints,
and develop appropriate broad-based marketing objectives. The firm’s
organization format needs to look at consumer behavior that spans multiple
touchpoints, devices and channels.
A good mapping process recognizes that customers will not always follow
the same path. Due to these distinct paths a customer can use, marketers

Seven Steps of Customer Purchase Journey Mapping
98 Rutgers Business Review Spring 2020
need to make sure that the appropriate follow-up interaction is available
between all channels and touchpoints.
43
Lastly, journey mapping enables
firms to assess their performance based on the journey’s outcome and total
customer experience, instead of looking at specific satisfaction metrics based
on single touchpoints.
A firm’s readiness to utilize purchase mapping can be characterized into
one of three stages. In Stage 1 a firm begins to recognize the importance of
journey mapping and is exploring its usefulness. Stage 1 firms have conducted
little planning in conjunction with mapping beyond looking at very
preliminary cost-benefit analysis. In Stage 2 firms begin to utilize journey
mapping on a limited basis scale (perhaps studying the shopping behavior of
heavy product users or looking at the most popular sequence of activities
pursued by their customers). Firms in Stage 2 may decide to initially
outsource selected aspects of journey mapping. Stage 3 firms demonstrate
the greatest commitment to journey mapping as evidenced by the complexity
of their models. Many Stage 3 firms have gone through the sequence of Stages
1 and 2. While some Stage 3 firms have developed their own infrastructure
for implementing journey mapping, others have chosen to outsource selected
aspects of journey mapping.
Author
Barry Berman is the Walter H. ‘Bud’ Distinguished Professor of Business and the
Academic Director of the E.M.B.A. program at the Frank G. Zarb School of Business,
Hofstra University. He is the author of textbooks in retailing and marketing and
articles in such journals as Business Horizons, California Management Review, and
the International Journal of Retail and Distribution Management. He is also author
of Competing in Tough Times (Financial Times Press). Dr. Berman has consulted
for a variety of organizations including Frankemuth Insurance, Duane-Reade, NCR,
Simon Properties, and Tesco Ireland. Dr. Berman has served as President of the
American Collegiate Association (ACRA) and was co-founder of the American
Marketing Association Special Interest Group in Retailing and Retail Management.
He is the recipient of the Hall of Fame Award from ACRA, Teacher of the Year
Award from the Hofstra M.B.A. Association, and Alumni Achievement award from
the Ph.D. Alumni Association of C.U.N.Y.
email: [email protected]
Endnotes
1. Court, D., Elzinga, D., Mulder, S., & Vetvik, O. (2009, June). The consumer decision
journey. McKinsey and Company.
2. Kim, C.K., & Mauborgne, R. (2004). Blue ocean strategy. Boston, MA: Harvard Business
School Press.

Seven Steps of Customer Purchase Journey Mapping
Rutgers Business Review
Vol. 5, No. 1
99
3. Rawson, A, Duncan, E., & Jones, C. (2013). The truth about customer experience. Harvard
Business Review, 91(9), 90-98.
4. MSI (n.d.). Understanding Customers, Research Priorities, 2014-2016. Cambridge, M.A.:
Marketing Science Institute.
5. George, M., & Wakefield, K.L. (2018). Modeling the consumer journey for membership
services. Journal of Services Marketing, 12(2), 113-125.
6. Berman, B., & Thelen, S. (2018). Planning and implementing an effective omnichannel
program. International Journal of Retail and Distribution Management, 46(7), 598-614.
7. Court, D., Elzinga, D., Mulder, S., & Vetvik, O. (2009, June). The consumer decision
journey. McKinsey and Company.
8. Ibid.
9. Lingqvist, O., Plotkin, C.A., & Stanley J. (2015, February). Do you really understand how
your business customers buy? McKinsey and Company.
10. KPMG. (2017). The Path to Purchase Journey. KPMG International Cooperative.
11. Whitler, K.A. (2018, September 8). If you think that the customer journey is linear or a
funnel, new research suggests you are wrong. Forbes.
12. Brown, M., Moriarty, M. & Mendoza-Pena, A. (2014). On Solid Ground: Brick-and-Mortar
is the Foundation of Omnichannel Retailing. A.T. Kearney.
13. Ibid.
14. Rawson, A, Duncan, E., & Jones, C. (2013). The truth about customer experience. Harvard
Business Review, 91(9), 90-98.
15. Bollard, A., Larrea, E., Singla, A., & Sood, R. (2017, March). The next generation operating
model for the digital world. McKinsey and Company.
16. Rawson, A., Duncan, E., & Jones, C. (2013). The truth about customer experience.
Harvard Business Review, 91(9), 90-98.
17. Maklan, S., Antonetti, P., & Whitty, S. (2017). A better way to manage customer
experience: Lessons from the Royal Bank of Scotland. California Management Review,
59(2), 92-115.
18. Rawson, A., Duncan, E., & Jones, C. (2013). The truth about customer experience.
Harvard Business Review, 91(9), 90-98.
19. Maklan, S., Antonetti, P., & Whitty, S. (2017). A better way to manage customer
experience: Lessons from the Royal Bank of Scotland. California Management Review,
59(2), 92-115.
20. Bollard, A., Larrea, E., Singla, A., & Sood, R. (2017, March). The next generation operating
model for the digital world. McKinsey and Company.
21. Sweetwood, A.K. (2016, August 23). How one company used data to rethink the customer
journey. Harvard Business Review.
22. Edelman, D.C. (2010). Branding in the digital age: You're spending your money in all the
wrong places. Harvard Business Review, 88(12), 62-69.
23. Qaqish, D. (2018, July 10). Customer journey mapping in three steps. American Marketing
Association Marketing News.
24. Tincher, L. (2017, August 31). Driving change through journey mapping. Heart of the
Customer.
25. Fluss, D. (2017). Will customer journey analytics be the next CRM? Customer
Relationship Management 21(5), 6.
26. Edelman, D.C., & Singer, M. (2015). Competing on customer journeys. Harvard Business
Review, 93(11), 88-97.
27. Addis, M. (2016). Understanding the customer journey to create excellent experiences in
bookstores. International Journal of Marketing Studies, 8(4), 20-36.

Seven Steps of Customer Purchase Journey Mapping
100 Rutgers Business Review Spring 2020
28. van der Veen, G., & van Ossenbruggen, R, (2015). Mapping out the customer's journey:
Customer search strategy as a basis for channel management. Journal of Marketing
Channels, 22, 202-213.
29. Addis, M. (2016). Understanding the customer journey to create excellent experiences in
bookstores. International Journal of Marketing Studies, 8(4), 20-36.
30. Rawson, A, Duncan, E., & Jones, C. (2013). The truth about customer experience. Harvard
Business Review, 91(9), 90-98.
31. Maklan, S., Antonetti, P., & Whitty, S. (2017). A better way to manage customer
experience: Lessons from the Royal Bank of Scotland. California Management Review,
59(2), 92-115.
32. Lamont, J. (2016, October 30). Web analytics: Insights into the customer journey. KM
World.
33. Li, H., & Kannan, P. K. (2014). Attributing conversions in a multichannel online
marketing environment: An empirical model and a field experiment. Journal of
Marketing Research, 51(1), 40-56.
34. Edelman, D. C., & Singer, M. (2015). Competing on customer journeys. Harvard Business
Review, 93(11), 88-97.
35. Rawson, A., Duncan, E., & Jones, C. (2013). The truth about customer experience.
Harvard Business Review, 91(9), 90-98.
36. Lingqvist, O., Plotkin, C. A., & Stanley, J. (2015, February). Do you really understand how
your business customers buy? McKinsey and Company.
37. Bollard, A., Larrea, E., Singla, A., & Sood, R. (2017, March). The next generation operating
model for the digital world. McKinsey and Company.
38. Edelman, D. C., & Singer, M. (2015). Competing on customer journeys. Harvard Business
Review, 93(11), 88-97.
39. George, M., & Wakefield, K.L. (2018). Modeling the consumer journey for membership
services. Journal of Services Marketing, 12(2), 113-125.
40. Maklan, S., Antonetti, P., & Whitty, S. (2017). A better way to manage customer
experience: Lessons from the Royal Bank of Scotland. California Management Review,
59(2), 92-115.
41. Ollila, E. (2018, September 24). Five issues with your customer experience strategy.
SmarterCX.
42. Stein, A., & Ramaseshan, B. (2016). Towards the identification of customer experience
touch point elements. Journal of Retailing and Consumer Services, 30, 8-19.
43. Kolsky, E. (2015, April 1). Why journey mapping wastes time and money. Destination
CRM.
