
Iowa Energy Efficiency Statewide Technical Reference Manual – Volume 3: Nonresidential Measures
Iowa Energy Efficiency Statewide
Technical Reference Manual
Version 5.0
Volume 3: Nonresidential Measures
FINAL: July 22, 2020
Effective: January 1, 2021
Filed with the Iowa Utilities Board on September 23, 2020, EEP-2018-0002

Iowa Energy Efficiency Statewide Technical Reference Manual – Volume 3: Nonresidential Measures
[INTENTIONALLY LEFT BLANK]
Filed with the Iowa Utilities Board on September 23, 2020, EEP-2018-0002

Iowa Energy Efficiency Statewide Technical Reference Manual – Table of Contents
Vol.3 Nonresidential Measures July 22, 2020 FINAL Page 3 of 410
Table of Contents
Volume 1: Overview and User Guide
Volume 2: Residential Measures
Volume 3: Nonresidential Measures ...................................................................................................................... 7
3.1. Agricultural Equipment ............................................................................................................................ 7
3.1.1. Circulation Fans .......................................................................................................................................... 7
3.1.2. Ventilation Fans ........................................................................................................................................ 10
3.1.3. High Volume Low Speed Fans ................................................................................................................... 13
3.1.4. Temperature Based On/Off Ventilation Controller .................................................................................. 16
3.1.5. Automatic Milker Take Off ....................................................................................................................... 18
3.1.6. Dairy Scroll Compressor ........................................................................................................................... 20
3.1.7. Heat Lamp................................................................................................................................................. 23
3.1.8. Heat Reclaimer ......................................................................................................................................... 25
3.1.9. Heat Mat ................................................................................................................................................... 28
3.1.10. Grain Dryer .......................................................................................................................................... 32
3.1.11. Live Stock Waterer ............................................................................................................................... 34
3.1.12. Low Pressure Irrigation ........................................................................................................................ 36
3.1.13. Variable Speed Frequency Drive for Dairy Vacuum Pump and Milking Machine ................................ 38
3.1.14. Dairy Plate Cooler ................................................................................................................................ 40
3.1.15. LED Grow Lights ................................................................................................................................... 43
3.1.16. Grain Bin Fan Aeration Controls .......................................................................................................... 48
3.2. Hot Water .............................................................................................................................................. 54
3.2.1. Low Flow Faucet Aerators ........................................................................................................................ 54
3.2.2. Low Flow Showerheads ............................................................................................................................ 62
3.2.3. Gas Hot Water Heater .............................................................................................................................. 67
3.2.4. Controls for Central Domestic Hot Water ................................................................................................ 74
3.2.5. Pool Covers ............................................................................................................................................... 76
3.2.6. Drainwater Heat Recovery ....................................................................................................................... 79
3.3. Heating, Ventilation, and Air Conditioning (HVAC) ................................................................................. 84
3.3.1. Boiler ........................................................................................................................................................ 86
3.3.2. Furnace ..................................................................................................................................................... 90
3.3.3. Furnace Blower Motor.............................................................................................................................. 93
3.3.4. Heat Pump Systems .................................................................................................................................. 96
3.3.5. Geothermal Source Heat Pump .............................................................................................................. 102
Filed with the Iowa Utilities Board on September 23, 2020, EEP-2018-0002

Iowa Energy Efficiency Statewide Technical Reference Manual – Table of Contents
Vol.3 Nonresidential Measures July 22, 2020 FINAL Page 4 of 410
3.3.6. Single-Package and Split System Unitary Air Conditioners ..................................................................... 108
3.3.7. Electric Chiller ......................................................................................................................................... 114
3.3.8. Package Terminal Air Conditioner (PTAC) and Package Terminal Heat Pump (PTHP)............................ 119
3.3.9. Guest Room Energy Management (PTAC) .............................................................................................. 124
3.3.10. Boiler Tune-up ................................................................................................................................... 127
3.3.11. Furnace Tune-Up ............................................................................................................................... 130
3.3.12. Small Commercial Thermostats ......................................................................................................... 133
3.3.13. Variable Frequency Drives for HVAC Pumps and Cooling Tower Fans .............................................. 137
3.3.14. Variable Frequency Drives for HVAC Supply and Return Fans ........................................................... 141
3.3.15. Duct Insulation ................................................................................................................................... 146
3.3.16. Duct Repair and Sealing ..................................................................................................................... 152
3.3.17. Chiller Pipe Insulation ........................................................................................................................ 158
3.3.18. Hydronic Heating Pipe Insulation ...................................................................................................... 162
3.3.19. Shut Off Damper for Space Heating Boilers or Furnaces ................................................................... 167
3.3.20. Room Air Conditioner ........................................................................................................................ 170
3.3.21. Room Air Conditioner Recycling ........................................................................................................ 174
3.3.22. Steam Trap Replacement or Repair ................................................................................................... 177
3.3.23. Electric HVAC Tune-up ....................................................................................................................... 181
3.4. Lighting ................................................................................................................................................ 185
3.4.1. Compact Fluorescent Lamp - Standard .................................................................................................. 187
3.4.2. Compact Fluorescent Lamp - Specialty ................................................................................................... 192
3.4.3. LED Lamp Standard ................................................................................................................................. 198
3.4.4. LED Lamp Specialty ................................................................................................................................. 204
3.4.5. LED Fixtures ............................................................................................................................................ 213
3.4.6. T5 HO Fixtures and Lamp/Ballast Systems ............................................................................................. 221
3.4.7. High Performance and Reduced Wattage T8 Fixtures and Lamps ......................................................... 225
3.4.8. Metal Halide ........................................................................................................................................... 229
3.4.9. Commercial LED Exit Sign ....................................................................................................................... 233
3.4.10. LED Street Lighting ............................................................................................................................. 237
3.4.11. LED Traffic and Pedestrian Signals ..................................................................................................... 240
3.4.12. Lighting Controls ................................................................................................................................ 243
3.4.13. Daylighting Control ............................................................................................................................ 247
3.4.14. Multi-Level Lighting Switch ................................................................................................................ 248
3.5. Miscellaneous ...................................................................................................................................... 252
3.5.1. Variable Frequency Drives for Process ................................................................................................... 252
Filed with the Iowa Utilities Board on September 23, 2020, EEP-2018-0002

Iowa Energy Efficiency Statewide Technical Reference Manual – Table of Contents
Vol.3 Nonresidential Measures July 22, 2020 FINAL Page 5 of 410
3.5.2. Clothes Washer....................................................................................................................................... 255
3.5.3. Motors .................................................................................................................................................... 261
3.5.4. Forklift Battery Charger .......................................................................................................................... 266
3.6. Food Service ......................................................................................................................................... 271
3.6.1. Dishwasher ............................................................................................................................................. 271
3.6.2. Commercial Solid and Glass Door Refrigerators & Freezers................................................................... 280
3.6.3. Pre-Rinse Spray Valve ............................................................................................................................. 284
3.6.4. Infrared Upright Broiler .......................................................................................................................... 288
3.6.5. Infrared Salamander Broiler ................................................................................................................... 291
3.6.6. Infrared Charbroiler ................................................................................................................................ 294
3.6.7. Convection Oven .................................................................................................................................... 297
3.6.8. Conveyor Oven ....................................................................................................................................... 301
3.6.9. Infrared Rotisserie Oven ......................................................................................................................... 304
3.6.10. Commercial Steam Cooker ................................................................................................................ 307
3.6.11. Fryer ................................................................................................................................................... 313
3.6.12. Griddle ............................................................................................................................................... 318
3.7. Shell Measures ..................................................................................................................................... 322
3.7.1. Infiltration Control .................................................................................................................................. 323
3.7.2. Foundation Wall Insulation .................................................................................................................... 329
3.7.3. Roof Insulation........................................................................................................................................ 334
3.7.4. Wall Insulation ........................................................................................................................................ 340
3.7.5. Efficient Windows ................................................................................................................................... 345
3.7.6. Insulated Doors....................................................................................................................................... 351
3.8. Refrigeration ........................................................................................................................................ 356
3.8.1. LED Refrigerator Case Light Occupancy Sensor ...................................................................................... 356
3.8.2. Door Heater Controls for Cooler or Freezer ........................................................................................... 359
3.8.3 Efficient Motors for Walk-in and Display Case Coolers / Freezers ......................................................... 362
3.8.4 Night Covers for Open Refrigerated Display Cases ................................................................................. 365
3.8.5. Refrigerated Beverage Vending Machine ............................................................................................... 367
3.8.6. Refrigerator and Freezer Recycling ........................................................................................................ 370
3.8.7. Scroll Refrigeration Compressor ............................................................................................................. 378
3.8.8. Strip Curtain for Walk-in Coolers and Freezers ...................................................................................... 382
3.8.9. Ice Maker ................................................................................................................................................ 385
3.8.10. Efficient Motor Controls for Walk-In and Display Case Coolers/Freezers ......................................... 390
Filed with the Iowa Utilities Board on September 23, 2020, EEP-2018-0002

Iowa Energy Efficiency Statewide Technical Reference Manual – Table of Contents
Vol.3 Nonresidential Measures July 22, 2020 FINAL Page 6 of 410
3.8.11. Adding Doors to Open Refrigeration Display Cases ........................................................................... 393
Refrigeration Economizers ................................................................................................................. 398
3.9. Compressed Air .................................................................................................................................... 401
3.9.1. Air Compressor with Integrated VSD ...................................................................................................... 401
3.9.2. High Efficiency Air Nozzles ...................................................................................................................... 404
3.9.3. No Loss Condensate Drains .................................................................................................................... 408
Filed with the Iowa Utilities Board on September 23, 2020, EEP-2018-0002

Iowa Energy Efficiency Statewide Technical Reference Manual—3.1.1 Circulation Fans
Vol.3 Nonresidential Measures July 22, 2020 FINAL Page 7 of 410
Volume 3: Nonresidential Measures
3.1. Agricultural Equipment
3.1.1. Circulation Fans
DESCRIPTION
Agricultural circulation fans are fans located in barns to provide air movement that helps to keep animals cool.
Circulation fan efficiency is expressed as CFM
1
/watt and is derived from the thrust efficiency ratio (TER) in pounds
force per watt (lbf/W).
The measure applies to newly installed circulation fans or replacing an existing unit that reached the end of its useful
life in agricultural applications.
This measure was developed to be applicable to the following program types: TOS.
If applied to other program types, the measure savings should be verified.
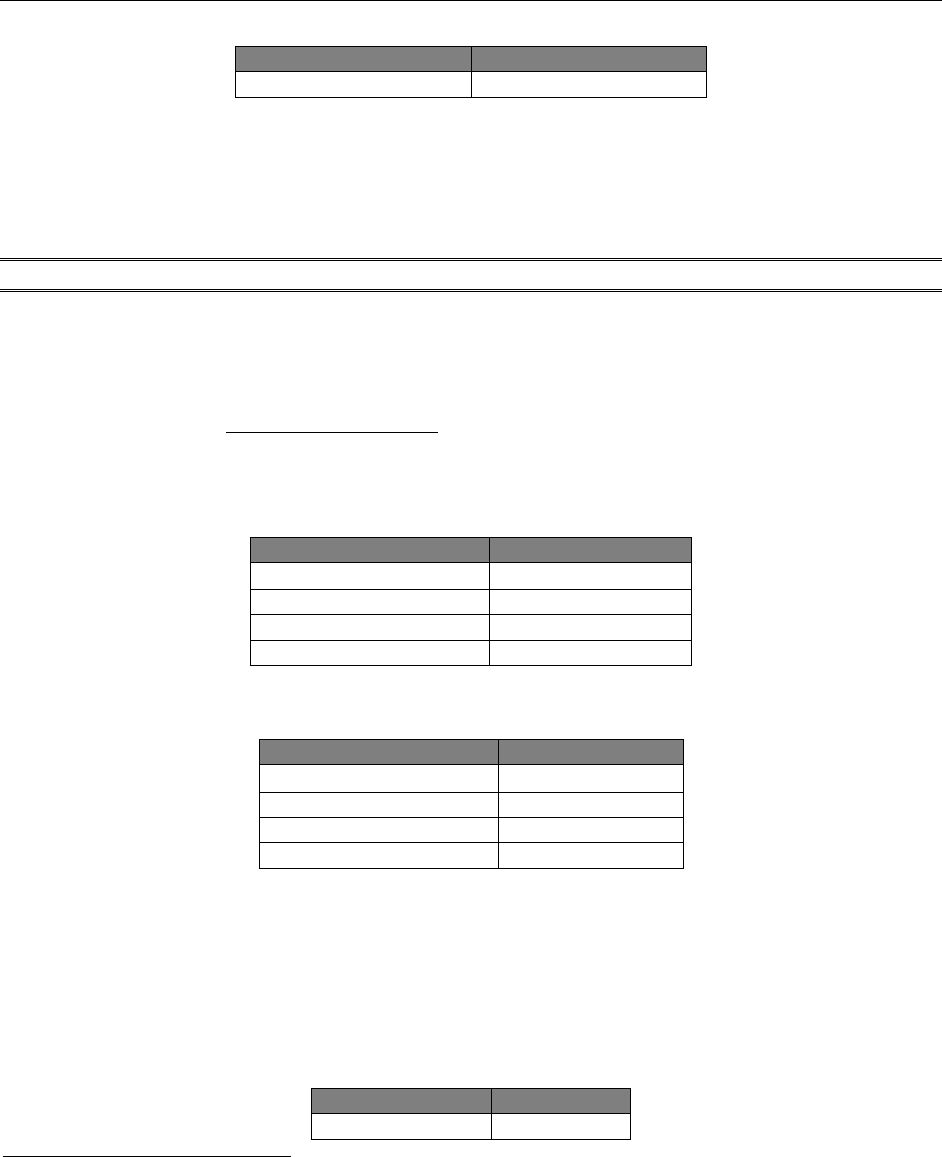
DEFINITION OF EFFICIENT EQUIPMENT
In order for this characterization to apply, the efficient equipment must be certified by BESS Labs
2
with fan diameters
above 12 inches that meet program minimum efficiency requirements.
Diameter of
Fan (inches)
IPL Minimum
Efficiency (CFM/Watt)
12-23
10.7
24-35
11.5
36-47
19.0
48+
21.5
Efficient fans are assumed to be governed by thermostatic on/off controls.
DEFINITION OF BASELINE EQUIPMENT
The baseline condition is assumed to be a new fan that does not meet program requirements. This characterization
assumes that the baseline condition uses on/off thermostatic controls to automatically operate the fans above a
designated temperature threshold and shut them off when temperature drops below setpoint.
DEEMED LIFETIME OF EFFICIENT EQUIPMENT
The expected measure life is assumed to be 10 years.
3
DEEMED MEASURE COST
Actual full installed costs may be used along with the following baseline cost assumptions:
4
1
Cubic Feet per Minute
2
University of Illinois, Department of Agricultural and Biological Engineering. http://bess.illinois.edu/
3
Average motor life is calculated by dividing the estimated motor life (35,000 hours) divided by the annual run hours, taken to
be the unknown/other farm commodity type of 3,259 hours (see description of default run hours on following page); and
rounded down to nearest whole year. Motor life source, U.S. Department of Energy Advanced Manufacturing Office, Motor
Systems Tip Sheet #3.
4
Baseline full installed costs from Act on Energy Commercial Technical Reference Manual No. 2010-4. Cost for 12-23” diameter
Filed with the Iowa Utilities Board on September 23, 2020, EEP-2018-0002

Iowa Energy Efficiency Statewide Technical Reference Manual—3.1.1 Circulation Fans
Vol.3 Nonresidential Measures July 22, 2020 FINAL Page 8 of 410
Diameter of Fan (inches)
Baseline Cost
12-23
$375
24-35
$450
36-47
$525
48+
$600
If actual costs are not available, assume an incremental total installed cost of$150.
5
LOADSHAPE
Loadshape NREV06-Industrial Ventilation
Algorithm
CALCULATION OF SAVINGS
ELECTRIC ENERGY SAVINGS
Where:
Watts_base
6
= Demand (W) of baseline fan
Diameter of Fan (inches)
Watts_base
12-23
366
24-35
615
36-47
810
48+
1358
Watts_ee
7
= Demand (W) of efficient fan
Diameter of Fan (inches)
Watts_ee
12-23
298
24-35
440
36-47
529
48+
993
Hours = Actual hours of operation. Typically, the fans will be operated above certain
temperature thresholds, and therefore the operating hours can be reasonably estimated
using the Ag Ventilation Operating Hours Calculator if temperature setpoints are known.
If not, the following table
8
can be used to establish operating hours by facility type (hog,
poultry, or dairy). For dairy facilities the typical temperature setpoint can be assumed to
be 67°F, for poultry and hog facilities it can be assumed to be 65°F and 60°F, respectively,
fans determined through extrapolation of costs for other fan sizes.
5
Act on Energy Commercial Technical Reference Manual No. 2010-4.
6
BESS fan database downloaded on 7/1/2015. Average watts from models below standard. AgCirculation Fans.xls
7
BESS fan database downloaded on 7/1/2015. Average watts from models above standard. AgCirculation Fans.xls
8
Based on TMY3 data for Des Moines. The unknown/other commodity type is a weighted average of hog, poultry, and dairy
facilities based on farm count as sourced from the U.S. 2017 Agriculture Census for Iowa. For more information on the
weighting, see: “Ventilation Op Hours_2020.xlsx”.
Filed with the Iowa Utilities Board on September 23, 2020, EEP-2018-0002

Iowa Energy Efficiency Statewide Technical Reference Manual—3.1.1 Circulation Fans
Vol.3 Nonresidential Measures July 22, 2020 FINAL Page 9 of 410
as these are the recommended temperatures above which comfort cooling should be
provided for livestock.
9
Facility Type
Annual Hours of Operation
Hog
3597
Poultry
2,862
Dairy
2,578
Unknown/Other
3,249
Nfans = Number of circulation fans
= Actual
SUMMER COINCIDENT PEAK DEMAND SAVINGS
Where:
CF = Summer Peak Coincidence Factor
= 100%
10
NATURAL GAS ENERGY SAVINGS
N/A
PEAK GAS SAVINGS
N/A
WATER IMPACT DESCRIPTIONS AND CALCULATION
N/A
DEEMED O&M COST ADJUSTMENT CALCULATION
N/A
MEASURE CODE: NR-AGE-CIRC-V04-210101
SUNSET DATE: 1/1/2024
9
Dairy Farm Energy Management Guide, Southern California Edison February, 2004. The guide recommends controlling fans in
order to provide maximum ventilation as necessary at 72°F and above due to heat stress concerns on cows at and above that
temperature. The 67°F balance point was developed assuming a 5°F temperature band, assuming the interior temperature of
the barn will be greater than that outside due to internal heat gains.
10
Industrial Ventilation CF from eQuest.
Filed with the Iowa Utilities Board on September 23, 2020, EEP-2018-0002

Iowa Energy Efficiency Statewide Technical Reference Manual—3.1.2 Ventilation Fans
Vol.3 Nonresidential Measures July 22, 2020 FINAL Page 10 of 410
3.1.2. Ventilation Fans
DESCRIPTION
Agricultural ventilation fans provide ventilation air to keep animals cool. Fan efficiency is expressed as CFM/watt
and is derived from the thrust efficiency ratio (TER) in pounds force per watt (lbf/kW).
The measure applies to newly installed ventilation fans or replacing an existing unit that reached the end of its useful
life in agricultural applications.
This measure was developed to be applicable to the following program types: TOS.
If applied to other program types, the measure savings should be verified.
DEFINITION OF EFFICIENT EQUIPMENT
In order for this characterization to apply, the efficient equipment must be certified by BESS Labs
11
with fan
diameters above 14 inches that meet program minimum efficiency requirements.
Diameter of Fan (inches)
IPL Minimum Efficiency
(CFM/Watt) at (0.05 SP
12
)
14-23
10.1
24-35
13.5
36-47
17.4
48+
20.3
Efficient fans are assumed to be governed by thermostatic on/off controls.
DEFINITION OF BASELINE EQUIPMENT
The baseline condition is assumed to be a new fan that does not meet program requirements. This characterization
assumes that the baseline condition uses on/off thermostatic controls to automatically operate the fans above a
designated temperature threshold and shut them off when temperature drops below setpoint.
DEEMED LIFETIME OF EFFICIENT EQUIPMENT
The expected measure life is assumed to be 7 years.
13
DEEMED MEASURE COST
Actual full installed costs may be used along with the following baseline cost assumptions:
14
Diameter of Fan (inches)
Baseline Cost
14-23
$375
24-35
$450
36-47
$525
11
University of Illinois, Department of Agricultural and Biological Engineering. http://bess.illinois.edu/
12
Static Pressure in units of inches of water
13
Average motor life is calculated by dividing the estimated motor life (35,000 hours) divided by the annual run hours, taken to
be the unknown/other farm commodity type of 4,800 hours (see description of default run hours on following page); and
rounded down to nearest whole year. Motor life source, U.S. Department of Energy Advanced Manufacturing Office, Motor
Systems Tip Sheet #3.
14
Baseline full installed costs from Act on Energy Commercial Technical Reference Manual No. 2010-4. Cost for 14-23”
diameter fans determined through extrapolation of costs for other fan sizes.
Filed with the Iowa Utilities Board on September 23, 2020, EEP-2018-0002
Iowa Energy Efficiency Statewide Technical Reference Manual—3.1.2 Ventilation Fans
Vol.3 Nonresidential Measures July 22, 2020 FINAL Page 11 of 410
Diameter of Fan (inches)
Baseline Cost
48+
$600
If actual cost not available, assume an incremental total installed cost of $150.
15
LOADSHAPE
Loadshape NREV06-Industrial Ventilation
Algorithm
CALCULATION OF SAVINGS
ELECTRIC ENERGY SAVINGS
Where:
Watts_base
16
= Demand (W) of baseline fan
Diameter of Fan (inches)
Watts_base (0.05 SP)
14-23
382
24-35
550
36-47
879
48+
1353
Watts_ee
17
= Demand (W) of efficient fan
Diameter of Fan (inches)
Watts_ee (0.05 SP)
14-23
304
24-35
383
36-47
565
48+
1041
Hours = Actual hours of operation. Typically, the fans will be operated in a staged fashion such
that only a fraction of total fans are operating in conditions that do not require maximum
installed capacity. Accordingly, effective full load hours (EFLH) should be determined
based on operating schedule and considering factors such as number of fans, stages, and
temperature band definitions. If this information is unavailable, the table below may be
used to reasonably estimate EFLH for hog, poultry, and dairy facilities, based on typical
control schedules.
18
Facility Type
Annual EFLH
Hog
4,923
15
Act on Energy Commercial Technical Reference Manual No. 2010-4.
16
BESS fan database downloaded on 7/1/2015. Average watts from models below standard (minimum efficiency requirement
detailed in the efficient equipment definition). For more detail, see: “AgVentilationFans.xls”
17
BESS fan database downloaded on 7/1/2015. Average watts from models above standard (minimum efficiency requirement
detailed in the efficient equipment definition). For more detail, see: “AgVentilationFans.xls”
18
See “Ventilation Op Hours_2020.xlsx” workbook for a complete description and derivation of default operating hours. EFLH
based on TMY3 data for Des Moines. The unknown/other commodity type is a weighted average of hog, poultry, and dairy
facilities based on farm count as sourced from the U.S. 2017 Agriculture Census for Iowa.
Filed with the Iowa Utilities Board on September 23, 2020, EEP-2018-0002

Iowa Energy Efficiency Statewide Technical Reference Manual—3.1.2 Ventilation Fans
Vol.3 Nonresidential Measures July 22, 2020 FINAL Page 12 of 410
Facility Type
Annual EFLH
Poultry
4,794
Dairy
4,205
Unknown/Other
4,800
Nfans = Number of ventilation fans
= Actual
SUMMER COINCIDENT PEAK DEMAND SAVINGS
Where:
CF = Summer Peak Coincidence Factor
= 100%
19
NATURAL GAS ENERGY SAVINGS
N/A
PEAK GAS SAVINGS
N/A
WATER IMPACT DESCRIPTIONS AND CALCULATION
N/A
DEEMED O&M COST ADJUSTMENT CALCULATION
N/A
MEASURE CODE: NR-AGE-VENT-V03-210101
SUNSET DATE: 1/1/2026
19
Industrial Ventilation CF from eQuest.
Filed with the Iowa Utilities Board on September 23, 2020, EEP-2018-0002

Iowa Energy Efficiency Statewide Technical Reference Manual—3.1.3 High Volume Low Speed Fans
Vol.3 Nonresidential Measures July 22, 2020 FINAL Page 13 of 410
3.1.3. High Volume Low Speed Fans
DESCRIPTION
High volume low speed (HVLS) fans provide air circulation to improve thermal comfort and indoor air quality. The
measure applies to HVLS fans that are replacing multiple less efficient conventional fans in agricultural applications.
This measure assumes single-speed, steady state operation for both baseline and efficient equipment.
This measure applies to the following program types: RF, NC.
If applied to other program types, the measure savings should be verified.
DEFINITION OF EFFICIENT EQUIPMENT
In order for this characterization to apply, the efficient equipment must be a fan with a diameter above 16 feet that
meets program minimum efficiency requirements.
DEFINITION OF BASELINE EQUIPMENT
As a retrofit measure, the actual existing conditions are taken as baseline. The number and wattage of the existing
fans shall be used to define baseline energy consumption. As a new construction measure, baseline is taken as the
total operating wattage of conventional fans required to match the flow rate (CFM) rating of the efficient equipment.
DEEMED LIFETIME OF EFFICIENT EQUIPMENT
The expected measure life is assumed to be 10 years.
20
MEASURE COST
As a retrofit measure, the actual installation cost should be used for screening and reporting purposes.
For a new construction measure, actual full installed costs may be used along with the following baseline cost
assumptions:
21
Diameter of Fan (feet)
Baseline Cost
16-17.9
$1210
18-19.9
$1460
20-23.9
$1840
24 +
$2090
If actual costs are unavailable for new construction, the incremental measure costs are as follows:
22
Diameter of Fan (feet)
Incremental Cost
16-17.9
$4100
18-19.9
$4130
20-23.9
$4190
24 +
$4230
20
Average motor life is calculated by dividing the estimated motor life (35,000 hours) divided by the annual run hours, taken to
be the unknown/other farm commodity type of 3,259 hours (see description of default run hours on following page); and
rounded down to nearest whole year. Motor life source, U.S. Department of Energy Advanced Manufacturing Office, Motor
Systems Tip Sheet #3.
21
Baseline full installed costs linearly extrapolated using cost data from the Illinois ActOnEnergy TRM No. 2010-4. Midpoints
were used to establish a single cost for each fan diameter category. Costs rounded up to the nearest $10.
22
Incremental costs linearly extrapolated using cost data from the Illinois ActOnEnergy TRM No. 2010-4. Midpoints were used
to establish a single cost for each fan diameter category. Costs rounded up to the nearest $10.
Filed with the Iowa Utilities Board on September 23, 2020, EEP-2018-0002

Iowa Energy Efficiency Statewide Technical Reference Manual—3.1.3 High Volume Low Speed Fans
Vol.3 Nonresidential Measures July 22, 2020 FINAL Page 14 of 410
LOADSHAPE
Loadshape– NREV06-Industrial Ventilation
Algorithm
CALCULATION OF SAVINGS
ELECTRIC ENERGY SAVINGS
Where:
N
base
= Number of baseline (conventional) fans being replaced (of equivalent wattage)
= Actual (for Retrofit projects). For new construction projects, the number of baseline
fans should be set equivalent to the number of HVLS fans being installed.
Watts
base
= Operating demand (W) of baseline fan
=Actual (Retrofit). For new construction projects refer to the New Construction HVLS
connected load savings table below.
N
ee
= Number of efficient fans installed (of equivalent wattage)
= Actual
Watts
ee
= Operating demand (W) of efficient fan
= Actual (Retrofit). For new construction projects refer to the New Construction HVLS
connected load savings table below.
New Construction HVLS Connected Load Savings
23
Diameter of Fan (feet)
Watts_base
Watts_ee
16-17.9
4497
761
18-19.9
5026
850
20-23.9
5555
940
24 +
6613
1119
Hours = Actual hours of operation. Typically, the fans will be operated above certain
temperature thresholds, and therefore the operating hours can be reasonably estimated
using the “Ag Ventilation Operating Hours Calculator”, if temperature setpoints are
known. If not, the following table
24
can be used to establish operating hours. For dairy
facilities the typical temperature setpoint can be assumed to be 67°F, for poultry and hog
facilities it can be assumed to be 65°F and 60°F, respectively, as these are the
recommended temperatures above which comfort cooling should be provided for
23
KEMA 2009 Evaluation of IPL Energy Efficiency Programs, Appendix F, Group 1 Programs, Volume 2 (Table 17). Typically, the
number of baseline conventional circulation fans the HVLS fan is off-setting is not a one for one replacement scenario. Due to
their more efficient design, a single HVLS fan can move and displace as much air as multiple conventional circulation fans. The
baseline wattage represents the equivalent quantity of baseline fans and their wattages to match that of a single HVLS fan.
24
Based on TMY3 data for Des Moines. The unknown/other commodity type is a weighted average of hog, poultry, and dairy
facilities based on farm count as sourced from the U.S. 2017 Agriculture Census for Iowa. For more information on the
weighting, see: “Ventilation Op Hours_2020.xlsx”.
Filed with the Iowa Utilities Board on September 23, 2020, EEP-2018-0002

Iowa Energy Efficiency Statewide Technical Reference Manual—3.1.3 High Volume Low Speed Fans
Vol.3 Nonresidential Measures July 22, 2020 FINAL Page 15 of 410
livestock.
25
Facility Type
Annual Hours of Operation
Hog
3597
Poultry
2,862
Dairy
2,578
Unknown/Other
3,259
SUMMER COINCIDENT PEAK DEMAND SAVINGS
Where:
CF = Summer Peak Coincidence Factor
= 100%
26
NATURAL GAS ENERGY SAVINGS
N/A
PEAK GAS SAVINGS
N/A
WATER IMPACT DESCRIPTIONS AND CALCULATION
N/A
DEEMED O&M COST ADJUSTMENT CALCULATION
N/A
MEASURE CODE: NR-AGE-HVLS-V03-210101
SUNSET DATE: 1/1/2026
25
Dairy Farm Energy Management Guide, Southern California Edison February, 2004. The guide recommends controlling fans in
order to provide maximum ventilation as necessary at 72°F and above due to heat stress concerns on cows at and above that
temperature. The 67°F balance point was developed assuming a 5°F temperature band, assuming the interior temperature of
the barn will be greater than that outside due to internal heat gains.
26
Industrial Ventilation CF from eQuest.
Filed with the Iowa Utilities Board on September 23, 2020, EEP-2018-0002

Iowa Energy Efficiency Statewide Technical Reference Manual—3.1.4 Temperature Based On/Off Ventilation
Controller
Vol.3 Nonresidential Measures July 22, 2020 FINAL Page 16 of 410
3.1.4. Temperature Based On/Off Ventilation Controller
DESCRIPTION
Temperature based on/off ventilation controllers on agricultural ventilation fans can reduce fan run times and save
energy. This measure applies to ventilation controllers installed on existing ventilation fans. Although the complexity
and intelligence of available controls can vary widely, this characterization claims savings strictly from the on/off
control of ventilation fans based on temperature. Additional savings may result from highly intelligent controls that
automate heating and cooling stages or multiple modes of ventilation. Savings from such controls are best handled
as a custom calculation because commissioning is required to optimize functionality based on unique site and design
considerations.
This measure was developed to be applicable to the following program types: RF.
If applied to other program types, the measure savings should be verified.
DEFINITION OF EFFICIENT EQUIPMENT
In order for this characterization to apply, a new ventilation controller is installed on new or existing ventilation fans.
Temperature based on/off control is considered industry standard practice for new ventilation systems and
therefore this characterization only applies to retrofit situations.
DEFINITION OF BASELINE EQUIPMENT
The baseline condition is assumed to be a fan that does not have a ventilation controller. It is assumed that fans are
operated continuously in their maximum capacity from the first hot day in spring to last hot day in fall. For hog
operations, “hot” is defined as temperatures above 60°F. For poultry operations, “hot” is defined as temperatures
above 65°F. And for dairy operations, “hot” is defined as temperatures above 70°F. Additionally, it is assumed that
for hog facilities, 30% of fans operate continuously, year-round to meet minimum ventilation requirements. For dairy
facilities, 10% of fans are assumed to operate continuously.
DEEMED LIFETIME OF EFFICIENT EQUIPMENT
The expected measure life is assumed to be 7 years.
27
DEEMED MEASURE COST
As a retrofit measure, the actual installation cost should be used for screening and reporting purposes.
LOADSHAPE
Loadshape NREV06-Industrial Ventilation
Algorithm
CALCULATION OF SAVINGS
ELECTRIC ENERGY SAVINGS
27
Average motor life 35,000 hours as estimated by U.S. Department of Energy Advanced Manufacturing Office, Motor Systems
Tip Sheet #3. The measure life was then derived by dividing by the average ventilation fan run time by the default of
unknown/other farm commodity, 4,800 hours.
Filed with the Iowa Utilities Board on September 23, 2020, EEP-2018-0002

Iowa Energy Efficiency Statewide Technical Reference Manual—3.1.4 Temperature Based On/Off Ventilation
Controller
Vol.3 Nonresidential Measures July 22, 2020 FINAL Page 17 of 410
Where:
Watts_fan = Total wattage of controlled fans
= Actual - If unknown, the following table can be used to estimate:
28
Diameter of Fan (inches)
Watts_fan (0.05 SP)
14-23
382
24-35
550
36-47
879
48+
1353
Hours
control
= Reduction in fan run hours due to controller
29
Facility Type
Hours
control
Hog
1,384
Poultry
877
Dairy
624
Unknown/Other
1,137
SUMMER COINCIDENT PEAK DEMAND SAVINGS
N/A - Assume no change in fan operation during summer coincident peak period, as fans will be running regardless
of thermostat controls and therefore no savings during peak period.
NATURAL GAS ENERGY SAVINGS
N/A
PEAK GAS SAVINGS
N/A
WATER IMPACT DESCRIPTIONS AND CALCULATION
N/A
DEEMED O&M COST ADJUSTMENT CALCULATION
N/A
MEASURE CODE: NR-AGE-VCON-V02-210101
SUNSET DATE: 1/1/2026
28
BESS fan database downloaded on 7/1/2015. Average watts from models considered baseline. AgVentilationFans.xls
29
Refer to “Ventilation Op Hours_2020.xlsx” workbook for a complete derivation. Reduced run time as a result of the
installation of a thermostatic controller is based on TMY3 weather data for Des Moines, Iowa. Additional factors are
incorporated into the analysis such as fan temperature settings and staging’s. The unknown/other commodity type is a
weighted average of hog, poultry, and dairy facilities based on farm count as sourced from the U.S. 2017 Agriculture Census for
Iowa.
Filed with the Iowa Utilities Board on September 23, 2020, EEP-2018-0002

Iowa Energy Efficiency Statewide Technical Reference Manual—3.1.5 Automatic Milker Take Off
Vol.3 Nonresidential Measures July 22, 2020 FINAL Page 18 of 410
3.1.5. Automatic Milker Take Off
DESCRIPTION
This measure characterizes the energy savings for the installation of automatic milker takeoffs on dairy milking
vacuum pump systems. Automatic Milker Takeoff measure reduces energy use by shutting off the milking vacuum
pump suction once a minimum flowrate has been achieved.
Because automatic milker takeoffs have been standard equipment in new milk parlors since 1995,
30
this measure is
limited to existing dairy parlors for which no size upgrade or other vacuum system improvement has happened.
DEFINITION OF BASELINE EQUIPMENT
The baseline is an existing dairy parlor with no previously existing automatic milker takeoff and no plans to increase
size and or make any other vacuum pump improvements.
DEEMED LIFETIME OF EFFICIENT EQUIPMENT
The expected measure life of a milker takeoff is 10 years.
31
DEEMED MEASURE COST
Retrofit measure, actual costs will be used.
.
LOADSHAPE
Loadshape NRE11 – Nonresidential Agriculture
Algorithm
CALCULATION OF SAVINGS
Electric Energy Savings:
Where:
kWh/cow/milking = 50
32
Nmilkings = Number of milkings per day
= Actual, if unknown use 2
33
30
Reinemann, D. “Milking Facilities for the Expanding Dairy” presented at the 1995 conference of the
WVMA. University of Wisconsin-Madison, Department of Agricultural Engineering Milking Research and
Instruction Lab.
31
Idaho Power Demand Side Management Potential Study – Volume II Appendices, Nexant, 2009
32
Alliant's Global Energy Partners impact calculations in DSM Tracking, 2006, and in agreement with IPL Energy Efficiency
Programs 2009 Evaluation, KEMA. Appendix F Program Evaluations Group 1, Vol 2.
33
Regional Technical Forum (RTF) as part of the Northwest Power & Conservation Council, Deemed Measures List; Agricultural:
Variable Frequency Drives-Dairy, FY2012, v1.2. Pre- and post-power meter data for five sites were used to establish RTF energy
savings and the raw data used to generate load profiles showed, on average, two milkings per day. For further detail on the
corroboration of this source, please see the 2016 Pennsylvania TRM.
Filed with the Iowa Utilities Board on September 23, 2020, EEP-2018-0002

Iowa Energy Efficiency Statewide Technical Reference Manual—3.1.5 Automatic Milker Take Off
Vol.3 Nonresidential Measures July 22, 2020 FINAL Page 19 of 410
Ncows = Number of milking cows per farm
= Actual; if unknown use 140
34
SUMMER COINCIDENT PEAK DEMAND SAVINGS:
Where:
FLH = Full Load Hours
= 2,703
35
CF = Coincidence Factor
= 0.793
36
NATURAL GAS ENERGY SAVINGS
N/A
PEAK GAS SAVINGS
N/A
WATER IMPACT DESCRIPTIONS AND CALCULATION
N/A
DEEMED O&M COST ADJUSTMENT CALCULATION
N/A
MEASURE CODE: NR-AGE-AMTO-V04-210101
SUNSET DATE: 1/1/2024
34
Entered from application form; default value is sourced from the 2017 U.S. Census of Agriculture, Iowa State Summary
Highlights, Full Report, Volume 1, Chapter 2, U.S. State Level, 397. Average number of cows per farm = 223,579 cows / 1,592
farms = 140
35
The full load hours are based on an average number of milkings per day of two, and assumptions on the average hours per
milking of 3.7 hours, with milking occurring 365.25 days a year. Source Milking System Air Consumption When Using a Variable
Speed Vacuum Pump. Paper Number: 033014 An ASAE Meeting Presentation. July 2003
36
Cadmus Loadshape analysis IA_Loadshapes_ WORKING DRAFT.xls
Filed with the Iowa Utilities Board on September 23, 2020, EEP-2018-0002

Iowa Energy Efficiency Statewide Technical Reference Manual—3.1.6 Dairy Scroll Compressor
Vol.3 Nonresidential Measures July 22, 2020 FINAL Page 20 of 410
3.1.6. Dairy Scroll Compressor
DESCRIPTION
This measure characterizes the energy savings from the installation of an efficient scroll compressor in place of a
reciprocating compressor for dairy parlor milk refrigeration.
This measure applies to the following program types: RF.
DEFINITION OF EFFICIENT EQUIPMENT
The criteria for this measure is a more efficient scroll compressor from 1 to 10 HP replacing an existing reciprocating
compressor with the same horsepower for dairy parlor milk refrigeration.
DEFINITION OF BASELINE EQUIPMENT
The baseline is the existing reciprocating compressor for dairy parlor milk refrigeration.
DEEMED LIFETIME OF EFFICIENT EQUIPMENT
The expected measure life is assumed to be 12 years.
37
DEEMED MEASURE COST
As a retrofit measure, the actual installation and equipment costs are used.
LOADSHAPE
Loadshape NRE01 - Non-Residential Refrigeration - Grocery
Algorithm
CALCULATION OF SAVINGS
ELECTRIC ENERGY SAVINGS
Where:
EER
Base
= Cooling efficiency of existing compressor in Btu/watt-hour
= Actual, if unknown use values from table below
38
EER
ee
= Cooling efficiency of efficient scroll compressor in Btu/watt-hour
= Actual, if unknown use values from table below
39
37
2014 Database for Energy-Efficiency Resources (DEER), Version 2014.2.04, “Effective/Remaining Useful Life Values”,
California Public Utilities Commission, February 4, 2014
(http://www.deeresources.com/files/DEER2013codeUpdate/download/DEER2014-EUL-table-update_2014-02-05.xlsx)
38
Efficiency Vermont TRM User Manual No. 2014-87 and spreadsheet compressor efficiency analysis EVT Refrigeration
2013.xlsx In 2013 data from compressor manufacturers was downloaded to calculate average efficiency available for various
categories of compressors. These average values are used for baseline efficiency.
39
Efficiency Vermont TRM User Manual No. 2014-87 and spreadsheet compressor efficiency analysis EVT Refrigeration
2013.xlsx In 2013 data from compressor manufacturers was downloaded to calculate average efficiency available for various
categories of compressors. These average values are used for baseline efficiency.
Filed with the Iowa Utilities Board on September 23, 2020, EEP-2018-0002

Iowa Energy Efficiency Statewide Technical Reference Manual—3.1.6 Dairy Scroll Compressor
Vol.3 Nonresidential Measures July 22, 2020 FINAL Page 21 of 410
Medium Temperature
Baseline and Qualifying EER
Condensing temp 90°F, Evap Temp 20°F
Capacity Bins in
BTU/Hr
HP
equivalent
Average
EERbase
Average
EERee
0-7500
1
8.14
9.03
7500-14999
2
9.28
10.86
15000-22499
3
10.64
11.83
22500-29999
4
11.18
12.15
30000-37499
5
11.12
12.39
37500-44999
6
11.74
12.70
45000-52499
7
11.68
12.52
52500-59999
8
12.54
13.12
60000-67499
9
12.46
13.13
67500-75000
10
11.44
12.37
Gal = Gallons of milk produced by one cow in a day
= 6
40
Days
yr
= Number of days per year
= 365.25
Specific
heat
= Specific heat of milk in Btu/lb-°F
= 0.93
41
Density
milk
= Density milk in lb/gal
= 8.6
ΔT = Required change in temperature (with precooler) in °F
= 19
42
Required change in temperature (without precooler) in °F
= 59
43
1000 =Conversion factor from watts to kilowatts
N
Cows
= Number of cows
= Actual, if unknown use 140 cows
44
40
IPL Energy Efficiency Programs 2009 Evaluation, KEMA, Appendix F Program Evaluations Group 1, Vol 2
41
IPL Energy Efficiency Programs 2009 Evaluation, KEMA, Appendix F Program Evaluations Group 1, Vol 2
42
IPL Energy Efficiency Programs 2009 Evaluation, KEMA, Appendix F Program Evaluations Group 1, Vol 2.
43
IPL Energy Efficiency Programs 2009 Evaluation, KEMA, Appendix F Program Evaluations Group 1, Vol 2.
44
Entered from application form; default value is sourced from the 2017 U.S. Census of Agriculture, Iowa State Summary
Highlights, Full Report, Volume 1, Chapter 2, U.S. State Level, 397. Average number of cows per farm = 223,579 cows / 1,592
farms = 140
Filed with the Iowa Utilities Board on September 23, 2020, EEP-2018-0002

Iowa Energy Efficiency Statewide Technical Reference Manual—3.1.6 Dairy Scroll Compressor
Vol.3 Nonresidential Measures July 22, 2020 FINAL Page 22 of 410
SUMMER COINCIDENT PEAK DEMAND SAVINGS
Where:
FLH =Full load hours. The refrigeration is assumed to be in operation every day of the year,
but because of compressor cycling the full load hours are 3910 hours for medium
temperature applications.
45
CF
= System Peak Coincidence Factor. Assume non-residential average of 96.4%
NATURAL GAS ENERGY SAVINGS
N/A
PEAK GAS SAVINGS
N/A
WATER IMPACT DESCRIPTIONS AND CALCULATION
N/A
DEEMED O&M COST ADJUSTMENT CALCULATION
N/A
MEASURE CODE: NR-AGE-SCROL-V04-210101
SUNSET DATE: 1/1/2021*
* This measure is overdue for a reliability review due to no utility currently offering the measure. If a utility plans to
start using this measure again, it should be reviewed accordingly.
45
Based on run time estimates from “Performance Standards for Walk-In Refrigerator and Freezer Systems,” AHRTI Report No.
09002-01, by Bryan R. Becker, et al., January 2012, Tables 30-33.
For example, for a 5 HP efficient scroll compressor (with precooler) replacing an existing reciprocating
compressor, serving 90 cows:
ΔkWh = (1/11.12 - 1/12.39) * 6 * 365.25 * 0.93 * 8.6 * 19 * 1/1000 * 90
= 276.3 kWh
For example, for a 5 HP efficient scroll compressor (with precooler) replacing an existing reciprocating
compressor, serving 90 cows:
ΔkW = (276.3/3910) * 0.964
= 0.0681 kW
Filed with the Iowa Utilities Board on September 23, 2020, EEP-2018-0002

Iowa Energy Efficiency Statewide Technical Reference Manual—3.1.7 Heat Lamp
Vol.3 Nonresidential Measures July 22, 2020 FINAL Page 23 of 410
3.1.7. Heat Lamp
DESCRIPTION
This measure characterizes the energy savings from the installation of a reduced wattage heat lamp to heat infant
animals (especially pigs) during the summer months.
DEFINITION OF EFFICIENT EQUIPMENT
The criteria for this measure is the reduced wattage heat lamp must be less than or equal to 125 watts.
DEFINITION OF BASELINE EQUIPMENT
The baseline is assumed to be a standard wattage heat lamp of 175 watts.
DEEMED LIFETIME OF EFFICIENT EQUIPMENT
The expected measure life is 1 year.
46
DEEMED MEASURE COST
Incremental cost is assumed to be $0.
47
LOADSHAPE
Loadshape C04 - Nonresidential Electric Heating
Algorithm
CALCULATION OF SAVINGS
ELECTRIC ENERGY SAVINGS
Where:
W
Base
= Wattage of baseline heat lamp
= 175 watts
48
Weff = Wattage of reduced wattage heat lamp
= Actual if known, otherwise assume 125 watts
49
46
The one year measure life is based on an expected lamp lifetime of approximately 5,000 hours
47
Internet search on http://www.qcsupply.com/ indicates no cost differential between 125 w and 175 w bulbs
48
The 175 watt baseline is based on standard practice based on discussions with IPL’s program manager Dave Warrington on
October 14, 2015.
49
The 125 watt bulb replaces a 175 watt bulb, baseline is based on discussions with IPL’s program manager Dave Warrington on
October 14, 2015
Filed with the Iowa Utilities Board on September 23, 2020, EEP-2018-0002

Iowa Energy Efficiency Statewide Technical Reference Manual—3.1.7 Heat Lamp
Vol.3 Nonresidential Measures July 22, 2020 FINAL Page 24 of 410
Hours = Annual heat lamp operating hours
50
= 5,105 hours
1,000 = Conversion factor from watts to kilowatts
= 1,000
Nunits = Number of units installed
= Actual
SUMMER COINCIDENT PEAK DEMAND SAVINGS
No summer coincident peak demand savings for heating measures
NATURAL GAS SAVINGS
N/A
PEAK GAS SAVINGS
N/A
WATER IMPACT DESCRIPTIONS AND CALCULATION
N/A
DEEMED O&M COST ADJUSTMENT CALCULATION
N/A
MEASURE CODE: NR-AGE-HTLP-V02-210101
SUNSET DATE: 1/1/2024
50
5,105 hours for the default value is based on: Calculation method from Iowa State University farm manager (Ben Drescher):
"At minimum I’d say they are on 24-7 from Oct-March, March-May 12 hours a day, June-September 8 hours a day. You’d also
take off for power washing, etc., so if you had a 24 day turn in a farrowing room you’d run them for 21 days and turn the room
subtract 3 days from x 15 turns a year - resulting in 5120 hours." 5120 is rounded up. Actual calculation results in 5,105 hours.
Additional information to support this hour value is an email sent 10/23/15. "FW: Heat lamp bulbs". Itron benchmarked the
HOU with their our analysis which resulted in 5,109 hours: 30.42 days/month; 3 months (summer) run 33% of time; 6 months
run 50% of time; 3 months (winter) run full time.
Filed with the Iowa Utilities Board on September 23, 2020, EEP-2018-0002

Iowa Energy Efficiency Statewide Technical Reference Manual—3.1.8 Heat Reclaimer
Vol.3 Nonresidential Measures July 22, 2020 FINAL Page 25 of 410
3.1.8. Heat Reclaimer
DESCRIPTION
This measure characterizes the energy savings from the installation of a milk house heat reclaimer to reduce waste
heat from milk cooling compressor. The heat reclaimer captures the waste heat from the compressors being
removed from the milk.
This measure applies to the following market: RF.
DEFINITION OF EFFICIENT EQUIPMENT
The criteria for this measure are new equipment must be of one of the following brands: Century-Therm,
FreHeater, Heat Bank, Sunset, Superheater and Therma-Stor. Also must have an electric water heater to achieve
electric savings.
DEFINITION OF BASELINE EQUIPMENT
The baseline is milk cooling compressor and electric water heater; no existing heat reclaimer installed.
DEEMED LIFETIME OF EFFICIENT EQUIPMENT
The expected measure life of a heat reclaimer is 15 years.
51
DEEMED MEASURE COST
As a retrofit measure, the actual installation cost should be used.
LOADSHAPE
Loadshape C04 - Nonresidential Electric Heating
Algorithm
CALCULATION OF SAVINGS
ELECTRIC ENERGY SAVINGS
Where:
Lbs of Milk = The pounds of milk produced per day per cow that needs to be cooled
= 51.6 lbs of milk per cow per day
52
= Specific heat of milk
= 0.93 Btu/(lb-°F)
= Change in milk temperature (°F)
51
PA Consulting Group Inc. “State of Wisconsin Public Service Commission of Wisconsin Focus on Energy Evaluation Business
Programs: Measure Life Study Final Report”, August 25, 2009
52
The pounds of milk produced per cow per day is based on an average cow producing 6 gallons of milk per day, with each
gallon of milk weighing approximately 8.6 pounds (6 gallons of milk per cow per day x 8.6 lbs = 51.6 lbs of milk per cow per day).
Filed with the Iowa Utilities Board on September 23, 2020, EEP-2018-0002

Iowa Energy Efficiency Statewide Technical Reference Manual—3.1.8 Heat Reclaimer
Vol.3 Nonresidential Measures July 22, 2020 FINAL Page 26 of 410
= 59 without precooler installed; 19 with precooler installed
Days = Number of milking days per year
= 365 days
Heat Available = 1,033,422 Btu/h per cow per year without precooler
= 332,797 Btu/h per cow per year with precooler
Where:
Hot Water = Gallons of hot water needed per cow per day
= 2.2 gallons per cow per day
= Density of water
= 8.33 lbs/gallon
= Specific heat of water
= 1 Btu/(lb-°F)
= Change in water temperature between the incoming water and the hot water leaving
the hot water heater
= 70°F
Heat Storage = 468,229 Btu/h per cow per year
These equations, for the reclaimable heat available from the milk (Heat Available) and for the heat required for the
hot water needs for the dairy (Heat Storage), reveal that the heat available from the milk limits the usable heat when
a precooler is installed. In the absence of a precooler, the heat storage limits the usable heat, as shown in Table 1
below.
Table 1 - Reclaimable Heat
Case
Btuh/yr
Limitation
No Precooler
468,229
Heat Storage
With Precooler
332,797
Heat Available
Where:
EF
elec
= Energy factor of the electric water heater
= Actual, if unknown use 0.90
53
Reclaimable Heat = Values shown in Table 1 in Btu/h per cow per year
3,412 = Btu to kWh electric conversion factor
53
Entered from application form; default value based on: IPL Energy Efficiency Programs 2009 Evaluation, KEMA, Appendix F
Program Evaluations Group 1, Vol 2.
Filed with the Iowa Utilities Board on September 23, 2020, EEP-2018-0002

Iowa Energy Efficiency Statewide Technical Reference Manual—3.1.8 Heat Reclaimer
Vol.3 Nonresidential Measures July 22, 2020 FINAL Page 27 of 410
Table 2 – Heat Reclaimer Savings
Case
kWh/Cow
No precooler installed
152.5
Precooler installed
108.4
This method requires the program to collect information on existing precooler installation. When rebating a
precooler and heat reclaimer at the same time, KEMA recommends that IPL follows the installation order discussed
above. This measure should be limited to electric or natural gas water heaters only. Customers with propane
water heaters will not achieve any electric or natural gas savings for this measure.
SUMMER COINCIDENT PEAK DEMAND SAVINGS
N/A
NATURAL GAS SAVINGS
N/A
PEAK GAS SAVINGS
N/A
WATER IMPACT DESCRIPTIONS AND CALCULATION
N/A
DEEMED O&M COST ADJUSTMENT CALCULATION
N/A
MEASURE CODE: NR-AGE-HTRE-V04-210101
SUNSET DATE: 1/1/2024
Filed with the Iowa Utilities Board on September 23, 2020, EEP-2018-0002

Iowa Energy Efficiency Statewide Technical Reference Manual—3.1.9 Heat Mat
Vol.3 Nonresidential Measures July 22, 2020 FINAL Page 28 of 410
3.1.9. Heat Mat
DESCRIPTION
This measure characterizes the energy savings from the replacement of heat lamps with heat mats. Heat lamps in
farrowing barns direct heat downward to keep the piglets warm. Replacing heat lamps with hog heat mats reduces
the amount of heat lost to the ambient air by heating directly beneath the piglets. Farrowing heat mats have a lower
wattage draw than the typical heat lamp setup, which results in annual energy savings.
DEFINITION OF EFFICIENT EQUIPMENT
The criteria for this measure are the reduced wattage heat mat must be less than or equal to 90 watts for a single
mat (typically sized at 14” x 60”) and then less than or equal to 180 watts for a double mat (typically sized at 24” x
60”). Additionally, the heat mats must replace an existing heat lamp system.
DEFINITION OF BASELINE EQUIPMENT
The baseline is standard wattage heat lamps.
DEEMED LIFETIME OF EFFICIENT EQUIPMENT
The expected measure life of a heat mat is 5 years.
54
DEEMED MEASURE COST
Incremental cost is assumed to be $225.
55
LOADSHAPE
Loadshape C04 - Non-Residential Electric Heating
Algorithm
CALCULATION OF ENERGY SAVINGS
56
ELECTRIC ENERGY SAVINGS
Where:
Mats
Single
= Number of single mats at 90 watts or less, actual
Mats
Double
= Number of single mats at 180 watts or less, actual
Savings
SingleMat
= Default energy savings per single mat, dependent on baseline heat lamp
(kWh/mat)
54
Professional judgement
55
Cost data comes from Hog Hearth Heat Mat Calculator “Rev 03 02 14 Copy of Electrical costs 5 ft heat mats.xls” .
Spreadsheet was shared with Cadmus but requested that document not be released publicly.
56
All variable values come from: IPL Custom Farrowing Heat Mat Calculator. For derivation of the default energy savings per
mat and per baseline heat lamp, please see: “IA TRM_Heat Mat Analysis_June 2020.xlsx”.
Filed with the Iowa Utilities Board on September 23, 2020, EEP-2018-0002

Iowa Energy Efficiency Statewide Technical Reference Manual—3.1.9 Heat Mat
Vol.3 Nonresidential Measures July 22, 2020 FINAL Page 29 of 410
Baseline Heat Lamp
kWh Savings
SingleMat
175 watts
657
125 watts
338
Savings
DoubleMat
= Default energy savings per double mat, dependent on baseline heat lamp
(kWh/mat)
Baseline Heat Lamp
kWh Savings
DoubleMat
175 watts
1,327
125 watts
817
Controller = Number of Controllers, actual
Controller Impact = 383 kWh/usage per controller
Custom calculation for heat mats shown below, otherwise use deemed values listed above.
Where:
Where:
Crates
Total
= Number of crates
= 234
Hours
Yr
= Annual hours of operation
=5,105 hours
57
Fixture
Crate
= Number of heat lamp fixtures per crate
=Actual. If unknown, use 1.25
57
While heat mat hours do vary from heat lamps slightly, the savings assumptions match heat lamp hours for consistency.
Calculation method from Iowa State University farm manager (Ben Drescher): "At minimum I’d say they are on 24-7 from Oct-
March, March-May 12 hours a day, June-September 8 hours a day. You’d also take off for power washing, etc., so if you had a
24 day turn in a farrowing room, you’d run them for 21 days and turn the room subtract 3 days from x 15 turns a year -
resulting in 5120 hours." Cadmus did not round data and estimated 5,105 hours. Email sent 10/23/15. "FW: Heat lamp bulbs".
Itron benchmarked the HOU with their own analysis which resulted in 5,109 hours: 30.42 days/month; 3 months (summer) run
33% of time; 6 months run 50% of time; 3 months (winter) run full time.
Filed with the Iowa Utilities Board on September 23, 2020, EEP-2018-0002

Iowa Energy Efficiency Statewide Technical Reference Manual—3.1.9 Heat Mat
Vol.3 Nonresidential Measures July 22, 2020 FINAL Page 30 of 410
Lamp
Fixture
= Number of heat lamps per fixture
=1
Wattage
Lamp
= Wattage of heat lamp
= Actual. If unknown, use 175 watts
1000 Watts/kW = Constant, conversion factor for watts to kW
Controller
Adv
= Controller advantage
=1
Rooms = Number of rooms per farrowing barn
= Actual. If unknown, use 9
MSU
Room
= Number of master sensor units (MSU) per room
=1
MSU
Wattage
= Wattage of master sensor unit
=75W
Crates
Single-Row
= Number of single crates per row
= Actual. If unknown, use 1
Single
Wattage
= Wattage of a 14” x 60” farrowing heat mat
= 90W
Single
Mat
= Number of 14” x 60” farrowing heat mats per single crate
= Actual. If unknown, use 1
Rows = Number of rows per room
= Actual. If unknown, use 2
Crates
Double-Row
= Number of Double Crates per Row
= Actual. If unknown, use 12
Double
Wattage
= Wattage of a 24” x 60” farrowing heat mat
=180W
Double
Mat
= Number of a 24” x 60” farrowing heat mat
=0.5
SUMMER COINCIDENT PEAK DEMAND SAVINGS
No summer coincident peak demand savings for heating measures
NATURAL GAS ENERGY SAVINGS
N/A
PEAK GAS SAVINGS
N/A
Filed with the Iowa Utilities Board on September 23, 2020, EEP-2018-0002

Iowa Energy Efficiency Statewide Technical Reference Manual—3.1.9 Heat Mat
Vol.3 Nonresidential Measures July 22, 2020 FINAL Page 31 of 410
WATER IMPACT DESCRIPTIONS AND CALCULATION
N/A
DEEMED O&M COST ADJUSTMENT CALCULATION
N/A
MEASURE CODE: NR-AGE-HTMT-V03-210101
SUNSET DATE: 1/1/2024
Filed with the Iowa Utilities Board on September 23, 2020, EEP-2018-0002

Iowa Energy Efficiency Statewide Technical Reference Manual—3.1.10 Grain Dryer
Vol.3 Nonresidential Measures July 22, 2020 FINAL Page 32 of 410
3.1.10. Grain Dryer
DESCRIPTION
This measure characterizes the energy savings from the replacement of an existing, old grain dryer with a new
grain dryer. Electric savings are achieved by replacing old grain dryers with new grain dryers that operate more
efficiently due to design improvements, increased throughput, capacity, production, and reduced hours of
operation.
DEFINITION OF EFFICIENT EQUIPMENT
The criteria for this measure is the Installation of a new electric grain dryer. Bushels per hour must be provided by
the manufacturer, rated at 5 points of moisture removal per bushel. Gas dryers and those with capacities larger
than 5,000 bushels/hour must go through the Custom Rebate program,
DEFINITION OF BASELINE EQUIPMENT
The baseline older grain dryers and is the same for retrofit, market opportunity, and new construction as old or
refurbished grain dryers are available on the market.
DEEMED LIFETIME OF EFFICIENT EQUIPMENT
The expected measure life of a grain dryer is 15 years.
58
DEEMED MEASURE COST
Actual material and labor costs should be used if the implementation method allows. If unknown the capital cost for
this measure is assumed to be the values as summarized in the table below.
59
Tier (bushels per hour)
Tier (annual bushels)
Average Incremental cost
< 500
< 170,000
$20,000
≥ 500 and < 1000
≥ 170,000 and < 330,000
$30,000
≥ 1000 and < 2000
≥ 330,000 and < 670,000
$40,000
≥ 2000 and < 3500
≥ 670,000 and < 1,200,000
$70,000
≥ 3500 and ≤ 5000
≥ 1,200,000 and ≤ 1,700,000
$100,000
LOADSHAPE
Loadshape NRE11 – Non-Residential Agriculture
Algorithm
CALCULATION OF SAVINGS
ELECTRIC ENERGY SAVINGS
Where:
Bushels
yr
= Number of average bushels dried per year
58
Estimate based on professional judgment
59
Source: Version 9_9_15 Formatted Grain Dryer Prescriptive.xls
Filed with the Iowa Utilities Board on September 23, 2020, EEP-2018-0002

Iowa Energy Efficiency Statewide Technical Reference Manual—3.1.10 Grain Dryer
Vol.3 Nonresidential Measures July 22, 2020 FINAL Page 33 of 410
= Actual, if unknown use table:
60
Savings Tier (Bushels/hr)
from manufacturer
Savings Tier (Bushels/yr)
Average Bushels/yr
≥ 2,000 and < 3,500
≥ 670,000 and < 1,200,000
900,000
≥ 3,500 and ≤ 5,000
≥ 1,200,000 and ≤ 1,700,000
1,400,000
kWh
Bushel old
= kWh usage per bushel for an old grain dryer
= 0.075
61
kWh
Bushel new
= kWh usage per bushel for an new grain dryer
= 0.035
62
SUMMER COINCIDENT PEAK DEMAND SAVINGS
This technology does not provide peak demand savings; grain drying operations do not run during peak summer
months.
NATURAL GAS ENERGY SAVINGS
N/A
PEAK GAS SAVINGS
N/A
WATER IMPACT DESCRIPTIONS AND CALCULATION
N/A
DEEMED O&M COST ADJUSTMENT CALCULATION
N/A
MEASURE CODE: NR-AGE-GNDR-V02-200101
SUNSET DATE: 1/1/2025
60
Alliant Energy Custom Rebate project data from 2012-2014
61
Alliant Energy Custom Rebate project data from 2012-2014
62
Alliant Energy Custom Rebate project data from 2012-2014
Filed with the Iowa Utilities Board on September 23, 2020, EEP-2018-0002

Iowa Energy Efficiency Statewide Technical Reference Manual—3.1.11 Live Stock Waterer
Vol.3 Nonresidential Measures July 22, 2020 FINAL Page 34 of 410
3.1.11. Live Stock Waterer
DESCRIPTION
Automatic waterers consist of an insulated base and a heated bowl that automatically fills with water from a
pressurized line. A float-operated valve controls the level of the water in the bowl. A thermostat regulates the water
temperature in the bowl.
This measure applies to the replacement of electric open waterers with equivalent herd size watering capacity of
the old unit.
This measure was developed to be applicable to the following program types: TOS.
DEFINITION OF EFFICIENT EQUIPMENT
In order for this characterization to apply, the efficient equipment is an electrically heated thermally insulated
waterer with minimum 2 inches of insulation. A thermostat is required on units with heating elements greater than
or equal to 250 watts.
DEFINITION OF BASELINE EQUIPMENT
In order for this characterization to apply, the baseline equipment is assumed to be an electric open waterer with
sinking or floating water heaters that have reached the end of useful life.
DEEMED LIFETIME OF EFFICIENT EQUIPMENT
The expected measure life is assumed to be 10 years.
63
DEEMED MEASURE COST
Actual costs may be used if associated baseline costs can also be estimated for the application. If actual costs are
unknown, assume an incremental capital cost of $787.50.
64
LOADSHAPE
Loadshape C04 - Nonresidential Electric Heating
Algorithm
CALCULATION OF ENERGY SAVINGS
ELECTRIC ENERGY SAVINGS
Where:
kWh/Waterer = 1104
65
N
Units
= Number of waterers installed per farm
63
Act on Energy Commercial Technical Reference Manual No. 2010-4. Typical warranty on waterers is 10 years.
64
Act on Energy Commercial Technical Reference Manual No. 2010-4.
65
Alliant's Global Energy Partners impact calculations in DSM Tracking, 2006 and is in agreement with IPL 2014 EEP filing
Filed with the Iowa Utilities Board on September 23, 2020, EEP-2018-0002

Iowa Energy Efficiency Statewide Technical Reference Manual—3.1.11 Live Stock Waterer
Vol.3 Nonresidential Measures July 22, 2020 FINAL Page 35 of 410
SUMMER COINCIDENT PEAK DEMAND SAVINGS
No summer coincident peak demand savings for heating measures
NATURAL GAS ENERGY SAVINGS
N/A
PEAK GAS SAVINGS
N/A
WATER IMPACT DESCRIPTIONS AND CALCULATION
N/A
DEEMED O&M COST ADJUSTMENT CALCULATION
N/A
MEASURE CODE: NR-AGE-LSWT-V02-180101
SUNSET DATE: 1/1/2024
Filed with the Iowa Utilities Board on September 23, 2020, EEP-2018-0002

Iowa Energy Efficiency Statewide Technical Reference Manual—3.1.12 Low Pressure Irrigation
Vol.3 Nonresidential Measures July 22, 2020 FINAL Page 36 of 410
3.1.12. Low Pressure Irrigation
DESCRIPTION
This measure characterizes the energy savings from the replacement of an existing irrigation system with a more
energy-efficient system. Low pressure nozzles are used to decrease the necessary pump pressure.
DEFINITION OF EFFICIENT EQUIPMENT
The criteria for this measure is a new irrigation system that reduces the pump pressure of an existing system by at
least 50%.
DEFINITION OF BASELINE EQUIPMENT
The baseline for this measure is the existing irrigation system.
DEEMED LIFETIME OF EFFICIENT EQUIPMENT
The expected measure life is 5 years.
66
DEEMED MEASURE COST
As a retrofit measure, the actual installation and equipment costs are used.
Loadshape NRE11 – Nonresidential Agriculture
Algorithm
CALCULATION OF ENERGY SAVINGS
ELECTRIC ENERGY SAVINGS
Where:
Hours = hours irrigation system runs per season
= 864 hr/yr
67
Pressure = reduction in pump pressure resulting from retrofit
= Actual (PSI)
Acres = Actual
Flow per Acre = 5 gallons/minute/acre
68
66
2014 Database for Energy-Efficiency Resources (DEER), Version 2014.2.04, “Effective/Remaining Useful Life Values”,
California Public Utilities Commission, February 4, 2014
(http://www.deeresources.com/files/DEER2013codeUpdate/download/DEER2014-EUL-table-update_2014-02-05.xlsx)
67
KEMA, Appendix F Program Evaluations Group 1 Vol 2; page 353
68
KEMA, Appendix F Program Evaluations Group 1 Vol 2; page 353.
Filed with the Iowa Utilities Board on September 23, 2020, EEP-2018-0002

Iowa Energy Efficiency Statewide Technical Reference Manual—3.1.12 Low Pressure Irrigation
Vol.3 Nonresidential Measures July 22, 2020 FINAL Page 37 of 410
1715 = Conversion factor from PSI x GPM ((lb x gallons) / (sq. in x min)) to horsepower
Pump
eff
= Actual, if unknown use 0.70
69
SUMMER COINCIDENT PEAK DEMAND SAVINGS
FLH = Full Load Hours
= 6768
70
CF
= Summer System Peak Coincidence Factor 79.3%
71
NATURAL GAS ENERGY SAVINGS
N/A
PEAK GAS SAVINGS
N/A
WATER IMPACT DESCRIPTIONS AND CALCULATION
N/A
DEEMED O&M COST ADJUSTMENT CALCULATION
N/A
MEASURE CODE: NR-AGE-LIRR-V02-200101
SUNSET DATE: 1/1/2021*
* This measure is overdue for a reliability review due to no utility currently offering the measure. If a utility plans to
start using this measure again, it should be reviewed accordingly.
69
Appendix F Program Evaluations Group 1 Vol 2; page 354
70
Cadmus Loadshape analysis IA_Loadshapes_ WORKING DRAFT.xls
71
IA_Electric_Loadshapes.xls
Filed with the Iowa Utilities Board on September 23, 2020, EEP-2018-0002

Iowa Energy Efficiency Statewide Technical Reference Manual—3.1.13 Variable Speed Frequency Drive for Dairy
Vacuum Pump and Milking Machine
Vol.3 Nonresidential Measures July 22, 2020 FINAL Page 38 of 410
3.1.13. Variable Speed Frequency Drive for Dairy Vacuum Pump and Milking Machine
DESCRIPTION
This measure characterizes the energy savings from the installation of VFDs on dairy vacuum pumps or
replacement of existing constant speed dairy vacuum pumps with dairy vacuum pumps with variable speed
capabilities.
This measure applies to the following markets: RF.
DEFINITION OF EFFICIENT EQUIPMENT
The criterion for this measure is the installation of a VFD on the milking vacuum pump. This measure applies only
for blower-style pumps (not rotary-vane vacuum pumps).
DEFINITION OF BASELINE EQUIPMENT
The baseline is an existing pump without a VFD.
DEEMED LIFETIME OF EFFICIENT EQUIPMENT
The expected measure life for a VFD is 15 years.
72
DEEMED MEASURE COST
Actual material and labor costs should be used.
LOADSHAPE
Loadshape NRE11 – Non-Residential Agriculture
Algorithm
CALCULATION OF SAVINGS
ELECTRIC ENERGY SAVINGS
kWh = 16 * N
Milking
* N
Cows
Where:
16 = Annual energy savings per cow per milking from VSD dairy vacuum pump
(kWh/cow/milking)
= 16
73
N
Milking
= Number of milkings per cow per day
= Actual, if unknown use 2
74
72
2014 Database for Energy-Efficiency Resources (DEER), Version 2014.2.04, “Effective/Remaining Useful Life Values”,
California Public Utilities Commission, February 4, 2014
(http://www.deeresources.com/files/DEER2013codeUpdate/download/DEER2014-EUL-table-update_2014-02-05.xlsx
73
Alliant's Global Energy Partners impact calculations in DSM Tracking, 2006, and in agreement with IPL Energy Efficiency
Programs 2009 Evaluation, KEMA, Appendix F Program Evaluations Group 1, Vol 2.
74
Regional Technical Forum (RTF) as part of the Northwest Power & Conservation Council, Deemed Measures List; Agricultural:
Variable Frequency Drives-Dairy, FY2012, v1.2. Pre- and post-power meter data for five sites were used to establish RTF energy
Filed with the Iowa Utilities Board on September 23, 2020, EEP-2018-0002

Iowa Energy Efficiency Statewide Technical Reference Manual—3.1.13 Variable Speed Frequency Drive for Dairy
Vacuum Pump and Milking Machine
Vol.3 Nonresidential Measures July 22, 2020 FINAL Page 39 of 410
N
Cows
= Number of milking cows per farm
= Actual, if unknown use 140
75
SUMMER COINCIDENT PEAK DEMAND SAVINGS
Where:
FLH = Full Load Hours
= 2,703
76
CF = coincidence factor
= 0.793
77
NATURAL GAS ENERGY SAVINGS
N/A
PEAK GAS SAVINGS
N/A
WATER IMPACT DESCRIPTIONS AND CALCULATION
N/A
DEEMED O&M COST ADJUSTMENT CALCULATION
N/A
MEASURE CODE: NR-AGE-VDVP-V03-210101
SUNSET DATE: 1/1/2023
savings and the raw data used to generate load profiles showed, on average, two milkings per day. For further detail on the
corroboration of this source, please see the 2016 Pennsylvania TRM.
75
Entered from application form; default value is sourced from the 2017 U.S. Census of Agriculture, Iowa State Summary
Highlights, Full Report, Volume 1, Chapter 2, U.S. State Level, 397. Average number of cows per farm = 223,579 cows / 1,592
farms = 140
76
The full load hours are based on an average number of milkings per day of 2, and assumptions on the average hours per
milking of 3.7 hours, with milking occurring 365.25 days a year.. Source Milking System Air Consumption When Using a Variable
Speed Vacuum Pump. Paper Number: 033014 An ASAE Meeting Presentation. July 2003
77
Cadmus Loadshape analysis IA_Loadshapes.xls
Filed with the Iowa Utilities Board on September 23, 2020, EEP-2018-0002
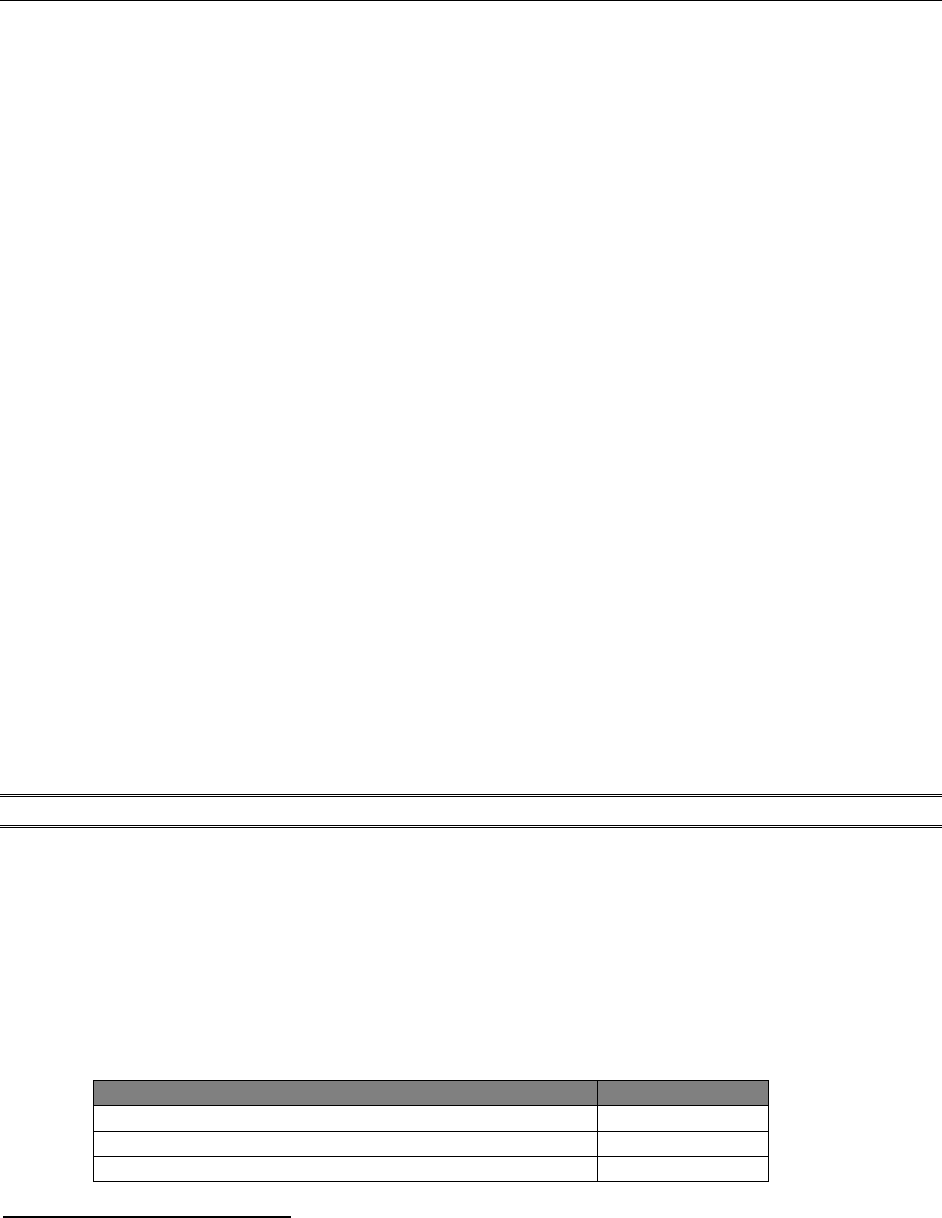
Iowa Energy Efficiency Statewide Technical Reference Manual—3.1.14 Dairy Plate Cooler
Vol.3 Nonresidential Measures July 22, 2020 FINAL Page 40 of 410
3.1.14. Dairy Plate Cooler
DESCRIPTION
This measure characterizes the energy savings from the installation of plate-style milk precoolers on dairy parlor
milk refrigeration systems. A plate cooler uses incoming well water to pre cool the milk before it enters the bulk
tank reducing the cooling load on the compressors.
DEFINITION OF EFFICIENT EQUIPMENT
The criterion for this measure is the installation of a plate-style milk precooler in a dairy parlor; no additional
efficiency qualifications.
DEFINITION OF BASELINE EQUIPMENT
The baseline is dairy parlor milk refrigeration systems, without existing plate-style milk precooler.
DEEMED LIFETIME OF EFFICIENT EQUIPMENT
The expected measure life of a plate cooler is 15 years.
78
DEEMED MEASURE COST
Actual material and labor costs should be used.
If the actual installed cost is unknown, the default equipment cost of a plate cooler is $2,950 with an installation cost
of $494, for a total incremental installed cost of $3,444.
79
LOADSHAPE
Loadshape NRE11 – Non-Residential Agriculture
Algorithm
CALCULATION OF SAVINGS
ELECTRIC ENERGY SAVINGS
ΔkWh = kWh/Cow * NCows
Where:
kWh/Cow = Per cow annual energy savings from plate-style milk precooler in
kWh/cow/yr.
80
Equipment Type
kWh/cow/year
Installed alone
76.2
Heat reclaimer installed with electric hot water heater
62.0
Scroll compressor installed
52.9
78
2014 Database for Energy-Efficiency Resources (DEER), Version 2014.2.04, “Effective/Remaining Useful Life Values”,
California Public Utilities Commission, February 4, 2014
79
The equipment and labor costs are sourced from the PG&E Workpaper – Milk Pre Cooler (PGE3PAGR114), February 2013.
80
IPL Energy Efficiency Programs 2009 Evaluation, KEMA, Appendix F Program Evaluations Group 1, Vol 2, page 352.
Filed with the Iowa Utilities Board on September 23, 2020, EEP-2018-0002

Iowa Energy Efficiency Statewide Technical Reference Manual—3.1.14 Dairy Plate Cooler
Vol.3 Nonresidential Measures July 22, 2020 FINAL Page 41 of 410
Equipment Type
kWh/cow/year
Both heat reclaimer (with electric hot water heater) and
scroll compressor installed
65.0
Default if type not know
81
66.5
NCows = Number of milking cows per farm
= Actual, if unknown use 140
82
Savings Analysis:
Where:
Days = Number of milking days per year
= 365 days
83
= Specific heat of milk
84
= 0.93 Btu/(lb-°F)
Lbs of Milk = The pounds of milk produced per day per cow that needs to be cooled
= 51.6 lbs of milk per cow per day
85
= Temperature reduction of the milk across precooler
= 40°F
86
Btuh of Heat Recovery = Difference in Btu/h per cow per year recovered by heat reclaimer system with
and without precooler
= 0 Btu/h per cow per year if non-electric water heater
= 131,562 Btu/h per cow per year if electric water heater and a heat reclaimer
are present on-site
87
1000 = Conversion factor from watts to kilowatts
88
EER = Energy Efficiency Ratio; efficiency of the existing compressor on the milk
81
Default type if unknown is a weighted average assuming market penetration of 40% installed alone, 20% heat reclaimer
installed, 20% scroll compressor installed and 20% heat reclaimer and scroll compressor installed. Source: Proportion based on
IPL 2014 EEP assumptions the average of the four installation types.
82
Entered from application form; default value is sourced from the 2017 U.S. Census of Agriculture, Iowa State Summary
Highlights, Full Report, Volume 1, Chapter 2, U.S. State Level, 397. Average number of cows per farm = 223,579 cows / 1,592
farms = 140
83
IPL Energy Efficiency Programs 2009 Evaluation, KEMA, Appendix F Program Evaluations Group 1, Vol 2, page 351.
84
IPL Energy Efficiency Programs 2009 Evaluation, KEMA, Appendix F Program Evaluations Group 1, Vol 2, page 352.
85
The pounds of milk produced per cow per day is based on an average cow producing 6 gallons of milk per day, with each
gallon of milk weighting approximately 8.6 pounds (6 gallons of milk per cow per day x 8.6 lbs = 51.6 lbs of milk per cow per
day). The milk production and density values are sourced from; IPL Energy Efficiency Programs 2009 Evaluation, KEMA,
Appendix F Program Evaluations Group 1, Vol 2, page 349 and 351.
86
IPL Energy Efficiency Programs 2009 Evaluation, KEMA, Appendix F Program Evaluations Group 1, Vol 2, page 351.
87
This factor acts as a negative interactive effect on the hot water heater only if a heat reclaimer is installed or in effect on site.
This value is sourced from the ‘Heat Reclaimer’ measure and represents the difference in reclaimable heat between the hot
water needs for the dairy farm and the waste heat available if a plate cooler is installed.
88
IPL Energy Efficiency Programs 2009 Evaluation, KEMA, Appendix F Program Evaluations Group 1, Vol 2, page 351.
Filed with the Iowa Utilities Board on September 23, 2020, EEP-2018-0002

Iowa Energy Efficiency Statewide Technical Reference Manual—3.1.14 Dairy Plate Cooler
Vol.3 Nonresidential Measures July 22, 2020 FINAL Page 42 of 410
refrigeration system
= if installed with reciprocating compressor, use EER of 8.4
89
= if installed with unknown compressor type, use EER of 9.3
90
= if installed with scroll compressor, use EER of 10.9
91
SUMMER COINCIDENT PEAK DEMAND SAVINGS
Where:
FLH =Full load hours. The refrigeration is assumed to be in operation every day of the year, but because
of compressor cycling the full load hours are based on the run time of compressors for medium
temperature refrigeration applications.
92
= 3,910
CF = Coincidence factor
= 0.79
93
NATURAL GAS ENERGY SAVINGS
N/A
PEAK GAS SAVINGS
N/A
WATER IMPACT DESCRIPTIONS AND CALCULATION
N/A
DEEMED O&M COST ADJUSTMENT CALCULATION
N/A
MEASURE CODE: NR-AGE-DYPC- V05-210101
SUNSET DATE: 1/1/2026
89
Average efficiency of a reciprocating compressor, as sourced from Wisconsin Focus on Energy TRM – Plate Heat Exchanger
and Well Water Pre-Cooler, 2017
90
Typical milk precooler refrigeration systems are medium temperature and use a 2HP equivalent compressor. The baseline
EER of 9.3 is from the Scroll Refrigerant Compressor measure baseline for 2HP compressor.
91
Typical milk precooler refrigeration systems are medium temperature and use a 2HP equivalent compressor. The scroll
compressor EER of 10.9 is from the Scroll Refrigerant Compressor measure efficient option for 2HP compressor.
92
Based on run time estimates from “Performance Standards for Walk-In Refrigerator and Freezer Systems,” AHRTI Report No.
09002-01, by Bryan R. Becker, et al., January 2012, Tables 30-33
93
Cadmus Loadshape analysis IA_Loadshapes_ WORKING DRAFT.xls
Filed with the Iowa Utilities Board on September 23, 2020, EEP-2018-0002

Iowa Energy Efficiency Statewide Technical Reference Manual—3.1.15 LED Grow Lights
Vol.3 Nonresidential Measures July 22, 2020 FINAL Page 43 of 410
3.1.15. LED Grow Lights
DESCRIPTION
This measure is for the installation of LED grow lights for commercial agricultural purposes in interior or conditioned
spaces. The assumption is the installed LEDs will be used for horticultural applications.
LEDs are a fast-emerging option for cultivating plants, and represent a significant efficiency increase over traditional
high intensity discharge (HID) or linear fluorescent grow lights. Different from LEDs designed for visual applications
and illuminating spaces for the human eye, grow lights efficacy are measured by their photosynthetic photon flux
density (PPFD), instead of lumens. LEDs also offer interactive cooling savings due to the reduction in waste heat from
an HID fixture, which typically requires an additional cooling source to maintain design cultivation temperatures and
plant health.
This measure was developed to be applicable to the following program types: TOS, RF, NC.
If applied to other program types, the measure savings should be verified.
DEFINITION OF EFFICIENT EQUIPMENT
The efficient equipment is an LED grow light meeting the following criteria:
• Third-party tested and UL listed
• Power factor (PF) ≥ 0.90
• Photosynthetic photon efficacy (PPE) of no less than 1.9 micromoles per joule
• Minimum rated lifetime of 50,000 hours and a minimum warranty of 5 years
• LED fixture must be on the Design Lights Consortium qualifying products list
94
DEFINITION OF BASELINE EQUIPMENT
The baseline equipment is the industry established grow light based on the horticultural application, as detailed in
the table below. HID fixtures are assumed for flowering and vegetative crops. T5 high-output fixtures are assumed
for seedling and microgreen crops.
94
Design Light Consortium – Horticultural Lighting, Testing and Reporting Requirements of LED-Based Horticultural Lighting,
version 1.2, effective October 21, 2019
Filed with the Iowa Utilities Board on September 23, 2020, EEP-2018-0002
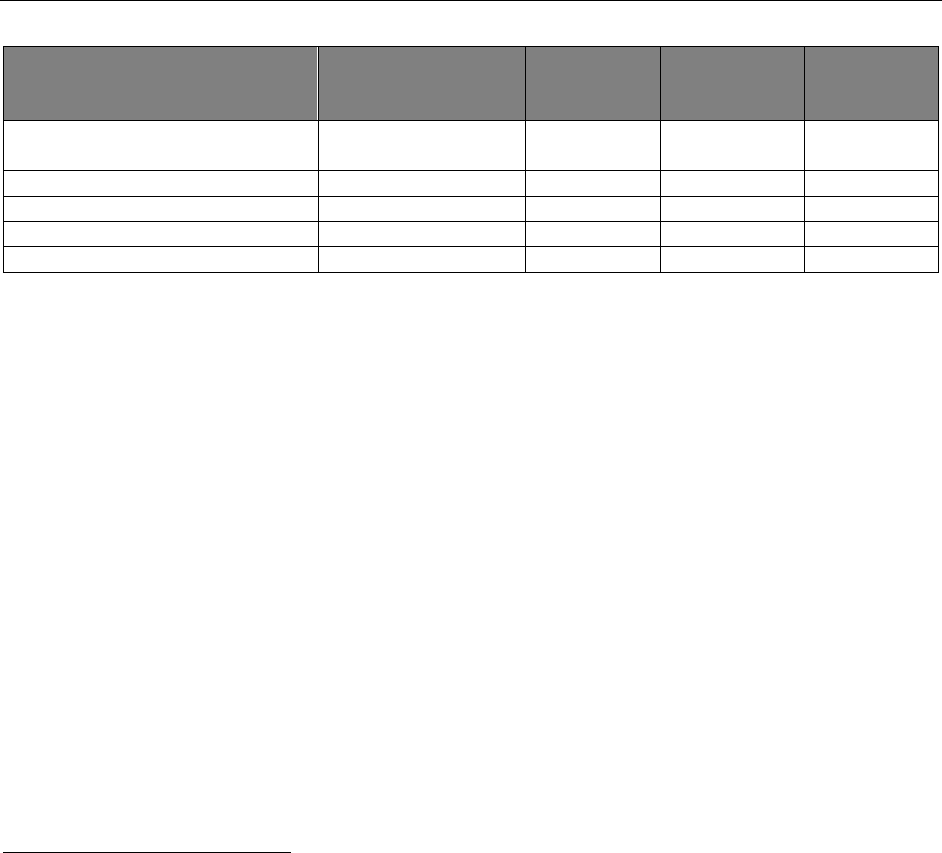
Iowa Energy Efficiency Statewide Technical Reference Manual—3.1.15 LED Grow Lights
Vol.3 Nonresidential Measures July 22, 2020 FINAL Page 44 of 410
Crop Type
Baseline Technology
Type
Baseline PPE
(μmol/J)
95
Baseline
Watts per
Square Foot
96
Baseline
Fixture
Wattage
97
Flowering Crops (Tomatoes and
Peppers)
High Pressure Sodium
1.7
68.8
1,100 W
Vegetative Growth
Metal Halide
1.25
98
40
640 W
Microgreens
99
T5 HO Fixture
0.84
100
22.5
360 W
Propagation
101
T5 HO Fixture
0.84
102
15
240 W
Cannabis – Flowering Stage
High Pressure Sodium
1.7
68.8
1,100 W
DEEMED LIFETIME OF EFFICIENT EQUIPMENT
The expected measure life is 9.5 years.
103
DEEMED MEASURE COST
For retrofit replacement scenarios, use actual installation costs. For time of sale installations, use the following
incremental cost:
Incremental cost
104
= ($1.42 * Watts
LED
) - $65
Where:
$1.42 = LED fixture wattage to incremental cost conversion factor
$65 = LED fixture wattage to incremental cost offset
Watts
LED
= LED fixture wattage
LOADSHAPE
Loadshape NRE11 - Nonresidential Agricultural
95
Erik Runkle and Bruce Bugbee “Plant Lighting Efficiency and Efficacy: μmols per joule”. Accessed 4/21/2020.
96
Jesse Remillard and Nick Collins, “Trends and Observations of Energy Use in the Cannabis Industry,” ACEEE, accessed April 17,
2020. Baseline watts per square foot were taken by using typical fixture technology by crop type and dividing by 16 sqft per
fixture (a 4’x4’ area is a typical coverage amount for one grow light fixture).
97
Jesse Remillard and Nick Collins, “Trends and Observations of Energy Use in the Cannabis Industry,” ACEEE, accessed April 17,
2020. Baseline watts per square foot were taken by using typical fixture technology by crop type and dividing by 16 sqft per
fixture (a 4’x4’ area is a typical coverage amount for one grow light fixture).
98
Jacob A. Nelson, Bruce Bugbee, “Economic Analysis of Greenhouse Lighting: Light Emitting Diodes vs. High Intensity
Discharge Fixtures.” Utah State University. Accessed 5/6/2020.
99
Microgreens T5 fixture is based on a 6-lamp high output fixture, based on program experience.
100
Jacob A. Nelson, Bruce Bugbee, “Economic Analysis of Greenhouse Lighting: Light Emitting Diodes vs. High Intensity
Discharge Fixtures.” Utah State University. Accessed 5/6/2020.
101
Propagation T5 fixture is based on a 4-lamp high output fixture, based on program experience.
102
Jacob A. Nelson, Bruce Bugbee, “Economic Analysis of Greenhouse Lighting: Light Emitting Diodes vs. High Intensity
Discharge Fixtures.” Utah State University. Accessed 5/6/2020.
103
The measure life is based on a minimum rated lifetime of 50,000 hours for DLC certified fixtures, divided by the average
annual operating hours of 5,250 hours.
104
The incremental cost is sourced from a linear regression analysis for LED fixture costs sourced from; “Trends and
Observations of Energy Use in Cannabis Industry, ACEEE, 2017”. The LED equipment cost was supplemented by market research
on baseline costs, the analysis of which can be seen: “IA TRM_LED Grow Lights_Cost_Apr 2020.xlsx”
Filed with the Iowa Utilities Board on September 23, 2020, EEP-2018-0002

Iowa Energy Efficiency Statewide Technical Reference Manual—3.1.15 LED Grow Lights
Vol.3 Nonresidential Measures July 22, 2020 FINAL Page 45 of 410
Algorithm
CALCULATION OF ENERGY SAVINGS
ELECTRIC ENERGY SAVINGS
Where:
∆kWh = gross customer annual kWh savings
Area = Illuminated grow area, in square feet, of active and growing space canopy
= Use actual if known. If unknown, default is 16 square feet per fixture
105
Hours = Annual hours of operation
= Use actual if known. If unknown, default by crop type:
Crop Types
Annual Hours
106
Flowering Crops
4,200
Vegetative/Propagation Crops
6,300
Microgreens
6,300
Cannabis – Flowering Stage
4,200
Other
3,650
Average
5,250
1000 = Conversion from watts to kilowatts (W / kW)
WHF
e
= Waste heat factor for energy to account for cooling energy savings from efficient
lighting. Value is based on the Nonresidential Average building type as selected from the
Lighting Reference Table in Section 3.4, and detailed in the table below.
HVAC Cooling Type
WHF
e
Cooling
1.06
No Cooling
1.00
Watts
Base
= Baseline wattage per square foot of coverage/canopy area. See typical baseline
wattages by crop type in baseline equipment definition.
Watts
EE
= Efficient wattage per square foot of coverage/canopy area
= Actual. If crop type is unknown, default value is 36 watts per square foot
107
105
Default illuminated area is based on an average canopy grow area of 4 ft. x 4 ft.
106
Sole-Source Lighting of Plants. Technically Speaking by Erik Runkle. Michigan State University Extension. September 2017.
Accessed: 7/29/2019. Annual hours of operation were found by multiplying hours per day by 350 operating days per year.
Assuming 5 crop cycles with 3 days of downtime between each cycle
107
“Cannabis Energy Guidance”, Massachusetts Department of Energy Resources, February 2019
Filed with the Iowa Utilities Board on September 23, 2020, EEP-2018-0002

Iowa Energy Efficiency Statewide Technical Reference Manual—3.1.15 LED Grow Lights
Vol.3 Nonresidential Measures July 22, 2020 FINAL Page 46 of 410
HEATING PENALTY
If electrically heated building:
Where:
IFkWh = Lighting-HVAC Interaction Factor for electric heating impacts; this factor represents the
increased electric space heating requirements due to the reduction of waste heat rejected
by the efficient lighting. Value is based on the Non-Residential Average building type as
selected from the Lighting Reference Table in Section 3.4, and detailed in the table below.
HVAC Heating Type
IFkWh
Gas Heating
0.00
Electric Resistance Heating
0.24
Electric Heat Pump Heating
0.10
SUMMER COINCIDENT PEAK DEMAND SAVINGS
Where:
CF = 1.00
WHF
d
= Waste Heat Factor for Demand to account for cooling savings from efficient lighting in
cooled buildings. Value is based on the Non-Residential Average building type as selected
from the Lighting Reference Table in Section 3.4, and detailed in the table below.
HVAC Cooling Type
WHF
d
Cooling
1.28
No Cooling
1.00
NATURAL GAS SAVINGS
Where:
∆Therms = gross customer annual therms savings
IFTherms = Lighting-HVAC Integration Factor for gas heating impacts; this factor represents the
increased gas space heating requirements due to the reduction of waste heat rejected by
the efficient lighting. Value is based on the Non-Residential Average building type as
selected from the Lighting Reference Table in Section 3.4, and detailed in the table below.
HVAC Heating Type
IFTherms
Gas Heating
0.01
Other Heating Type
0.00
PEAK GAS SAVINGS
Filed with the Iowa Utilities Board on September 23, 2020, EEP-2018-0002

Iowa Energy Efficiency Statewide Technical Reference Manual—3.1.15 LED Grow Lights
Vol.3 Nonresidential Measures July 22, 2020 FINAL Page 47 of 410
Where:
ΔTherms = Therm impact calculated above
HeatDays = Heat season days per year
= 197
108
WATER IMPACT DESCRIPTIONS AND CALCULATION
N/A
DEEMED O&M COST ADJUSTMENT CALCULATION
Any costs associated with moving the LED lighting fixture to different heights throughout the different growing
phases should also be included as an O&M consideration. See table below for default replacement assumptions:
109
EE Measure
Baseline
LED
Category
EE Measure Description
Lamp
Life
(hrs)
Total
Lamp
Replace
Cost
LED
Driver
Life
(hrs)
Total
LED
Driver
Replace
Cost
Lamp
Life
(hrs)
Total
Lamp
Replace
Cost
Ballast
Life
(hrs)
Total
Ballast
Replace
Cost
LED Grow
Lights
Replacement of 150W High Pressure
Sodium
50,00
0
$207.65
70,00
0
$40.00
24,000
$29.00
40,000
$47.00
Replacement of 250W High Pressure
Sodium
50,00
0
$331.07
70,00
0
$40.00
24,000
$29.00
40,000
$47.00
Replacement of 400W High Pressure
Sodium
50,00
0
$533.64
70,00
0
$62.50
24,000
$31.00
40,000
$205.00
Replacement of 600W High Pressure
Sodium
50,00
0
$875.42
70,00
0
$62.50
24,000
$47.00
40,000
$229.00
Replacement of 1,000W High Pressure
Sodium
50,00
0
$1,557.5
8
70,00
0
$62.50
24,000
$80.00
40,000
$255.00
Replacement of 2 lamp-4 foot T5HO
linear fluorescent lamp
50,00
0
$207.65
70,00
0
$40.00
30,000
$26.33
40,000
$60.00
Replacement of 3 lamp-4 foot T5HO
linear fluorescent lamp
50,00
0
$207.65
70,00
0
$40.00
30,000
$39.50
40,000
$60.00
Replacement of 4 lamp-4 foot T5HO
linear fluorescent lamp
50,00
0
$331.07
70,00
0
$40.00
30,000
$52.67
40,000
$75.00
MEASURE CODE: NR-AGE-GROW-V01-210101
SUNSET DATE: 1/1/2024
108
Number of days where HDD 55 >0.
109
The baseline for this measure is assumed to be an HPS lamp or T5HO linear fluorescent lamp, depending on application, and
are the established grow light for horticultural applications. The efficient equipment and the subsequent replacement costs are
an equivalent LED grow light that is considered a suitable replacement based on industry research and manufacturer
specifications.
Filed with the Iowa Utilities Board on September 23, 2020, EEP-2018-0002

Iowa Energy Efficiency Statewide Technical Reference Manual—3.1.16 Grain Bin Fan Aeration Controls
Vol.3 Nonresidential Measures July 22, 2020 FINAL Page 48 of 410
3.1.16. Grain Bin Fan Aeration Controls
DESCRIPTION
A large portion of the corn produced every year has to be dried and stored in order to preserve for use in the future.
When wet grain comes in from the field, it goes through a grain dryer to remove moisture and to prepare the grain
for storage. Without the removal of moisture, stored grain can spoil or become moldy. For example, corn is typically
stored with a moisture content of 15% or below. During the drying process, the corn is heated up and often goes
into storage at temperatures at or above outdoor air temperatures.
Grain storage bins come in a variety of shapes and sizes. Some have capacities of a few thousand bushels and some
have capacities of hundreds of thousands of bushels. When grain is stored in these large bins, the grain on the outer
edges acts as an insulator for the grain in the middle. Because of this, as the outdoor air temperature drops, the
grain, and surrounding air on the outside of the bin, cools down while the interior grain and air stays warm. As the
warm air rises and the cool air sinks, convection currents of moving air transfer moisture to pockets within the grain.
These pockets of moisture cause the grain to start rotting, which leads to spoilage, insect infestations, or other
issues.
To prevent these moisture issues, grain storage bins are equipped with aeration fans that force air through the grain
to keep the temperature gradients minimal and prevent convection currents from forming. Depending on the size
(and especially height) of the bin, the fans often have significant horsepower to meet the CFM and static pressure
requirements. Larger bins can easily require fan systems with four to six, 40-60hp fans, or larger.
Most grain bin aeration systems are manually controlled and there is quite a bit of guesswork involved with when
to run the fans and for how long. The operation can be based on random grain samples, weather, or the operator's
general judgement. Most of the time, this leads to erring on the side of caution and running the fans more than
necessary. With the large fan motor horsepower involved, this leads to a lot of wasted energy.
Grain bin aeration fan controls use integrated moisture and temperature sensors embedded in the grain bin along
with weather data to sense where and when issues may be occurring within the grain, and when the best times to
dry the grain are. This removes a lot of the guesswork from the aeration fan system operation and results in a
significant reduction in the hours of operation.
Savings are achieved by replacing existing manual controls on grain storage bin aeration fans with controls that use
temperature and moisture sensors to modulate fan operation automatically. Electric savings are achieved in retrofit
projects by reducing the aeration fan run hours. With manual controls, the fans are run more frequently and for
longer than needed. The controls include moisture and temperature sensors which run the fans only when needed.
Grain bins using heating grain drying are not eligible for participation in this measure. The reported height of the
grain bin must be the eave height and not the height of the peak. Bins larger than 105 ft. in diameter or 100 ft. in
eave height must go through the custom program.
This measure was developed to be applicable to the following program types: RF, TOS, NC.
If applied to other program types, the measure savings should be verified.
DEFINITION OF EFFICIENT EQUIPMENT
The efficient condition is grain bin aeration fans with automatic controls based on integrated temperature and/or
moisture sensors.
Filed with the Iowa Utilities Board on September 23, 2020, EEP-2018-0002

Iowa Energy Efficiency Statewide Technical Reference Manual—3.1.16 Grain Bin Fan Aeration Controls
Vol.3 Nonresidential Measures July 22, 2020 FINAL Page 49 of 410
DEFINITION OF BASELINE EQUIPMENT
The baseline condition is grain bin aeration fans with manual controls.
DEEMED LIFETIME OF EFFICIENT EQUIPMENT
The expected measure life is 7 years.
110
DEEMED MEASURE COST
The actual installation cost should be used for screening and reporting purposes.
LOADSHAPE
Loadshape NRE11 – Non-Residential Agriculture
Algorithm
CALCULATION OF ENERGY SAVINGS
ELECTRIC ENERGY SAVINGS
Table: Default Annual kWh Savings Based on Bin Size
Bin Diameter (ft)
Bin Eave Height
(ft)
24
36
42
48
54
60
72
75
78
90
105
20
215
430
430
430
430
860
860
860
1,290
1,290
2,150
30
430
430
860
860
1,290
1,720
2,150
2,150
2,580
3,440
4,730
35
430
860
1,290
1,290
1,720
2,150
3,440
3,440
3,870
5,160
7,310
40
430
1,290
1,720
2,150
3,010
3,440
5,160
5,590
6,020
7,740
10,750
45
860
1,720
2,580
3,440
4,300
5,160
7,310
8,170
8,600
11,610
15,910
50
1,290
2,580
3,440
4,730
6,020
7,310
10,320
11,180
12,470
16,340
22,360
55
1,720
3,440
4,730
6,450
8,170
9,890
14,190
15,480
16,770
22,360
30,530
60
2,150
4,730
6,450
8,600
10,750
13,330
19,350
20,640
22,360
30,100
40,850
65
2,580
6,450
8,600
11,180
14,190
17,200
24,940
27,090
29,240
39,130
53,320
70
3,440
8,170
10,750
14,190
18,060
22,360
32,250
34,830
37,840
50,310
68,370
75
4,300
9,890
13,760
18,060
22,790
27,950
40,420
43,860
47,300
63,210
86,000
80
5,590
12,470
17,200
22,360
27,950
34,830
49,880
54,180
58,910
78,260
106,210
85
6,880
15,480
20,640
27,090
34,400
42,570
61,060
66,220
71,810
95,460
29,860
90
8,170
18,490
24,940
32,680
41,710
51,170
73,960
79,980
86,860
115,240
156,950
95
9,890
21,930
30,100
39,130
49,450
61,060
88,150
95,890
103,630
138,030
187,480
100
11,610
26,230
35,690
46,440
58,910
72,670
104,490
113,090
122,550
162,970
221,880
110
The expected measure life is based on bin dryer and their associated components (fans and heaters, stirring devices,
continuous unloaders, etc.) as sourced from Purdue Extension, “Dryeration and Bin Cooling Systems for Grain”.
Filed with the Iowa Utilities Board on September 23, 2020, EEP-2018-0002

Iowa Energy Efficiency Statewide Technical Reference Manual—3.1.16 Grain Bin Fan Aeration Controls
Vol.3 Nonresidential Measures July 22, 2020 FINAL Page 50 of 410
Where:
∆kWh = gross customer annual kWh savings
Where:
kWh Savings per Hp = The kWh savings per brake horsepower for grain bin aeration fans
= Default value is 430 kWh/hp
0.746 = Conversion factor from hp to kW
Hours
Manual
= Annual hours of operation for grain storage bin aeration fans with manual controls
= 720 hours
111
Hours
Control
= Annual hours of operation for grain storage bin aeration fans with controls
= 180 hours
112
Eff
Motor
= Efficiency of the fan motor
= 93.6%
113
Where:
Fan
BHP
= Fan brake horsepower (including motor loading) required to provide the necessary
aeration to grain bin
= See table below for Fan BHP by Bin Size for default values
6356 = Conversion factor from CFM-(in. wg) to horsepower
Eff
Fan
= Efficiency of the fan
= 60%
114
Exhaust Fan Factor = Percentage of the aeration fan horsepower that can be attributed to the bin exhaust
fans, which are also controlled in the system
= 5%
115
Static Pressure = The design static pressure of the stored grain required to be overcome by the aeration
111
The default manual control hours are sourced from Alliant Energy Custom Rebate Project Data from 2013-2015
112
The default hours of operation of the fans with controls is sourced from Alliant Energy Custom Rebate Project Data from
2013-2015, leveraging Integris fan control runtime models.
113
Motor efficiency is based on a NEMA Premium Efficient, 60 hp, ODP, 3600 RPM motor. This is a typical fan motor for larger
bin sizes, as supported by Alliant Energy Custom Rebate Project Data from 2013-2015.
114
Typical rule of thumb for fans with high static pressure.
115
The fan exhaust factor is sourced from Alliant Energy Custom Rebate Project Data from 2013-2015
Filed with the Iowa Utilities Board on September 23, 2020, EEP-2018-0002

Iowa Energy Efficiency Statewide Technical Reference Manual—3.1.16 Grain Bin Fan Aeration Controls
Vol.3 Nonresidential Measures July 22, 2020 FINAL Page 51 of 410
fan. Value as determined from the following polynomial where x is the bin eave height in
feet, assuming the default value for CFM per Bushel of 0.17.
116
= ax
2
+ bx + c
a = 0.002142472
b = -0.0679226
c = 1.212104147
Table: Default Static Pressure
Static Pressure (in.wg)
Grain Depth (ft)
0.17 CFM per Bushel
20
0.71
30
1.10
40
1.92
50
3.17
60
4.85
70
6.96
80
9.49
90
12.45
100
15.84
Where:
Design CFM = The total CFM required per bushel for effective aeration
CFM per Bushel = CFM required per bushel for effective aeration
= 0.17 CFM per bushel
117
Bushel Capacity = The total storage capacity of the grain storage bin, in bushels
= See table below for Bushel Capacity default values
116
Kansas State University Research and Extension, “Aeration of Grain”, April 2012
117
Typical vendor design information, as supported by Alliant Energy Custom Rebate Project Data from 2013-2015.
Filed with the Iowa Utilities Board on September 23, 2020, EEP-2018-0002

Iowa Energy Efficiency Statewide Technical Reference Manual—3.1.16 Grain Bin Fan Aeration Controls
Vol.3 Nonresidential Measures July 22, 2020 FINAL Page 52 of 410
Table: Bushel Capacity
Bin Diameter (ft)
Bin Eave
Height (ft)
24
36
42
48
54
60
72
75
78
90
105
20
7,274
16,367
22,278
29,098
36,827
45,465
65,470
71,039
76,836
102,297
139,237
30
10,912
24,551
33,417
43,647
55,240
68,198
98,205
106,559
115,254
153,445
208,855
35
12,730
28,643
38,986
50,921
64,447
79,564
114,572
124,319
134,463
179,019
243,665
40
14,549
32,735
44,556
58,195
73,654
90,930
130,940
142,079
153,672
204,593
278,474
45
16,367
36,827
50,125
65,470
82,860
102,297
147,307
159,838
172,881
230,167
313,283
50
18,186
40,919
55,695
72,744
92,067
113,663
163,674
177,598
192,090
255,741
348,092
55
20,005
45,010
61,264
80,019
101,274
125,029
180,042
195,358
211,299
281,315
382,902
60
21,823
49,102
66,834
87,293
110,480
136,395
196,409
213,118
230,508
306,890
417,711
65
23,642
53,194
72,403
94,567
119,687
147,762
212,777
230,878
249,717
332,464
452,520
70
25,460
57,286
77,973
101,842
128,894
159,128
229,144
248,637
268,926
358,038
487,329
75
27,279
61,378
83,542
109,116
138,100
170,494
245,512
266,397
288,135
383,612
522,139
80
29,098
65,470
89,112
116,391
147,307
181,861
261,879
284,157
307,344
409,186
556,948
85
30,916
69,562
94,681
123,665
156,514
193,227
278,247
301,917
326,553
434,760
591,757
90
32,735
73,654
100,251
130,940
165,720
204,593
294,614
319,677
345,762
460,334
626,566
95
34,553
77,745
105,820
138,214
174,927
215,959
310,981
337,437
364,971
485,909
661,376
100
36,372
81,837
111,390
145,488
184,134
227,326
327,349
355,196
384,180
511,483
696,185
Diameter = Diameter of the storage bin, in feet
Eave Height = Height of the storage bin walls before the roof begins, not to be confused with peak
height, which is the top of the roof
Bushels per ft
3
= Bushels per cubic foot (for storage)
= If unknown, default is 0.804 Bu/ft
3
Table: Fan BHP Based on Bin Size
Bin Diameter (ft)
Bin Eave Height (ft)
24
36
42
48
54
60
72
75
78
90
105
20
0.5
1
1
1
1
2
2
2
3
3
5
30
1
1
2
2
3
4
5
5
6
8
11
35
1
2
3
3
4
5
8
8
9
12
17
40
1
3
4
5
7
8
12
13
14
18
25
45
2
4
6
8
10
12
17
19
20
27
37
50
3
6
8
11
14
17
24
26
29
38
52
55
4
8
11
15
19
23
33
36
39
52
71
60
5
11
15
20
25
31
45
48
52
70
95
65
6
15
20
26
33
40
58
63
68
91
124
70
8
19
25
33
42
52
75
81
88
117
159
75
10
23
32
42
53
65
94
102
110
147
200
80
13
29
40
52
65
81
116
126
137
182
247
85
16
36
48
63
80
99
142
154
167
222
302
90
19
43
58
76
97
119
172
186
202
268
365
95
23
51
70
91
115
142
205
223
241
321
436
100
27
61
83
108
137
169
243
263
285
379
516
Filed with the Iowa Utilities Board on September 23, 2020, EEP-2018-0002
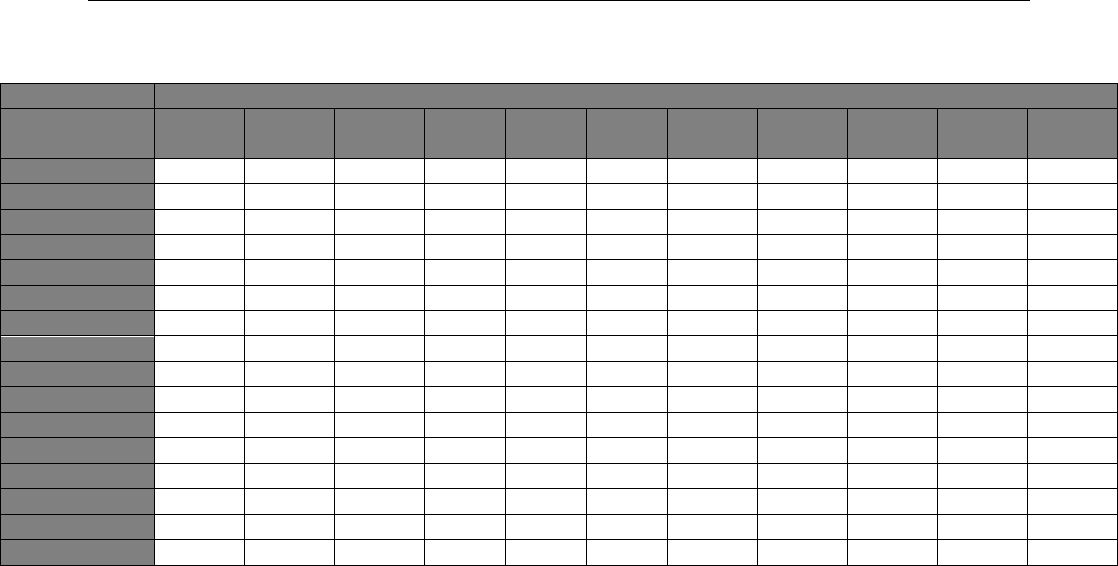
Iowa Energy Efficiency Statewide Technical Reference Manual—3.1.16 Grain Bin Fan Aeration Controls
Vol.3 Nonresidential Measures July 22, 2020 FINAL Page 53 of 410
Table: Design CFM
Bin Diameter (ft)
Bin Eave Height
(ft)
24
36
42
48
54
60
72
75
78
90
105
20
1,237
2,782
3,787
4,947
6,261
7,729
11,130
12,077
13,062
17,390
23,670
30
1,855
4,174
5,681
7,420
9,391
11,594
16,695
18,115
19,593
26,086
35,505
35
2,164
4,869
6,628
8,657
10,956
13,526
19,477
21,134
22,859
30,433
41,423
40
2,473
5,565
7,574
9,893
12,521
15,458
22,260
24,153
26,124
34,781
47,341
45
2,782
6,261
8,521
11,130
14,086
17,390
25,042
27,173
29,390
39,128
53,258
50
3,092
6,956
9,468
12,367
15,651
19,323
27,825
30,192
32,655
43,476
59,176
55
3,401
7,652
10,415
13,603
17,217
21,255
30,607
33,211
35,921
47,824
65,093
60
3,710
8,347
11,362
14,840
18,782
23,187
33,390
36,230
39,186
52,171
71,011
65
4,019
9,043
12,309
16,076
20,347
25,119
36,172
39,249
42,452
56,519
76,928
70
4,328
9,739
13,255
17,313
21,912
27,052
38,955
42,268
45,717
60,866
82,846
75
4,637
10,434
14,202
18,550
23,477
28,984
41,737
45,288
48,983
65,214
88,764
80
4,947
11,130
15,149
19,786
25,042
30,916
44,519
48,307
52,249
69,562
94,681
85
5,256
11,825
16,096
21,023
26,607
32,849
47,302
51,326
55,514
73,909
100,599
90
5,565
12,521
17,043
22,260
28,172
34,781
50,084
54,345
58,780
78,257
106,516
95
5,874
13,217
17,989
23,496
29,738
36,713
52,867
57,364
62,045
82,604
112,434
100
6,183
13,912
18,936
24,733
31,303
38,645
55,649
60,383
65,311
86,952
118,351
SUMMER COINCIDENT PEAK DEMAND SAVINGS
There are no coincident peak demand savings associated with this measure.
NATURAL GAS SAVINGS
N/A
WATER IMPACT DESCRIPTIONS AND CALCULATION
N/A
DEEMED O&M COST ADJUSTMENT CALCULATION
N/A
MEASURE CODE: NR-AGE-GRAIN-V01-210101
SUNSET DATE: 1/1/2026
Filed with the Iowa Utilities Board on September 23, 2020, EEP-2018-0002

Iowa Energy Efficiency Statewide Technical Reference Manual—3.2.1 Low Flow Faucet Aerators
Vol.3 Nonresidential Measures July 22, 2020 FINAL Page 54 of 410
3.2. Hot Water
3.2.1. Low Flow Faucet Aerators
DESCRIPTION
This measure relates to the direct installation of a low flow faucet aerator in a commercial building. Expected
applications include small business, office, restaurant, motel, and hotel. For multifamily or senior housing, the
residential low flow faucet aerator characterization should be used.
This measure was developed to be applicable to the following program types, DI.
If applied to other program types, the measure savings should be verified.
DEFINITION OF EFFICIENT EQUIPMENT
To qualify for this measure, the installed equipment must be an energy efficient faucet aerator, rated at 1.5 gallons
per minute (GPM)
118
or less. Savings are calculated on an average savings per faucet fixture basis.
DEFINITION OF BASELINE EQUIPMENT
The baseline condition is assumed to be a standard faucet aerator rated at 2.2 GPM
119
or greater. Note: if flow rates
are measured, for example through a Direct Install program, then actual baseline flow rates should be used rather
than the deemed values.
DEEMED LIFETIME OF EFFICIENT EQUIPMENT
The expected measure life is assumed to be 9 years.
120
DEEMED MEASURE COST
The incremental installed cost for this measure is $16,
121
or program actual cost.
LOADSHAPE
Loadshape NREW01:16 - Nonresidential Electric Hot Water (by Building Type)
Loadshape NRGW01:16 – Nonresidential Gas Hot Water (by Building Type)
Algorithm
CALCULATION OF SAVINGS
ELECTRIC ENERGY SAVINGS
Note these savings are per faucet retrofitted.
122
118
IPL program product data for 2014 Iowa Residential Energy Assessments.
119
DOE Energy Cost Calculator for Faucets and Showerheads:
(http://www1.eere.energy.gov/femp/technologies/eep_faucets_showerheads_calc.html#output)
120
Table C-6, Measure Life Report, Residential and Commercial/Industrial Lighting and HVAC Measures, GDS Associates, June
2007. "http://neep.org/Assets/uploads/files/emv/emv-library/measure_life_GDS%5B1%5D.pdf"
121
Direct-install price per faucet assumes cost of aerator and install time. (2011, Market research average of $3 and assess and
install time of $13 (20min @ $40/hr)).
122
This algorithm calculates the amount of energy saved per aerator by determining the fraction of water consumption savings
Filed with the Iowa Utilities Board on September 23, 2020, EEP-2018-0002

Iowa Energy Efficiency Statewide Technical Reference Manual—3.2.1 Low Flow Faucet Aerators
Vol.3 Nonresidential Measures July 22, 2020 FINAL Page 55 of 410
Where:
%ElectricDHW = proportion of water heating supplied by electric resistance heating
DHW fuel
%Electric_DHW
Electric
100%
Fossil Fuel
0%
Unknown
53%
123
GPM_base = Average flow rate, in gallons per minute, of the baseline faucet “as-used”
= Measured full throttle flow * 0.83 throttling factor
124
If flow not measured, assume (2.2 * 0.83) = 1.83 GPM
GPM_low = Average flow rate, in gallons per minute, of the low-flow faucet aerator “as-used”
= Rated full throttle flow * 0.95 throttling factor
125
If flow not available, assume (1.5 * 0.95) = 1.43 GPM
Usage = Estimated usage of mixed water (mixture of hot water from water heater line and cold
water line) per faucet (gallons per year)
= If data is available to provide a reasonable custom estimate, it should be used - if not,
use the following defaults (or substitute custom information in to the calculation):
Building Type
Gallons hot
water per unit
per day
126
(A)
Unit
Estimated % total
building hot water
use from Faucets
127
(B)
Multiplier
128
(C)
Unit
Days per
year
(D)
Annual
gallons
mixed
water per
faucet
(A*B*C*D)
Small Office
1
person
100%
10
employees per faucet
250
2,500
Large Office
1
person
100%
45
employees per faucet
250
11,250
Fast Food Rest
0.7
meal/day
50%
75
meals per faucet
365.25
9.588
for the upgraded fixture. Due to the distribution of water consumption by fixture type, as well as the different number of
fixtures in a building, several variables must be incorporated.
123
Default assumption for unknown fuel is based on EIA Commercial Building Energy Consumption Survey (CBECS) 2012 for
Midwest North Central Region, see ‘CBECS_B32 Water heating energy sources, floorspace, 2012.xls’. If utilities have specific
evaluation results providing a more appropriate assumption for buildings in a particular market or geographical area, then they
should be used.
124
2008, Schultdt, Marc, and Debra Tachibana. Energy related Water Fixture Measurements: Securing the Baseline for
Northwest Single Family Homes. 2008 ACEEE Summer Study on Energy Efficiency in Buildings. Page 1-265.
www.seattle.gov/light/Conserve/Reports/paper_10.pdf
125
2008, Schultdt, Marc, and Debra Tachibana. Energy related Water Fixture Measurements: Securing the Baseline for
Northwest Single Family Homes. 2008 ACEEE Summer Study on Energy Efficiency in Buildings. Page 1-265.
www.seattle.gov/light/Conserve/Reports/paper_10.pdf
126
Table 2-45 Chapter 49, Service Water Heating, 2007 ASHRAE Handbook, HVAC Applications.
127
Estimated based on data provided in Appendix E; “Waste Not, Want Not: The Potential for Urban Water Conservation in
California”; http://www.pacinst.org/reports/urban_usage/appendix_e.pdf
128
Based on review of the plumbing code (Employees and students per faucet). Retail, grocery, warehouse, and health are
estimates. Meals per faucet estimated as 4 bathroom and 3 kitchen faucets and average meals per day of 250 (based on
California study above) – 250/7 = 36. Fast food assumption estimated.
Filed with the Iowa Utilities Board on September 23, 2020, EEP-2018-0002

Iowa Energy Efficiency Statewide Technical Reference Manual—3.2.1 Low Flow Faucet Aerators
Vol.3 Nonresidential Measures July 22, 2020 FINAL Page 56 of 410
Building Type
Gallons hot
water per unit
per day
126
(A)
Unit
Estimated % total
building hot water
use from Faucets
127
(B)
Multiplier
128
(C)
Unit
Days per
year
(D)
Annual
gallons
mixed
water per
faucet
(A*B*C*D)
Sit-Down Rest
2.4
meal/day
50%
36
meals per faucet
365.25
15,779
Retail
2
employee
100%
5
employees per faucet
365.25
3,653
Grocery
2
employee
100%
5
employees per faucet
365.25
3,653
Warehouse
2
employee
100%
5
employees per faucet
250
2,500
Elementary
School
0.6
person
50%
50
students per faucet
200
3,000
Jr High/High
School
1.8
person
50%
50
students per faucet
200
9,000
Health
90
patient
25%
2
Patients per faucet
365.25
16,436
Motel
20
room
25%
1
faucet per room
365.25
1,826
Hotel
14
room
25%
1
faucet per room
365.25
1,278
Other
1
employee
100%
20
employees per faucet
250
5,000
EPG_electric = Energy per gallon of mixed water used by faucet (electric water heater)
= (γWater * 1.0 * (WaterTemp - SupplyTemp)) / (RE_electric * 3412)
= 0.0822 kWh/gal if resistance tank (or unknown)
129
= 0.0403 kWh/gal if heat pump water heater
Where:
γWater = Specific weight of water (lbs/gallon)
= 8.33 lbs/gallon
1.0 = Heat Capacity of water (Btu/lb-°F)
WaterTemp = Assumed temperature of mixed water
= 86F for Bath, 93F for Kitchen
SupplyTemp = Assumed temperature of water entering building
= 56.5
130
RE_electric = Recovery efficiency of electric water heater
= 98% for electric resistance (or unknown)
131
= 200% for heat pump water heaters
132
129
Assumes 50:50 kitchen and bathroom usage.
130
Averaged monthly water main temperature calculated using the methodology provided in Building America Research
Benchmark Definition, updated December 2009. Pg.19-20. http://www.nrel.gov/docs/fy10osti/47246.pdf; water main
temperature represents the average of TMY3 data from all Class I stations located in Des Moines, IA.
131
Electric water heaters have recovery efficiency of 98%: https://www.ahridirectory.org/Search/SearchHome
132
200% represents a reasonable estimate of the weighted average event recovery efficiency for heat pump water heaters,
including those that are set to Heat Pump only mode (and so have a recovery efficiency >250%) and those that are set in hybrid
mode where a larger draw would kick the unit in to resistance mode (98%), or where low total water consumption can result in
lower COPs due to relatively high standby losses. Note that the AHRI directory provides recovery efficiency ratings, some of which
Filed with the Iowa Utilities Board on September 23, 2020, EEP-2018-0002

Iowa Energy Efficiency Statewide Technical Reference Manual—3.2.1 Low Flow Faucet Aerators
Vol.3 Nonresidential Measures July 22, 2020 FINAL Page 57 of 410
3412 = Converts Btu to kWh (Btu/kWh)
ISR = In service rate of faucet aerators
=Assumed to be 1.0
Based on defaults provided above:
133
Building Type
∆kWh
Resistance
Tank
Heat Pump
Tank
Unknown
DHW
Small Office
44.9
22.0
23.8
Large Office
202.2
99.1
107.1
Fast Food Rest
172.3
84.4
91.3
Sit-Down Rest
283.5
138.8
150.3
Retail
65.6
32.1
34.8
Grocery
65.6
32.1
34.8
Warehouse
44.9
22.0
23.8
Elementary School
53.9
26.4
28.6
Jr High/High School
161.7
79.2
85.7
Health
295.3
144.6
156.5
Motel
32.8
16.1
17.4
Hotel
23.0
11.2
12.2
Other
89.8
44.0
47.6
SUMMER COINCIDENT PEAK DEMAND SAVINGS
Where:
ΔkWh = calculated value above on a per faucet basis
Hours = Annual electric DHW recovery hours for faucet use
= (Usage * 0.479
134
)/GPH
Where:
GPH = Gallons per hour recovery of electric water heater calculated for 70F temp rise
(126.5-56.5), 98% for resistance (or unknown) and 200% for heat pump water
tanks recovery efficiency, and typical 12kW electric resistance storage tank.
135
= 68.8 if resistance tank, 140.4 if heat pump
= Calculate if usage is custom, if using default usage use:
Building Type
Annual Recovery Hours
Resistance Tank
Heat Pump Tank
Small Office
17.4
8.5
Large Office
78.3
38.4
Fast Food Rest
66.7
32.7
are >250% but most are rated at 100%. This is due to the rating test involving a large hot water draw, consistent with multiple
showers.
133
See “Commercial Faucet Aerator Calculations_06122019.xlsx” for details.
134
47.9% is the proportion of hot 126.5F water mixed with 56.5F supply water to give 90°F mixed faucet water.
135
See “Calculation of GPH Recovery_06122019.xlsx” for more information.
Filed with the Iowa Utilities Board on September 23, 2020, EEP-2018-0002

Iowa Energy Efficiency Statewide Technical Reference Manual—3.2.1 Low Flow Faucet Aerators
Vol.3 Nonresidential Measures July 22, 2020 FINAL Page 58 of 410
Building Type
Annual Recovery Hours
Resistance Tank
Heat Pump Tank
Sit-Down Rest
109.8
53.8
Retail
25.4
12.5
Grocery
25.4
12.5
Warehouse
17.4
8.5
Elementary School
20.9
10.2
Jr High/High School
62.7
30.7
Health
114.4
56.0
Motel
12.7
6.2
Hotel
8.9
4.4
Other
34.8
17.1
CF = Coincidence Factor for electric load reduction
= Dependent on building type
136
Building Type
Coincidence Factor
Resistance Tank
Heat Pump Tank
Small Office
0.0045
0.0016
Large Office
0.0238
0.0083
Fast Food Rest
0.0114
0.0040
Sit-Down Rest
0.0250
0.0088
Retail
0.0058
0.0020
Grocery
0.0058
0.0020
Warehouse
0.0060
0.0021
Elementary School
0.0054
0.0019
Jr High/High School
0.0161
0.0056
Health
0.0196
0.0069
Motel
0.0009
0.0003
Hotel
0.0006
0.0002
Other
0.0119
0.0042
Based on defaults provided above:
137
Building Type
∆kW
Resistance Tank
Heat Pump Tank
Unknown DHW
Small Office
0.0115
0.0057
0.0061
Large Office
0.0615
0.0302
0.0326
Fast Food Rest
0.0295
0.0144
0.0156
Sit-Down Rest
0.0647
0.0317
0.0343
Retail
0.0150
0.0073
0.0079
Grocery
0.0150
0.0073
0.0079
Warehouse
0.0154
0.0075
0.0082
Elementary School
0.0138
0.0068
0.0073
136
Calculated as follows: Assumptions for percentage of usage during peak period (2-6pm) were made and then multiplied by
65/365 (65 being the number of days in peak period) and by the number of total annual recovery hours to give an estimate of
the number of hours of recovery during peak periods. There are 260 hours in the peak period, so the probability there will be
savings during the peak period is calculated as the number of hours of recovery during peak divided by 260. See ‘Commercial
Faucet Aerator Calculations_06122019.xlsx’ for details.
137
See “Commercial Faucet Aerator Calculations_06122019.xlsx” for details.
Filed with the Iowa Utilities Board on September 23, 2020, EEP-2018-0002

Iowa Energy Efficiency Statewide Technical Reference Manual—3.2.1 Low Flow Faucet Aerators
Vol.3 Nonresidential Measures July 22, 2020 FINAL Page 59 of 410
Building Type
∆kW
Resistance Tank
Heat Pump Tank
Unknown DHW
Jr High/High School
0.0415
0.0204
0.0220
Health
0.0505
0.0248
0.0268
Motel
0.0022
0.0011
0.0012
Hotel
0.0016
0.0008
0.0008
Other
0.0308
0.0151
0.0163
NATURAL GAS SAVINGS
Where:
%FossilDHW = proportion of water heating supplied by fossil fuel heating
DHW fuel
%Fossil_DHW
Electric
0%
Fossil Fuel
100%
Unknown
47%
138
EPG_gas = Energy per gallon of mixed water used by faucet (gas water heater)
= (8.33 * 1.0 * (WaterTemp
139
- SupplyTemp)) / (RE_gas * 100,000)
= 0.0035 Therm/gal for buildings with storage tank, 0.0047 Therm/gal if hot water
through central boiler or 0.0040 Therm/gal if unknown
Where:
RE_gas = Recovery efficiency of gas water heater
= 69%
140
= 78% for buildings with storage tank, 59% if hot water through
central boiler, or 69% if unknown
141
100,000 = Converts Btus to Therms (Btu/Therm)
Other variables as defined above.
Based on defaults provided above:
142
138
Default assumption for unknown fuel is based on EIA Commercial Building Energy Consumption Survey (CBECS) 2012 for
Midwest North Central Region, see ‘CBECS_B32 Water heating energy sources, floorspace, 2012.xls’. If utilities have specific
evaluation results providing a more appropriate assumption for buildings in a particular market or geographical area, then they
should be used.
139
Assumes 50:50 kitchen and bathroom usage.
140
Commercial properties are often provided by a larger commercial boiler. This suggests that the average recovery efficiency
is somewhere between a typical central boiler efficiency of .59 and the .78 for single family home. An average is used for this
analysis by default.
141
Water heating in multifamily buildings is often provided by a larger central boiler. An average efficiency of 0.69 is used for
this analysis as a default for multifamily buildings where water heating system is unknown.
142
See “Commercial Faucet Aerator Calculations_06122019.xlsx” for details.
Filed with the Iowa Utilities Board on September 23, 2020, EEP-2018-0002

Iowa Energy Efficiency Statewide Technical Reference Manual—3.2.1 Low Flow Faucet Aerators
Vol.3 Nonresidential Measures July 22, 2020 FINAL Page 60 of 410
Building Type
∆Therms
Buildings
with Storage
tank
Buildings
with Central
Boiler DHW
Unknown
Gas DHW
Unknown
DHW
Small Office
1.9
2.5
2.2
1.0
Large Office
8.7
11.5
9.8
4.6
Fast Food Rest
7.4
9.8
8.3
3.9
Sit-Down Rest
12.2
16.1
13.7
6.5
Retail
2.8
3.7
3.2
1.5
Grocery
2.8
3.7
3.2
1.5
Warehouse
1.9
2.5
2.2
1.0
Elementary School
2.3
3.1
2.6
1.2
Jr High/High School
6.9
9.2
7.8
3.7
Health
12.7
16.7
14.3
6.7
Motel
1.4
1.9
1.6
0.7
Hotel
1.0
1.3
1.1
0.5
Other
3.9
5.1
4.4
2.0
PEAK GAS SAVINGS
Savings for this measure are assumed to be evenly spread across the year. The Peak Gas Savings is therefore assumed
to be:
Where:
ΔTherms = Therm impact calculated above
365.25 = Days per year
Based on defaults provided above:
143
Building Type
∆PeakTherms
Buildings with
Storage tank
Buildings with
Central Boiler
DHW
Unknown
Gas DHW
Unknown
DHW
Small Office
0.0053
0.0070
0.0060
0.0028
Large Office
0.0237
0.0314
0.0268
0.0126
Fast Food Rest
0.0202
0.0267
0.0228
0.0107
Sit-Down Rest
0.0333
0.0440
0.0376
0.0177
Retail
0.0077
0.0102
0.0087
0.0041
Grocery
0.0077
0.0102
0.0087
0.0041
Warehouse
0.0053
0.0070
0.0060
0.0028
Elementary School
0.0063
0.0084
0.0072
0.0034
Jr High/High School
0.0190
0.0251
0.0215
0.0101
Health
0.0346
0.0458
0.0392
0.0184
Motel
0.0038
0.0051
0.0044
0.0020
Hotel
0.0027
0.0036
0.0030
0.0014
Other
0.0105
0.0139
0.0119
0.0056
143
See “Commercial Faucet Aerator Calculations_06122019.xlsx” for details.
Filed with the Iowa Utilities Board on September 23, 2020, EEP-2018-0002

Iowa Energy Efficiency Statewide Technical Reference Manual—3.2.1 Low Flow Faucet Aerators
Vol.3 Nonresidential Measures July 22, 2020 FINAL Page 61 of 410
WATER IMPACT DESCRIPTIONS AND CALCULATION
Variables as defined above
Based on defaults provided above:
144
Building Type
∆Gallons
Small Office
546
Large Office
2459
Fast Food Rest
2094
Sit-Down Rest
3447
Retail
798
Grocery
798
Warehouse
546
Elementary School
656
Jr High/High School
1967
Health
3590
Motel
399
Hotel
279
Other
1093
DEEMED O&M COST ADJUSTMENT CALCULATION
N/A
MEASURE CODE: NR-HWE-LFFA-V03-200101
SUNSET DATE: 1/1/2022
144
See “Commercial Faucet Aerator Calculations_06122019.xlsx” for details.
Filed with the Iowa Utilities Board on September 23, 2020, EEP-2018-0002

Iowa Energy Efficiency Statewide Technical Reference Manual—3.2.2 Low Flow Showerheads
Vol.3 Nonresidential Measures July 22, 2020 FINAL Page 62 of 410
3.2.2. Low Flow Showerheads
DESCRIPTION
This measure relates to the direct installation of a low flow showerhead in a commercial building. Expected
applications include small business, office, motel, and hotel. For multifamily or senior housing, the residential low
flow showerhead should be used.
This measure was developed to be applicable to the following program types: DI.
If applied to other program types, the measure savings should be verified.
DEFINITION OF EFFICIENT EQUIPMENT
To qualify for this measure the installed equipment must be an energy efficient showerhead rated at 1.5 gallons per
minute (GPM) or less. Savings are calculated on a per showerhead fixture basis.
DEFINITION OF BASELINE EQUIPMENT
The baseline condition is assumed to be a standard showerhead rated at 2.5 GPM.
DEEMED LIFETIME OF EFFICIENT EQUIPMENT
The expected measure life is assumed to be 10 years.
145
DEEMED MEASURE COST
The incremental installed cost for this measure is $20
146
or program actual.
LOADSHAPE
Loadshape NREW01:16 - Nonresidential Electric Hot Water (by Building Type)
Loadshape NRGW01:16 – Nonresidential Gas Hot Water (by Building Type)
Algorithm
CALCULATION OF SAVINGS
ELECTRIC ENERGY SAVINGS
Note these savings are per showerhead fixture:
Where:
%ElectricDHW = proportion of water heating supplied by electric resistance heating
DHW fuel
%ElectricDHW
Electric
100%
145
Table C-6, Measure Life Report, Residential and Commercial/Industrial Lighting and HVAC Measures, GDS Associates, June
2007. Evaluations indicate that consumer dissatisfaction may lead to reductions in persistence, particularly in Multifamily
buildings.
146
Direct-install price per showerhead assumes cost of showerhead (Market research average of $7 and assess and install time
of $13 (20min @ $40/hr).
Filed with the Iowa Utilities Board on September 23, 2020, EEP-2018-0002

Iowa Energy Efficiency Statewide Technical Reference Manual—3.2.2 Low Flow Showerheads
Vol.3 Nonresidential Measures July 22, 2020 FINAL Page 63 of 410
DHW fuel
%ElectricDHW
Natural Gas
0%
Unknown
53%
147
GPM_base = Flow rate of the baseline showerhead
= Actual measured flow rate - If not measured, assume 2.5 GPM
148
GPM_low = Flow rate of the low-flow showerhead
= Actual measured flow rate - If not measured, assume 1.5 GPM
(L * SPD * Days) = Minutes of use per showerhead annually. Ideally, this should be calculated using the
following inputs (if unknown defaults are provided below:
L = Shower length in minutes with showerhead
= 7.8 min
149
SPD = Showers Per Day for showerhead
= Input estimate (if unknown see table below)
Days = Days used per year, on average
= Actual (if unknown see table below)
If it is not possible to provide a reasonable custom estimate for annual showerhead minutes, the following
defaults can be used:
150
Building Type
Annual Minutes per
Showerhead
(L * SPD * Days)
Hospitality
3,509
Health
2,528
Commercial – Employee
Shower
1,894
Education
2,057
Other Commercial Except
Fitness Center
3,029
Fitness Center
56,893
EPG_electric = Energy per gallon of hot water supplied by electric
= (γWater * 1.0 * (ShowerTemp - SupplyTemp)) / (RE_electric * 3412)
147
Default assumption for unknown fuel is based on EIA Commercial Building Energy Consumption Survey (CBECS) 2012 for
Midwest North Central Region, see ‘CBECS_B32 Water heating energy sources, floorspace, 2012.xls’. If utilities have specific
evaluation results providing a more appropriate assumption for buildings in a particular market or geographical area, then they
should be used.
148
The Energy Policy Act of 1992 (EPAct) established the maximum flow rate for showerheads at 2.5 gallons per minute (gpm).
149
Assumed consistent with Residential assumption; Cadmus and Opinion Dynamics Showerhead and Faucet Aerator Meter
Study Memorandum dated June 2013, directed to Michigan Evaluation Working Group. This study of 135 single and multifamily
homes in Michigan metered energy parameters for efficient showerhead and faucet aerators.
150
Default values are based upon a Northwest Power and Conservation Council Regional Technical Forum workbook, see
“ComDHWShowerhead_v3_0.xls”. Estimates are derived based on a combination of evaluation assumptions, surveys and
professional judgment.
Filed with the Iowa Utilities Board on September 23, 2020, EEP-2018-0002

Iowa Energy Efficiency Statewide Technical Reference Manual—3.2.2 Low Flow Showerheads
Vol.3 Nonresidential Measures July 22, 2020 FINAL Page 64 of 410
= 0.1109 kWh/gal for resistance (or unknown) unit, 0.0543 kWh/gal for heat pump water
heaters
Where:
γWater = Specific weight of water (lbs/gallon)
= 8.33 lbs/gallon
1.0 = Heat Capacity of water (Btu/lb-°)
ShowerTemp = Assumed temperature of water
= 101F
151
SupplyTemp = Assumed temperature of water entering house
= 56.5
152
RE_electric = Average Recovery efficiency of electric water heater
= 98% for electric resistance (or unknown)
153
= 200% for heat pump water heaters
154
3412 = Converts Btu to kWh (Btu/kWh)
ISR = In service rate of showerhead
= 1.0
SUMMER COINCIDENT PEAK DEMAND SAVINGS
Where:
ΔkWh = calculated value above
Hours = Annual electric DHW recovery hours for showerhead use
151
Cadmus and Opinion Dynamics Showerhead and Faucet Aerator Meter Study Memorandum dated June 2013, directed to
Michigan Evaluation Working Group.
152
Averaged monthly water main temperature calculated using the methodology provided in Building America Research
Benchmark Definition, updated December 2009. Pg.19-20. http://www.nrel.gov/docs/fy10osti/47246.pdf; water main
temperature represents the average of TMY3 data from all Class I stations located in Des Moines, IA.
153
Electric water heaters have recovery efficiency of 98%: https://www.ahridirectory.org/Search/SearchHome
154
200% represents a reasonable estimate of the weighted average event recovery efficiency for heat pump water heaters,
including those that are set to Heat Pump only mode (and so have a recovery efficiency >250%) and those that are set in hybrid
mode where a larger draw would kick the unit in to resistance mode (98%), or where low total water consumption can result in
lower COPs due to relatively high standby losses. Note that the AHRI directory provides recovery efficiency ratings, some of which
are >250% but most are rated at 100%. This is due to the rating test involving a large hot water draw, consistent with multiple
showers.
For example, for a direct-installed 1.5 GPM showerhead in an office open every day with electric DHW where
the number of showers is estimated at 3 per day:
ΔkWh = 1 * ((2.5 - 1.5) * 7.8 * 3 * 365.25) * 0.111 * 1.0
= 948.7 kWh
Filed with the Iowa Utilities Board on September 23, 2020, EEP-2018-0002

Iowa Energy Efficiency Statewide Technical Reference Manual—3.2.2 Low Flow Showerheads
Vol.3 Nonresidential Measures July 22, 2020 FINAL Page 65 of 410
= (GPM_base * L * SPD * 365.25 * 0.65
155
)/ GPH
Where:
GPH = Gallons per hour recovery of electric water heater calculated for 70F temp rise (126.5-
56.5), 98% recovery efficiency for electric resistance (or unknown) and 200% for heat
pump water heaters, and typical 12kW electric resistance storage tank.
156
= 68.8 if resistance tank, 140.4 if heat pump
CF = Coincidence Factor for electric load reduction
= 1.6%
157
NATURAL GAS SAVINGS
Where:
%FossilDHW = proportion of water heating supplied by fossil fuel heating
DHW fuel
%Fossil_DHW
Electric
0%
Fossil Fuel
100%
Unknown
47%
158
EPG_gas = Energy per gallon of Hot water supplied by gas
= (8.33 * 1.0 * (ShowerTemp - SupplyTemp)) / (RE_gas * 100,000)
= 0.0048 Therm/gal for buildings with storage tank, 0.0063 Therm/gal if hot water
through central boiler or 0.0054 Therm/gal if unknown
Where:
RE_gas = Recovery efficiency of gas water heater
= 78% for buildings with storage tank, 59% if hot water through
155
65.0% is the proportion of hot 125F water mixed with 56.5F supply water to give 101F shower water.
156
See “Calculation of GPH Recovery_06122019.xlsx” for more information.
157
Assume consistent with residential assumption. Calculated as follows: Assume 11% showers take place during peak hours
(based on: Deoreo, B., and P. Mayer. “The End Uses of Hot Water in Single Family Homes from Flow Trace Analysis”, 2001).
There are 65 days in the summer peak period, so the percentage of total annual aerator use in peak period is 0.11*65/365 =
1.96%. The number of hours of recovery during peak periods is therefore assumed to be 1.96% * 216 = 4.23 hours of recovery
during peak period, where 216 equals the average annual electric DHW recovery hours for showerhead use in SF homes with
Direct Install and Retrofit/TOS measures. There are 260 hours in the peak period so the probability you will see savings during
the peak period is 4.23/260 = 0.016.
158
Default assumption for unknown fuel is based on EIA Commercial Building Energy Consumption Survey (CBECS) 2012 for
Midwest North Central Region, see ‘CBECS_B32 Water heating energy sources, floorspace, 2012.xls’. If utilities have specific
evaluation results providing a more appropriate assumption for buildings in a particular market or geographical area, then they
should be used.
For example, for a direct-installed 1.5 GPM showerhead in an office with electric resistance DHW where the
number of showers is estimated at 3 per day:
ΔkW = (948.7 / 202) * 0.016
= 0.075 kW
Filed with the Iowa Utilities Board on September 23, 2020, EEP-2018-0002

Iowa Energy Efficiency Statewide Technical Reference Manual—3.2.2 Low Flow Showerheads
Vol.3 Nonresidential Measures July 22, 2020 FINAL Page 66 of 410
central boiler or 69% if unknown
159
100,000 = Converts Btus to Therms (Btu/Therm)
Other variables as defined above.
PEAK GAS SAVINGS
Savings for this measure are assumed to be evenly spread across the year. The Peak Gas Savings is therefore assumed
to be:
Where:
ΔTherms = Therm impact calculated above
365.25 = Days per year
WATER IMPACT DESCRIPTIONS AND CALCULATION
Variables as defined above
DEEMED O&M COST ADJUSTMENT CALCULATION
N/A
MEASURE CODE: NR-HWE-LFSH-V04-200101
SUNSET DATE: 1/1/2022
159
Water heating in multifamily buildings is often provided by a larger central boiler. An average efficiency of 0.69 is used for
this analysis as a default for multifamily buildings where the water heating system is unknown.
For example, for a direct-installed 1.5 GPM showerhead in an office open every day with gas DHW (unknown
system) where the number of showers is estimated at 3 per day:
ΔTherms = 1.0 * (2.5 – 1.5) * 7.8 * 3 * 365.25 * 0.0054 * 1.0
= 46.2 therms
For example, for a direct-installed 1.5 GPM showerhead in an office open every day with gas DHW where the
number of showers is estimated at 3 per day:
ΔPeakTherms = 46.2 / 365.25
= 0.1265 therms
For example, for a direct-installed 1.5 GPM showerhead in an office open every day with where the number of
showers is estimated at 3 per day:
ΔGallons = (2.5 - 1.5) * 7.8 * 3 * 365.25 * 1.0
= 8,547 gallons
Filed with the Iowa Utilities Board on September 23, 2020, EEP-2018-0002

Iowa Energy Efficiency Statewide Technical Reference Manual—3.2.3 Gas Hot Water Heater
Vol.3 Nonresidential Measures July 22, 2020 FINAL Page 67 of 410
3.2.3. Gas Hot Water Heater
DESCRIPTION
This measure is for upgrading from a minimum code gas water heater to either a high-efficiency storage gas water
heater or a tankless gas water heater.
This measure was developed to be applicable to the following program types: TOS, NC.
If applied to other program types, the measure savings should be verified.
DEFINITION OF EFFICIENT EQUIPMENT
To qualify for this measure, the installed equipment must be a commercial gas-fired storage water heater,
commercial tankless water heater, or Residential-Duty Commercial Water Heater meeting program requirements.
Residential-duty Commercial Water Heaters that meet the following criteria:
• Is not designed to provide outlet hot water at temperatures greater than 180 °F; and
• Gas-fired Storage Water Heater with a rated input no greater than 105 kBtu/h and a DOE Rated Storage
volume no greater than 120 gallons.
DEFINITION OF BASELINE EQUIPMENT
The baseline condition is assumed to be a new standard gas water heater of same type as existing, meeting the
Federal Standard. If existing type is unknown, assume commercial Gas Storage Water Heater. Note the same draw
pattern (very small, low, medium and high draw) should be used for both baseline and efficient units.
Equipment Type
Sub Category
Draw
Pattern
Federal Standard
160
Residential-duty Commercial
High Capacity Storage Gas-Fired
Storage Water Heaters ≤
125,000 Btu/h
≤120 gallon tanks
Very small
UEF = 0.2674 – (0.0009 * Rated Storage Volume in Gallons)
Low
UEF = 0.5362 – (0.0012 * Rated Storage Volume in Gallons)
Medium
UEF = 0.6002 – (0.0011 * Rated Storage Volume in Gallons)
High
UEF = 0.6597 – (0.0009 * Rated Storage Volume in Gallons)
Residential Gas Instantaneous
Water Heaters
≤ 200,000 Btu/h
≤2 gal
Very low
UEF = 0.80
All other
UEF = 0.81
Commercial
Gas Storage Water Heaters
>75,000 Btu/h and ≤155,000
Btu/h
>120 gallon tanks
All
80% E
thermal
Standby Losses = (Q /800 + 110√Rated Storage Volume in
Gallons)
Commercial
Gas Storage Water Heaters
>155,000 Btu/h
All
Commercial Gas Instantaneous
Water Heaters
> 200,000 Btu/h
<10 gal
All
80% E
thermal
≥10 gal
All
80% E
thermal
DEEMED LIFETIME OF EFFICIENT EQUIPMENT
160
Residential-Duty and Commercial Federal Standard are from DOE Standard 10 CFR 431. Residential instantaneous Federal
Standards are from DOE Standard 10 CFR 430.
Filed with the Iowa Utilities Board on September 23, 2020, EEP-2018-0002

Iowa Energy Efficiency Statewide Technical Reference Manual—3.2.3 Gas Hot Water Heater
Vol.3 Nonresidential Measures July 22, 2020 FINAL Page 68 of 410
The expected measure life for gas water heaters is assumed to be 15 years for storage heaters and 20 years for
tankless water heaters.
161
DEEMED MEASURE COST
Actual costs should be used where available and if associated baseline costs can also be estimated for the
application. If actual costs are unknown, full install costs and incremental cost assumptions are provided below:
162
Equipment Type
Category
Install
Cost
Incremental
Cost
Gas Storage Water Heaters
≤ 75,000 Btu/h, ≤55 Gallons
Baseline
$616
N/A
Efficient
$1,055
$440
Gas Storage Water Heaters
> 75,000 Btu/h
0.80 Et
$4,886
N/A
0.83 Et
$5,106
$220
0.84 Et
$5,299
$413
0.85 Et
$5,415
$529
0.86 Et
$5,532
$646
0.87 Et
$5,648
$762
0.88 Et
$5,765
$879
0.89 Et
$5,882
$996
0.90 Et
$6,021
$1,135
Gas Tankless Water Heaters
>50,000 Btu/h and <200,000
Btu/h
Tankless
Baseline
$593
N/A
Efficient
$1,080
$487
Incremental
using Storage
Baseline
$465
Gas Tankless Water Heaters
≥200,000 Btu/h
Tankless
Baseline
$1,148
N/A
Efficient
$1,427
$278
Incremental
using Storage
Baseline
-$3,459
LOADSHAPE
Loadshape NRGW01:16 – Nonresidential Gas Hot Water (by Building Type)
Algorithm
CALCULATION OF SAVINGS
ELECTRIC ENERGY SAVINGS
161
Based on assumptions for high efficiency commercial storage water heaters and instantaneous water heaters in 2014
Database for Energy-Efficiency Resources (DEER), Version 2014.2.04, “Effective/Remaining Useful Life Values”, California Public
Utilities Commission, February 4, 2014 (http://www.deeresources.com/files/DEER2013codeUpdate/download/DEER2014-EUL-
table-update_2014-02-05.xlsx).
162
Cost information is based upon data from “2010-2012 WA017 Ex Ante Measure Cost Study Draft Report”, Itron, February
28, 2014. See “NR HW Heater_WA017_MCS Results Matrix - Volume I.xls” for more information.
Filed with the Iowa Utilities Board on September 23, 2020, EEP-2018-0002

Iowa Energy Efficiency Statewide Technical Reference Manual—3.2.3 Gas Hot Water Heater
Vol.3 Nonresidential Measures July 22, 2020 FINAL Page 69 of 410
N/A
SUMMER COINCIDENT PEAK DEMAND SAVINGS
N/A
NATURAL GAS SAVINGS
Where:
T
out
= Unmixed Outlet Water Temperature
= custom, otherwise assume 140
163
T
in
= Inlet Water Temperature
= custom - otherwise assume 56.5
164
HotWaterUse
Gallon
= Estimated annual hot water consumption (gallons)
= Actual if possible to provide reasonable custom estimate. If not, two
methodologies are provided to develop an estimate:
1. Consumption per usable storage tank capacity
= Capacity * Consumption/cap
Where:
Capacity = Usable capacity of hot water storage tank in gallons
= Actual
165
Consumption/cap = Estimate of consumption per gallon of usable tank
capacity, based on building type:
166
Building Type
167
Consumption/Cap
Convenience
528
163
Ideally the actual set point of the water heater should be used. If not, 140 degrees is provided as an estimate based on
review of building and plumbing codes for IA. The codes limit temperatures at the end use but not at the water heater system,
which can be anywhere in the range 120 -201 degrees. Generally speaking, code limits the temperature to fixtures to 120
degrees F and 140 degrees for applications like laundry or dishwashing.
164
Averaged monthly water main temperature calculated using the methodology provided in Building America Research
Benchmark Definition, updated December 2009. Pg.19-20. http://www.nrel.gov/docs/fy10osti/47246.pdf; water main
temperature represents the average of TMY3 data from all Class I stations located in Des Moines, IA.
165
If the replaced unit is a tankless water heater, the 2
nd
method provided or an alternative should be used to estimate
consumption.
166
Methodology based on Cadmus analysis. Annual hot water usage in gallons based on CBECS (2012) and RECS (2009)
consumption data for West North Central (removed outliers of 1,000 kBtuh or less) to calculate hot water usage. Annual hot
water gallons per tank size gallons based on the tank sizing methodology found in ASHRAE 2011 HVAC Applications. Chapter 50
Service Water Heating. Demand assumptions (gallons per day) for each building type based on ASHRAE Chapter 50 and to LBNL
White Paper. LBL-37398 Technology Data Characterizing Water Heating in Commercial Buildings: Application to End Use
Forecasting. Assumes hot water heater efficiency of 80%.
167
According to CBECS 2012 “Lodging” buildings include Dormitories, Hotels, Motel or Inns and other Lodging and “Nursing”
buildings include Assisted Living and Nursing Homes.
Filed with the Iowa Utilities Board on September 23, 2020, EEP-2018-0002

Iowa Energy Efficiency Statewide Technical Reference Manual—3.2.3 Gas Hot Water Heater
Vol.3 Nonresidential Measures July 22, 2020 FINAL Page 70 of 410
Building Type
167
Consumption/Cap
Education
568
Grocery
528
Health
788
Large Office
511
Large Retail
528
Lodging
715
Other Commercial
341
Restaurant
377
Small Office
511
Small Retail
528
Warehouse
341
Nursing
672
Multifamily
894
2. Consumption per unit area by building type
= (Area/1000) * Consumption/1,000 sq.ft.
Where:
Area = Area in sq.ft that is served by DHW boiler
= Actual
Consumption/1,000 sq.ft. = Estimate of DHW consumption per 1,000
sq.ft. based on building type:
168
Building Type
169
Consumption/1,000
sq.ft.
Convenience
3,634
Education
5,440
Grocery
1,150
Health
13,663
Large Office
1,205
Large Retail
157
Lodging
18,541
Other Commercial
3,573
Restaurant
26,927
Small Office
931
Small Retail
913
Warehouse
476
Nursing
26,721
Multifamily
13,133
168
Methodology based on Cadmus analysis. Annual hot water usage in gallons based on CBECS (2012) and RECS (2009)
consumption data of West North Central (removed outliers of 1,000 kBtuh or less) to calculate hot water usage. Annual hot
water gallons per tank size gallons based on the tank sizing methodology found in ASHRAE 2011 HVAC Applications. Chapter 50
Service Water Heating. Demand assumptions (gallons per day) for each building type based on ASHRAE Chapter 50 and to LBNL
White Paper. LBL-37398 Technology Data Characterizing Water Heating in Commercial Buildings: Application to End Use
Forecasting. Assumes hot water heater efficiency of 80%.
169
According to CBECS 2012 “Lodging” buildings include Dormitories, Hotels, Motel or Inns and other Lodging and “Nursing”
buildings include Assisted Living and Nursing Homes.
Filed with the Iowa Utilities Board on September 23, 2020, EEP-2018-0002

Iowa Energy Efficiency Statewide Technical Reference Manual—3.2.3 Gas Hot Water Heater
Vol.3 Nonresidential Measures July 22, 2020 FINAL Page 71 of 410
γWater = Specific weight capacity of water (lb/gal)
= 8.33 lbs/galAA
1 = Specific heat of water (Btu/lbm/°F)
µ
base
= Rated efficiency of baseline water heater
Equipment Type
Sub Category
Draw
Pattern
µ
base
170
Residential-duty Commercial
High Capacity Storage Gas-Fired
Storage Water Heaters ≤
125,000 Btu/h
≤120 gallon tanks
Very small
UEF = 0.2674 – (0.0009 * V)
Low
UEF = 0.5362 – (0.0012 * V)
Medium
UEF = 0.6002 – (0.0011 * V)
High
UEF = 0.6597 – (0.0009 * V)
Residential Gas Instantaneous
Water Heaters
≤ 200,000 Btu/h
≤2 gal
Very low
UEF = 0.80
All other
UEF = 0.81
Commercial
Gas Storage Water Heaters
>75,000 Btu/h and ≤155,000
Btu/h
>120 gallon tanks
All
80% E
thermal
Standby Losses = (Q /800 + 110√V)
Commercial
Gas Storage Water Heaters
>155,000 Btu/h
All
Commercial Gas Instantaneous
Water Heaters
> 200,000 Btu/h
<10 gal
All
80% E
thermal
≥10 gal
All
80% E
thermal
Where:
V = Rated storage volume of new water heater in gallons
= Actual
Draw Pattern = Draw profile based on actual water heater size and capacity
171
Storage Water Heater Draw Patter
Draw Pattern
First Hour Rating (gallons)
Very Small
≥ 0 and < 18
Low
≥ 18 and < 51
Medium
≥ 51 and < 75
High
≥ 75
Instantaneous Water Heater Draw Patter
Draw Pattern
Max GPM
Very Small
≥ 0 and < 1.7
Low
≥ 1.7 and < 2.8
Medium
≥ 2.8 and < 4.0
High
≥ 4.0
170
Residential-Duty and Commercial Federal Standard are from DOE Standard 10 CFR 431. Residential instantaneous Federal
Standards are from DOE Standard 10 CFR 430.
171
10 CFR 430, Subpart B, Appendix E, Section 5.4.1
Filed with the Iowa Utilities Board on September 23, 2020, EEP-2018-0002

Iowa Energy Efficiency Statewide Technical Reference Manual—3.2.3 Gas Hot Water Heater
Vol.3 Nonresidential Measures July 22, 2020 FINAL Page 72 of 410
µ
eff
= Rated efficiency of efficient water heater (UEF or Thermal Efficiency)
= Actual
100,000 = Converts Btu to Therms
Additional Standby Loss Savings
Gas Storage Water Heaters >75,000 Btu/h and Gas Tankless Water Heaters ≥200,000 Btu/h and with ≥10gal tank can
claim additional savings due to lower standby losses.
Note, Residential-Duty Commercial Water heaters are not eleigible to claim additional standby losses savings
because the Uniform Energy Factor efficiency rating includes standby loss considerations.
Where:
SL
base
= Standby loss of baseline unit
Q =Nameplate input rating in Btu/h
V = Rated volume in gallons
SL
eff
= Nameplate standby loss of new water heater, in BTU/h
8766 = Hours per year
PEAK GAS SAVINGS
Savings for this measure are assumed to be evenly spread across the year. The Peak Gas Savings is therefore assumed
to be:
Example - Commercial Water Heater: for a 95% Thermal Efficiency, 130,000 Btu/hr, 100 gallon storage unit with
rated standby loss of 1,079 Btu/h installed in a 1,500 ft
2
restaurant:
ΔTherms
Unit
= ((140 – 56.5) * ((1,500/1,000) * 26,927) * 8.33 * 1 * (1/0.8 - 1/0.95))/100,000
= 55.4 Therms
ΔTherms
Standby
= (((130,000/800 + 110 * √100) – 1,079) * 8,766)/100,000
= 16.1 Therms
ΔTherms = 55.4 + 16.1
= 71.5 Therms
Example - Residential-Duty Commercial Water Heater: for a 0.86 Uniform Energy Factor (UEF), 100,000 Btu/hr,
74 gallon storage unit with first hour rating of 130 gallons installed in a 6,000 ft
2
multifamily apartment building:
Draw Pattern = High (First hour rating > 75 gallons)
UEF
Base
= 0.6597−(0.0009 × 74)
= 0.5931
ΔTherms
Unit
= ((140 – 56.5) * ((6,000/1,000) * 13,133) * 8.33 * 1 * (1/0.5934 - 1/0.86))/100,000
= 286.3 Therms
ΔTherms
Standby
= 0 – This is a Residential-Duty Commercial Water heater which does not qualify for
standy loss savings
ΔTherms = 286.3 Therms
Filed with the Iowa Utilities Board on September 23, 2020, EEP-2018-0002

Iowa Energy Efficiency Statewide Technical Reference Manual—3.2.3 Gas Hot Water Heater
Vol.3 Nonresidential Measures July 22, 2020 FINAL Page 73 of 410
Where:
ΔTherms = Therm impact calculated above
365.25 = Days per year
WATER IMPACT DESCRIPTIONS AND CALCULATION
N/A
DEEMED O&M COST ADJUSTMENT CALCULATION
Annual O&M for storage water heaters is assumed to be consistent between baseline and efficient.
The deemed O&M cost adjustment for a gas fired tankless heater is assumed to be $100.
172
MEASURE CODE: NR-HWE-GHWH-V05-210101
SUNSET DATE: 1/1/2022
172
Tankless Water Heaters require annual maintenance by licensed professionals to clean control compartments, burners,
venting system, and heat exchangers. The incremental cost of the additional annual maintenance for tankless WH is estimated
at $100.
For example, for a 95% Thermal Efficiency, 130,000 Btu/hr, 100 gallon storage unit with rated standby loss of
1,079 BTU/h installed in a restaurant:
ΔPeakTherms = 71.5 / 365.25
= 0.1958 Therms
Filed with the Iowa Utilities Board on September 23, 2020, EEP-2018-0002

Iowa Energy Efficiency Statewide Technical Reference Manual—3.2.4 Controls for Central Domestic Hot Water
Vol.3 Nonresidential Measures July 22, 2020 FINAL Page 74 of 410
3.2.4. Controls for Central Domestic Hot Water
DESCRIPTION
Demand control recirculation pumps seek to reduce inefficiency by combining control via temperature and demand
inputs, whereby the controller will not activate the recirculation pump unless both (a) the recirculation loop return
water has dropped below a prescribed temperature (e.g. 100°F) and (b) a CDHW demand is sensed as water flow
through the CDHW system.
This measure was developed to be applicable to the following program types: RF. If applied to other program
types, the measure savings should be verified.
DEFINITION OF EFFICIENT EQUIPMENT
Re-circulating pump shall cycle on based on (a) the recirculation loop return water dropping below a prescribed
temperature (e.g. 100°F) and (b) a CDHW demand is sensed as water flow through the CDHW system.
DEFINITION OF BASELINE EQUIPMENT
The base case for this measure category is an existing, un-controlled recirculation pump on a gas-fired Central
Domestic Hot Water System.
DEEMED LIFETIME OF EFFICIENT EQUIPMENT
The effective useful life is 15 years.
173
DEEMED MEASURE COST
Actual material and labor costs should be used if available. If actual costs are unknown, the assumed measure cost
is $1,200 per pump.
174
LOADSHAPE
Loadshape NREW08 – Nonresidential Electric Hot Water – Multifamily
Loadshape NRGW08 – Nonresidential Gas Hot Water - Multifamily
Algorithm
CALCULATION OF ENERGY SAVINGS
175
Savings shown are per pump.
ELECTRIC ENERGY SAVINGS
Deemed at 651 kWh.
176
SUMMER COINCIDENT PEAK DEMAND SAVINGS
173
Benningfield Group. (2009). PY 2009 Monitoring Report: Demand Control for Multifamily Central Domestic Hot Water.
Folsom, CA: Prepared for Southern California Gas Company, October 30, 2009.
174
Gas Technology Institute. (2014). 1003: Demand-based domestic hot water recirculation Public project report. Des Plaines, IL:
Prepared for Nicor Gas, January 7, 2014.
175
See Illinois_Statewide_TRM_Workpaper_Demand Control Central DHW for more details.
176
Based on results from the Nicor Gas Emerging Technology Program study, this value is the average kWh saved per pump.
Note this value does not reflect savings from electric units but electrical savings from gas-fired units.
Filed with the Iowa Utilities Board on September 23, 2020, EEP-2018-0002

Iowa Energy Efficiency Statewide Technical Reference Manual—3.2.4 Controls for Central Domestic Hot Water
Vol.3 Nonresidential Measures July 22, 2020 FINAL Page 75 of 410
Summer coincident peak demand savings are expected to be negligible.
NATURAL GAS SAVINGS
177
∆Therms = 55.9 * number of dwelling units
PEAK GAS SAVINGS
Savings for this measure are assumed to be evenly spread across the year. The Peak Gas Savings is therefore assumed
to be:
Where:
ΔTherms = Therm impact calculated above
365.25 = Days per year
WATER IMPACT DESCRIPTIONS AND CALCULATION
N/A
DEEMED O&M COST ADJUSTMENT CALCULATION
N/A
MEASURE CODE: NR-HWE-DHWC-V02-180101
SUNSET DATE: 1/1/2023
177
Based on results from the Nicor Gas Emerging Technology Program study, this value is the average therms saved per
dwelling unit.
For example, an apartment building with 53 units:
∆Therms = 55.9 * 53
= 2,962.7 therms
For example, an apartment building with 53 units:
∆PeakTherms = 2,962.7 / 365.25
= 8.11 therms
Filed with the Iowa Utilities Board on September 23, 2020, EEP-2018-0002
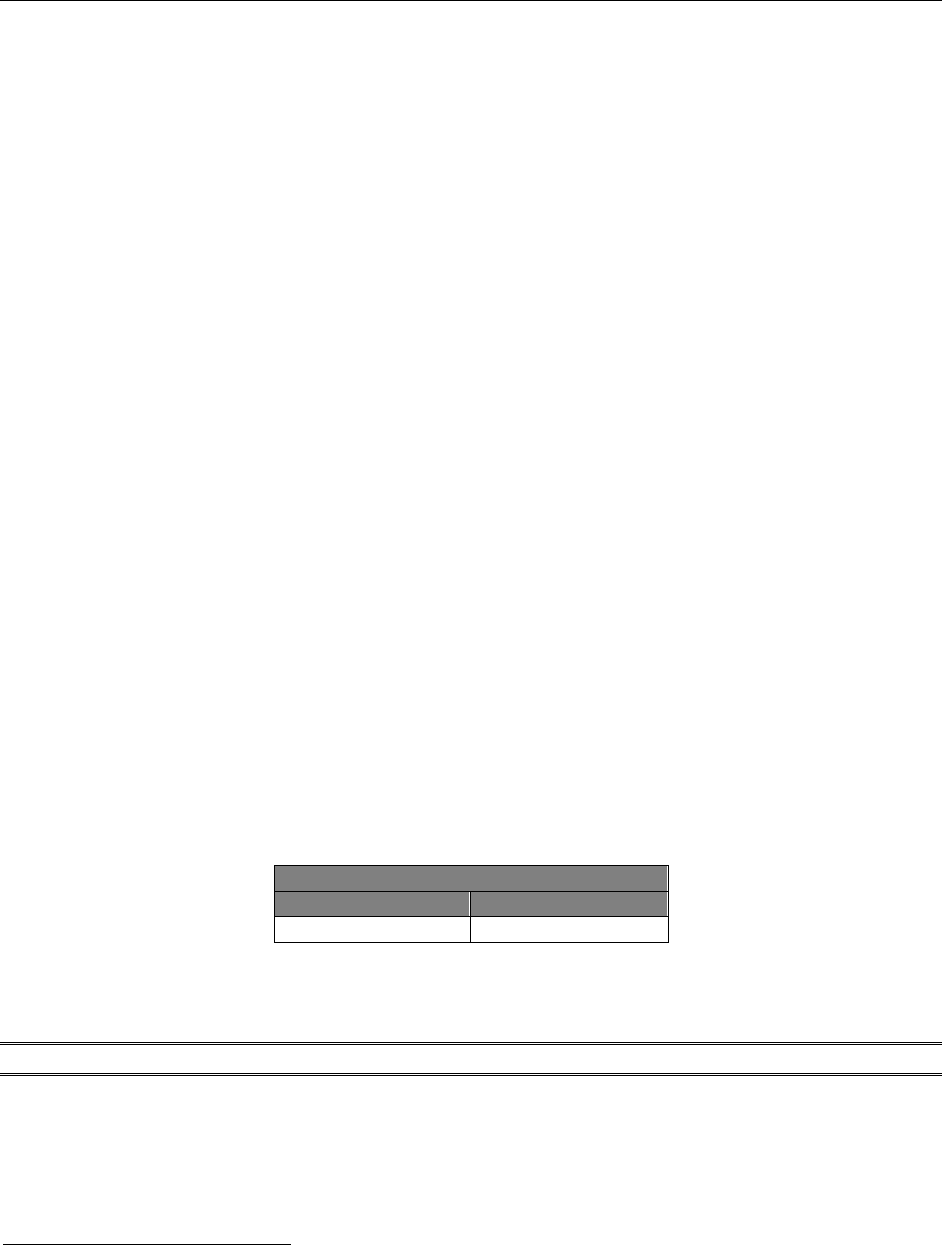
Iowa Energy Efficiency Statewide Technical Reference Manual—3.2.5 Pool Covers
Vol.3 Nonresidential Measures July 22, 2020 FINAL Page 76 of 410
3.2.5. Pool Covers
DESCRIPTION
This measure refers to the installation of covers on commercial use pools that are heated with gas-fired equipment.
By installing pool covers, the heating load on the pool boiler will be reduced by reducing the heat loss from the water
to the environment and the amount of actual water lost due to evaporation (which then requires additional heated
water to make up for it).
The main source of energy loss in pools is through evaporation. This is particularly true of outdoor pools where wind
plays a larger role. The point of installing pool covers is threefold. First, it will reduce convective losses due to the
wind or air movement by shielding the water surface. Second, it will insulate the water from the colder surrounding
air. And third, it will reduce radiative losses to the night sky (for outdoor pools). In doing so, evaporative losses will
also be minimized, and the boiler will not need to work as hard in replenishing the pool with hot water to keep the
desired temperature.
This measure was developed to be applicable to the following program types: TOS, NC, RF.
If applied to other program types, the measure savings should be verified.
DEFINITION OF EFFICIENT EQUIPMENT
The efficient case is the installation of a pool cover with a 5 year warranty.
DEFINITION OF BASELINE EQUIPMENT
The base case is a pool that is uncovered.
DEEMED LIFETIME OF EFFICIENT EQUIPMENT
The useful life of this measure is assumed to be 6 years.
178
DEEMED MEASURE COST
For retrofits, actual material and labor costs should be used if available. If actual costs are unknown, use the
following costs based on square footage and whether the cover is manually operated or automatic:
$ / Sqft
179
Manually Operated
Automatic
$1.50
$6.50
LOADSHAPE
Loadshape NRGW01:16 – Nonresidential Gas Hot Water (by Building Type)
Algorithm
CALCULATION OF ENERGY SAVINGS
ELECTRIC ENERGY SAVINGS
N/A
178
The effective useful life of a pool cover is typically one year longer than its warranty period. SolaPool Covers. Pool Covers
Website, FAQ- "How long will my SolaPool cover blanket last?". Pool covers are typically offered with 3 and 5 year warranties
with at least one company offering a 6 year warranty. Conversation with Trade Ally. Knorr Systems
179
Based on the average costs used by the U.S. DOE’s Energy Smart Pools software
Filed with the Iowa Utilities Board on September 23, 2020, EEP-2018-0002

Iowa Energy Efficiency Statewide Technical Reference Manual—3.2.5 Pool Covers
Vol.3 Nonresidential Measures July 22, 2020 FINAL Page 77 of 410
Note: indoor pool covers may also save electricity due to positive interactions with the building’s HVAC system.
However, since these interactions are very site dependent, a custom calculation should be used to determine impact.
SUMMER COINCIDENT PEAK DEMAND SAVINGS
N/A
NATURAL GAS SAVINGS
Where
Savings Factor = dependant on season and location:
180
Season and
Location
Savings Factor
(Therms / ft
2
)
Spring
0.37
Summer
0.21
Fall
0.77
Winter
0.92
Year-round
2.27
Indoor
0.9
Sqft = surface area of the pool in ft
2
= Actual
η
heat
= Efficiency of gas heating system
= Actual
PEAK GAS SAVINGS
Savings for this measure are assumed to be evenly spread across the operating season. The Peak Gas Savings is
therefore assumed to be:
Where:
ΔTherms = Therm impact calculated above
Days = Days in operating season
= Actual
WATER IMPACT DESCRIPTIONS AND CALCULATION
Water savings result from a reduction in evaporative losses:
Where:
180
The calculations are based on modeling runs using Energy Smart Pools Software that was created by the U.S. Department of
Energy. See Commercial Pool Cover Calcs.xlsx for additional details.
Filed with the Iowa Utilities Board on September 23, 2020, EEP-2018-0002

Iowa Energy Efficiency Statewide Technical Reference Manual—3.2.5 Pool Covers
Vol.3 Nonresidential Measures July 22, 2020 FINAL Page 78 of 410
Sqft = surface area of the pool in ft
2
= Actual
h
makeup
= Height, in inches, the pool is typically filled when make-up water is added
= Actual
Freq = Total number of water make-up events throughout the operating season
= Actual
7.48052 = gallons of water per ft
3
12 = inches per foot
0.3
181
= conservative estimate for the reduction of make-up water required
DEEMED O&M COST ADJUSTMENT CALCULATION
There are no O&M cost adjustments for this measure.
MEASURE CODE: NR-HWE-PCOV-V02-180101
SUNSET DATE: 1/1/2023
181
As listed on http://energy.gov/energysaver/swimming-pool-covers
Filed with the Iowa Utilities Board on September 23, 2020, EEP-2018-0002

Iowa Energy Efficiency Statewide Technical Reference Manual—3.2.6 Drainwater Heat Recovery
Vol.3 Nonresidential Measures July 22, 2020 FINAL Page 79 of 410
3.2.6. Drainwater Heat Recovery
DESCRIPTION
Drain-water (or greywater) heat recovery systems capture and reuse energy from a drainpipe to preheat incoming
cold water, thereby reducing the amount of energy needed for domestic water heating. The heat recovery device
typically consists of a wound copper heat exchanger that replaces a vertical section of a main waste drain. As warm
water flows down the waste drain, incoming cold water flows through a spiral copper tube wrapped tightly around
the section of the waste drain, preheating the incoming cold water.
This measure was developed to be applicable to the following program types: NC, RF.
If applied to other program types, the measure savings should be verified.
DEFINITION OF EFFICIENT EQUIPMENT
The efficient condition is installation of a drainwater heat recovery device.
DEFINITION OF BASELINE EQUIPMENT
The baseline condition is no drainwater heat recovery system.
DEEMED LIFETIME OF EFFICIENT EQUIPMENT
The expected measure life for recovery devices is 25 years.
182
DEEMED MEASURE COST
Actual installation costs should be used, as cost will be related to the length of the installed device.
LOADSHAPE
Loadshape NREW01:16 – Nonresidential Electric Hot Water (by building type)
Loadshape NRGW01:16 – Nonresidential Gas Hot Water (by Building Type)
Algorithm
CALCULATION OF SAVINGS
ELECTRIC ENERGY SAVINGS
For sites with electric DHW:
Where:
T
out
= Unmixed Outlet Water Temperature from the DHW system
= Actual, otherwise assume 140
183
182
Conservative estimate based on product manufacturer published expected lifetime.
183
Ideally the actual set point of the water heater should be used. If not, 140 degrees is provided as an estimate based on
review of building and plumbing codes for IA. The codes limit temperatures at the end use but not at the water heater system,
which can be anywhere in the range 120 -201 degrees. Generally speaking, code limits the temperature to fixtures to 120
Filed with the Iowa Utilities Board on September 23, 2020, EEP-2018-0002

Iowa Energy Efficiency Statewide Technical Reference Manual—3.2.6 Drainwater Heat Recovery
Vol.3 Nonresidential Measures July 22, 2020 FINAL Page 80 of 410
T
in
= Inlet Water Temperature to the DHW system
= Actual, otherwise assume 56.5
184
HotWaterUse
Gallon
= Estimated annual hot water consumption (gallons)
= Actual if possible to provide reasonable custom estimate. If not, two methodologies are
provided to develop an estimate:
1. Consumption per usable storage tank capacity
= Capacity * Consumption/cap
Where:
Capacity = Usable capacity of hot water storage tank in gallons
= Actual
Consumption/cap = Estimate of consumption per gallon of usable tank
capacity, based on building type:
185
Building Type
186
Consumption/Cap
Convenience
528
Education
568
Grocery
528
Health
788
Large Office
511
Large Retail
528
Lodging
715
Other Commercial
341
Restaurant
377
Small Office
511
Small Retail
528
Warehouse
341
Nursing
672
Multifamily
894
2. Consumption per unit area by building type
= (Area/1000) * Consumption/1,000 sq.ft.
Where:
Area = Area in sq.ft that is served by DHW boiler
degrees F and 140 degrees for applications like laundry or dishwashing.
184
Averaged monthly water main temperature calculated using the methodology provided in Building America Research
Benchmark Definition, updated December 2009. Pg.19-20. http://www.nrel.gov/docs/fy10osti/47246.pdf; water main
temperature represents the average of TMY3 data from all Class I stations located in Des Moines, IA.
185
Methodology based on Cadmus analysis. Annual hot water usage in gallons based on CBECS (2012) and RECS (2009)
consumption data for West North Central (removed outliers of 1,000 kBtuh or less) to calculate hot water usage. Annual hot
water gallons per tank size gallons based on the tank sizing methodology found in ASHRAE 2011 HVAC Applications. Chapter 50
Service Water Heating. Demand assumptions (gallons per day) for each building type based on ASHRAE Chapter 50 and to LBNL
White Paper. LBL-37398 Technology Data Characterizing Water Heating in Commercial Buildings: Application to End Use
Forecasting. Assumes hot water heater efficiency of 80%.
186
According to CBECS 2012 “Lodging” buildings include Dormitories, Hotels, Motel or Inns and other Lodging and “Nursing”
buildings include Assisted Living and Nursing Homes.
Filed with the Iowa Utilities Board on September 23, 2020, EEP-2018-0002
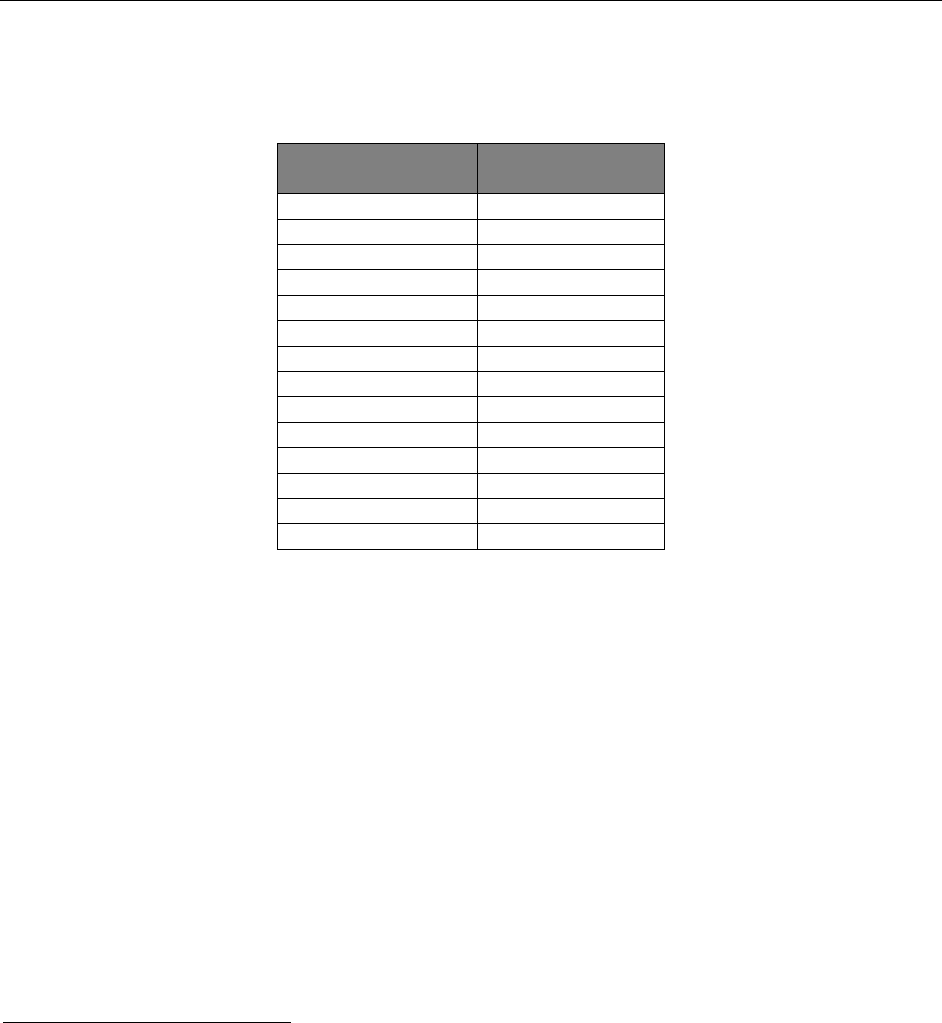
Iowa Energy Efficiency Statewide Technical Reference Manual—3.2.6 Drainwater Heat Recovery
Vol.3 Nonresidential Measures July 22, 2020 FINAL Page 81 of 410
= Actual
Consumption/1,000 sq.ft. = Estimate of DHW consumption per 1,000
sq.ft. based on building type:
187
Building Type
188
Consumption/1,000
sq.ft.
Convenience
3,634
Education
5,440
Grocery
1,150
Health
13,663
Large Office
1,205
Large Retail
157
Lodging
18,541
Other Commercial
3,573
Restaurant
26,927
Small Office
931
Small Retail
913
Warehouse
476
Nursing
26,721
Multifamily
13,133
γWater = Specific weight capacity of water (lb/gal)
= 8.33 lbs/gal
1 = Specific heat of water (Btu/lbm/°F)
= Actual
η
PRA
= Practical effectiveness of drainwater heat recovery (percentage of DHW output energy
that the device can recover)
= 25%.
189
Note: practical effectiveness is generally lower than the effectiveness reported
by manufacturers, which assume steady state operation, typically with equal flow rates.
In practice, however, flow rates are rarely steady state and are unequal, and as a result
effectiveness is constantly changing. Practical effectiveness can therefore be thought of
the time-averaged value of effectiveness and could only be difinitely determined through
on-site data collection.
3,412 = Conversion from Btu to kWh
187
Methodology based on Cadmus analysis. Annual hot water usage in gallons based on CBECS (2012) and RECS (2009)
consumption data of West North Central (removed outliers of 1,000 kBtuh or less) to calculate hot water usage. Annual hot
water gallons per tank size gallons based on the tank sizing methodology found in ASHRAE 2011 HVAC Applications. Chapter 50
Service Water Heating. Demand assumptions (gallons per day) for each building type based on ASHRAE Chapter 50 and to LBNL
White Paper. LBL-37398 Technology Data Characterizing Water Heating in Commercial Buildings: Application to End Use
Forecasting. Assumes hot water heater efficiency of 80%.
188
According to CBECS 2012 “Lodging” buildings include Dormitories, Hotels, Motel or Inns and other Lodging and “Nursing”
buildings include Assisted Living and Nursing Homes.
189
Metering study found savings to range from 25% to 30%. Assume 25% savings for this analysis and interpolated from graph
of Figure 2. Heating contributions depend on inlet water temperature (page 3) based on: Tomlinson, J. J. Letter to Marc
LaFrance, Manager, Appliance and Emerging Technology Program, US Department of Energy. Subject: GFX Evaluation. Oak
Ridge, TN: Oak Ridge National Laboratory, accessed 07 November 2008, http://gfxtechnology.com/Duluth-Triplex.pdf. With
reference to "A Quantitative Study of the Viability of Greywater Heat Recovery (GWHR)", June 2011
Filed with the Iowa Utilities Board on September 23, 2020, EEP-2018-0002

Iowa Energy Efficiency Statewide Technical Reference Manual—3.2.6 Drainwater Heat Recovery
Vol.3 Nonresidential Measures July 22, 2020 FINAL Page 82 of 410
RE
electric
= Recovery efficiency of electric DHW system
= Actual if known - if not, assume:
= 0.98
190
SUMMER COINCIDENT PEAK DEMAND SAVINGS
Where:
Hours = 8,766
CF = Summer Peak Coincidence Factor for measure
= 1
NATURAL GAS SAVINGS
For sites with natural gas DHW:
Where:
100,000 = Converts Btu to Therms
RE
gas
= Recovery efficiency of gas DHW system
= Actual if known - if not, assume:
= 78%
191
Other terms as defined above.
190
Electric water heaters have recovery efficiency of 98%: https://www.ahridirectory.org/Search/SearchHome
191
DOE Final Rule discusses Recovery Efficiency with an average around 0.76 for Gas Fired Storage Water heaters and 0.78 for
standard efficiency gas fired tankless water heaters up to 0.95 for the highest efficiency gas fired condensing tankless water
heaters. These numbers represent the range of new units however, not the range of existing units in stock. Review of AHRI
Directory suggests range of recovery efficiency ratings for new Gas DHW units of 70-87%. Average of existing units is estimated
at 78%.
For example, for an electric DHW system with a 100 gallon storage unit and a recovery efficiency of 98% installed
in a restaurant:
ΔkWh = (140 – 56.5) * (377 * 100) * 8.33 * 1 * 0.25 / (3,412 * 0.98)
= 1,960.5 kWh
For example, for an electric DHW system with a 100 gallon storage unit and a recovery efficiency of 98% installed
in a restaurant:
ΔkW = 1,960.5 / 8,766 * 1
= 0.22 kW
Filed with the Iowa Utilities Board on September 23, 2020, EEP-2018-0002

Iowa Energy Efficiency Statewide Technical Reference Manual—3.2.6 Drainwater Heat Recovery
Vol.3 Nonresidential Measures July 22, 2020 FINAL Page 83 of 410
PEAK GAS SAVINGS
Savings for this measure are assumed to be evenly spread across the year. The Peak Gas Savings is therefore assumed
to be:
Where:
ΔTherms = Therm impact calculated above
365.25 = Days per year
WATER IMPACT DESCRIPTIONS AND CALCULATION
N/A
DEEMED O&M COST ADJUSTMENT CALCULATION
There are no operation and maintenance costs associated with this measure.
MEASURE CODE: NR-HWE-DWHR-V03-190101
SUNSET DATE: 1/1/2023
For example, for a natural gas DHW system with a 100 gallon storage unit and a recovery efficiency of 85%
installed in a restaurant:
ΔTherms = (140 – 56.5) * (377 * 100) * 8.33 * 1 * 0.25 / (100,000 * 0.85)
= 77.1 Therms
For example, for a natural gas DHW system with a 100 gallon storage unit and a recovery efficiency of 85%
installed in a restaurant:
ΔPeakTherms =77.1 / 365.25
= 0.2111 Therms
Filed with the Iowa Utilities Board on September 23, 2020, EEP-2018-0002

Iowa Energy Efficiency Statewide Technical Reference Manual – 3.3 HVAC End Use
Vol.3 Nonresidential Measures July 22, 2020 FINAL Page 84 of 410
3.3. Heating, Ventilation, and Air Conditioning (HVAC)
Many of the Nonresidential HVAC measures use equivalent full load hours (EFLH) to calculate heating and cooling
savings. The tables with these values are included in this section and referenced in each measure. Values for both
existing and new construction buildings are provided.
To calculate the EFLH by building type and climate zone provided below, VEIC created models (using OpenStudio or
eQuest as available) for each building type. The EFLH calculation is based on hourly building loads (total
heating/cooling output). The calculation allows for a more generally applicable EFLH determination that is tied to
the load profiles of various building prototypes and not affected by modeling irregularities that can be equipment
specific. The load profiles are related to system characteristics such as constant vs. variable air volume and single-
vs. multi-zone configurations, but not sensitive to how the energy model treats equipment operation at very low
loads or performs sizing estimates. The calculation is the annual total (heating or cooling) output (in Btu) divided by
the 95th percentile hourly peak output (heating or cooling) demand (in Btu/hr). This keeps EFLH independent of
modeled equipment efficiency (which is accounted for in the TRM savings calculation) and energy model sizing. It
also buffers EFLH value from hourly variances in the modeling that are not representative of actual buildings.
The OpenStudio and eQuest models, prototype building descriptions, methodology documentation, and final results
can be found on the Iowa TRM SharePoint Site (TRM Reference Documents/ Non Residential/ Modeling).
Note where a measure installation is within a building or application that does not fit with any of the defined building
types below, the user should apply custom assumptions where it is reasonable to estimate them, else the building
of best fit should be used. For the specific assumptions used in each model, refer to table in the “IA Prototype
Building Descriptions” file in the SharePoint folder referenced above.
Existing Building
Building Type
Zone 5
(Burlington)
Zone 6
(Mason City)
Average /
Unknown
Weighting
Factors for
Nonresidential
Average
192
Model
Source
Heating
EFLH
Cooling
EFLH
Heating
EFLH
Cooling
EFLH
Heating
EFLH
Cooling
EFLH
Education
1298
1073
1529
848
1351
928
9%
OpenStudio
Grocery
1493
320
1754
221
1601
356
0%
OpenStudio
Health
1206
1449
1430
996
1346
1207
0%
OpenStudio
Hospital
1084
1792
940
1436
1082
1662
0%
OpenStudio
Lodging
1365
1464
1464
1252
1494
1460
0%
OpenStudio
Multifamily
1521
1472
1846
1045
1694
1349
0%
OpenStudio
Office - Large
1457
1141
1748
843
1549
1084
0%
OpenStudio
Office - Small
1250
986
1435
667
1358
882
26%
OpenStudio
Restaurant
1040
1397
1324
937
1173
1249
7%
OpenStudio
Retail - Large
1255
846
1523
616
1348
845
5%
OpenStudio
Retail - Small
1172
891
1471
531
1372
780
11%
OpenStudio
192
The weighting used to average modeled variables into a generic, nonresidential category is based on the number of buildings
matching each building type in the 2012 Commercial Buildings Energy Consumption Survey (CBECS) Data for the Midwest Region,
West North Central Division, which includes Iowa. Building types that comprise less than 5% of the total population are excluded
from the weighted averaging. Vales rounded in table, see model reference files for exact values.
Filed with the Iowa Utilities Board on September 23, 2020, EEP-2018-0002

Iowa Energy Efficiency Statewide Technical Reference Manual – 3.3 HVAC End Use
Vol.3 Nonresidential Measures July 22, 2020 FINAL Page 85 of 410
Building Type
Zone 5
(Burlington)
Zone 6
(Mason City)
Average /
Unknown
Weighting
Factors for
Nonresidential
Average
192
Model
Source
Warehouse
1277
1032
1589
539
1443
864
26%
OpenStudio
Convenience
785
1477
1224
1128
1071
1351
0%
eQuest
Industrial
849
1185
1275
856
1183
1063
0%
eQuest
Religious
1322
1109
1873
797
1796
1031
16%
eQuest
Nonresidential
Average
1251
1034
1555
669
1438
915
N/A
N/A
New Construction
Building Type
Zone 5
(Burlington)
Zone 6
(Mason City)
Average /
Unknown
Weighting
Factors for
Nonresidential
Average
193
Model
Source
Heating
EFLH
Cooling
EFLH
Heating
EFLH
Cooling
EFLH
Heating
EFLH
Cooling
EFLH
Education
510
776
683
464
591
645
11%
OpenStudio
Health
778
1482
972
1073
864
1328
0%
OpenStudio
Hospital
1799
1422
1520
946
2196
1356
0%
OpenStudio
Lodging
1080
1204
1491
813
1471
1105
0%
OpenStudio
Office - Large
710
816
917
641
862
823
0%
OpenStudio
Office - Small
450
616
590
448
492
542
31%
OpenStudio
Restaurant
896
915
1192
572
1048
825
8%
OpenStudio
Retail - Large
709
764
906
504
839
711
6%
OpenStudio
Retail - Small
785
749
1036
486
986
744
13%
OpenStudio
Warehouse
886
223
1238
35
1116
148
31%
OpenStudio
Convenience
N/A
194
Industrial
Religious
Grocery
Multifamily
Nonresidential
Average
690
560
930
338
830
488
N/A
N/A
193
The weighting used to average modeled variables into a generic, nonresidential category is based on the number of buildings
matching each building type in the 2012 Commercial Buildings Energy Consumption Survey (CBECS) Data for the Midwest Region,
West North Central Division, which includes Iowa. Building types that comprise less than 5% of the total population are excluded
from the weighted averaging. Note: weighting is different than that for Existing Building due to exclusion of building types with
“N/A” values.
194
Constraints related to prototype building information availability results in New Construction assumptions being unavailable
for these building types. These building types will be added in a future cycle when prototype information becomes available.
Filed with the Iowa Utilities Board on September 23, 2020, EEP-2018-0002

Iowa Energy Efficiency Statewide Technical Reference Manual –3.3.1 Boiler
Vol.3 Nonresidential Measures July 22, 2020 FINAL Page 86 of 410
3.3.1. Boiler
DESCRIPTION
To qualify for this measure, the installed equipment must be a replacement for an existing boiler at the end of its
service life, in a nonresidential or multifamily space with a high efficiency, gas-fired hot water boiler. High efficiency
condensing boilers achieve gas savings through the use of a sealed combustion chamber and multiple heat
exchangers that remove a significant portion of the waste heat from flue gasses. Because multiple heat exchangers
are used to remove waste heat from the escaping flue gasses, some of the flue gasses condense and must be drained.
This measure is limited to boilers providing space heat only or combined space and DHW, and not DHW only boilers.
This measure was developed to be applicable to the following program types: TOS, NC.
If applied to other program types, the measure savings should be verified.
DEFINITION OF EFFICIENT EQUIPMENT
To qualify for this measure, the installed equipment must be a natural gas condensing boiler used for space heating,
not process, and boiler efficiency rating must meet the minimum standards according to utility program
requirements.
DEFINITION OF BASELINE EQUIPMENT
The baseline efficiency source is a natural gas non-condensing boiler used for space heating, not process, meeting
the federal equipment standards. The current Federal Standard minimum AFUE rating is 84% for boilers <300,000
Btu/hr capacity,
195
80% E
T
for boilers ≥300,000 Btu/h and ≤2,500,000 Btu/h, and 82% E
C
for boilers >2,500,000
Btu/h.
196
DEEMED LIFETIME OF EFFICIENT EQUIPMENT
The expected measure life is assumed to be 25 years.
197
DEEMED MEASURE COST
The incremental install cost for boilers with <300,000 Btu/hr input capacity is provided in the table below and is
dependent on AFUE efficiency.
198
Any boiler ≥300,000 Btu/h input capacity shall use a custom cost input.
AFUE
Full Install
Cost
Incremental
Install Cost
84%
$4,053
n/a
85%
$4,468
$415
86%
$5,264
$1,211
87%
$5,276*
$1,223
88%
$5,397*
$1,344
89%
$5,518*
$1,465
90%
$5,638*
$1,585
195
Code of Federal Regulations, 10 CFR 430.32(e)(2). http://www.gpo.gov/fdsys/pkg/CFR-2011-title10-vol3/pdf/CFR-2011-
title10-vol3-sec430-32.pdf. Future energy conservation standards are under development.
196
Thermal Efficiency. Code of Federal Regulations, 10 CFR 431.87.
197
U.S. Department of Energy, “Chapter 8 Life Cycle Cost and Payback Period Analysis,” Residential Furnaces and Boilers
Technical Support Document, 2007. Table 8.3.3.
http://www1.eere.energy.gov/buildings/appliance_standards/residential/pdfs/fb_fr_tsd/chapter_8.pdf
198
Based on data provided in Federal Appliance Standards, Chapter 8.3, of DOE Technical Support Documents; Table 8.5.6 LCC
and PBP Results for Hot-Water Gas Boilers (High Cost). Where efficiency ratings are not provided, the values are interpolated
from those that are and market with an *. See “Boiler_DOE Chapter 8_Commercial.xls” for more information.
Filed with the Iowa Utilities Board on September 23, 2020, EEP-2018-0002

Iowa Energy Efficiency Statewide Technical Reference Manual –3.3.1 Boiler
Vol.3 Nonresidential Measures July 22, 2020 FINAL Page 87 of 410
AFUE
Full Install
Cost
Incremental
Install Cost
91%
$5,583
$1,530
92%
$5,734*
$1,681
93%
$5,885*
$1,832
94%
$6,036*
$1,983
95%
$6,188*
$2,135
96%
$6,339*
$2,286
97%
$6,490*
$2,437
98%
$6,641*
$2,588
99%
$6,792
$2,739
Actual costs may be used if associated baseline costs can also be estimated for the application.
LOADSHAPE
Loadshape NRGH01:16 – Nonresidential Gas Heating (by Building Type)
Loadshape NRGB01:16 – Nonresidential Gas Heat and Hot Water (by Building Type)
Algorithm
CALCULATION OF ENERGY SAVINGS
ELECTRIC ENERGY SAVINGS
N/A
SUMMER COINCIDENT PEAK DEMAND SAVINGS
N/A
NATURAL GAS ENERGY SAVINGS
Where:
EFLH = Equivalent Full Load Hours for heating are provided in section 3.3 HVAC End Use
Capacity = Nominal Heating Input Capacity Boiler Size (Btu/hr) for efficient unit, not existing unit
= Actual
EfficiencyRating(base) =Baseline equipment efficiency rating, depending on boiler input capacity.
Boiler Input Capacity
Efficiency Rating
<300,000 Btu/hr
84% AFUE
199
≥300,000 Btu/h and ≤2,500,000 Btu/h
80% E
T
200
199
Code of Federal Regulations, 10 CFR 430.32(e)(2). http://www.gpo.gov/fdsys/pkg/CFR-2011-title10-vol3/pdf/CFR-2011-
title10-vol3-sec430-32.pdf. Future energy conservation standards are under development.
200
Thermal Efficiency. Code of Federal Regulations, 10 CFR 431.87.
Filed with the Iowa Utilities Board on September 23, 2020, EEP-2018-0002
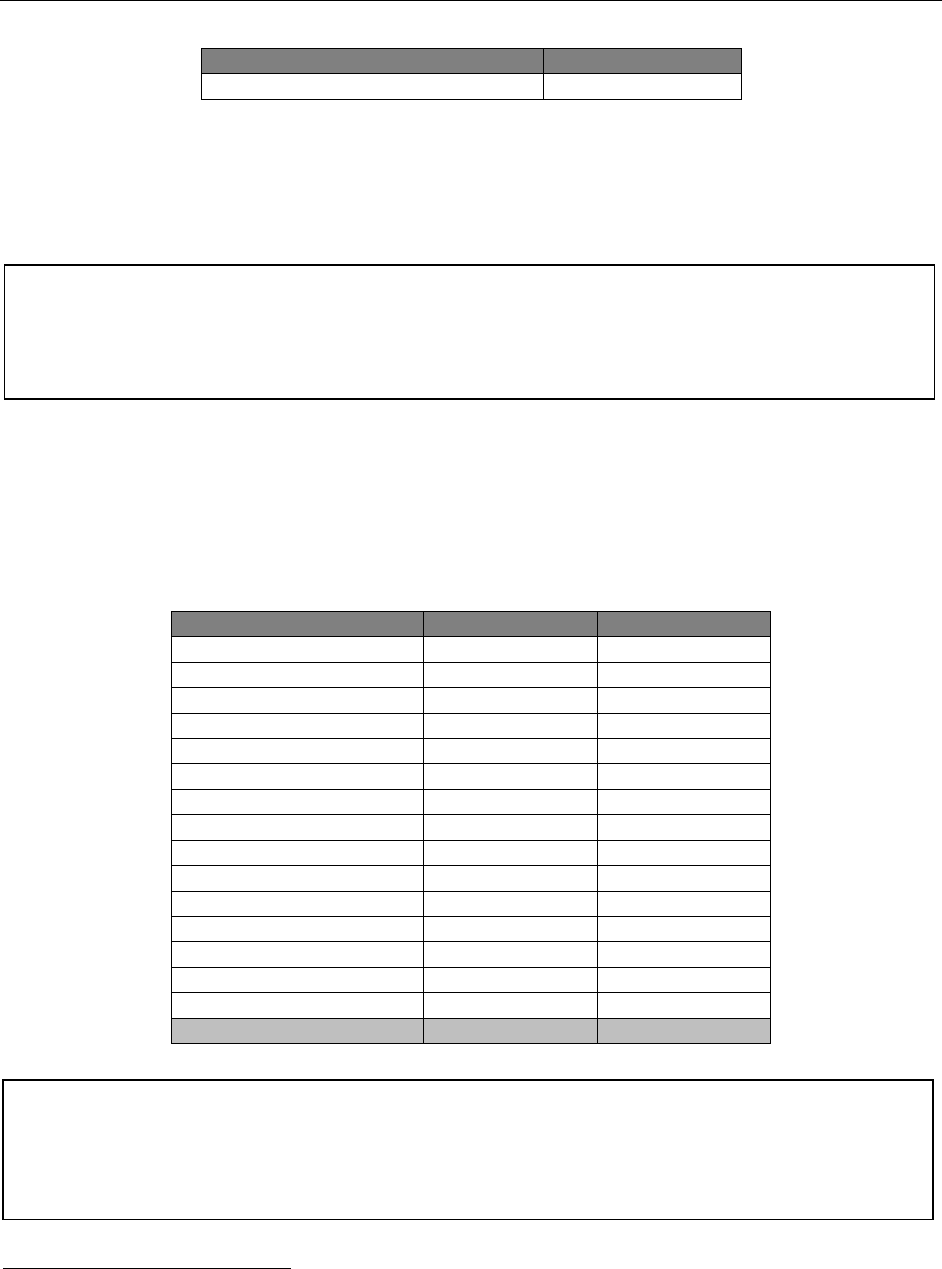
Iowa Energy Efficiency Statewide Technical Reference Manual –3.3.1 Boiler
Vol.3 Nonresidential Measures July 22, 2020 FINAL Page 88 of 410
Boiler Input Capacity
Efficiency Rating
>2,500,000 Btu/h
82% E
C
201
EfficiencyRating(EE) = Efficent equipment efficiency rating
= Actual
100,000 = Conversion of Btu to Therms
PEAK GAS SAVINGS
Where:
ΔTherms = Therm impact calculated above
GCF = Gas Coincidence Factor for Heating
Building Type
GCF
202
Model Source
Convenience
0.01631
eQuest
Education
0.011480
OpenStudio
Grocery
0.013083
OpenStudio
Health
0.010179
OpenStudio
Hospital
0.015543
OpenStudio
Industrial
0.014240
eQuest
Lodging
0.013205
OpenStudio
Multifamily
0.012268
OpenStudio
Office - Large
0.013082
OpenStudio
Office - Small
0.016718
OpenStudio
Religious
0.011745
eQuest
Restaurant
0.015262
OpenStudio
Retail - Large
0.013281
eQuest
Retail - Small
0.014055
OpenStudio
Warehouse
0.015677
eQuest
Nonresidential Average
203
0.014623
N/A
201
Combustion Efficiency. Code of Federal Regulations, 10 CFR 431.87
202
Calculated as the percentage of total savings in the maximum saving day, from models.
203
For weighting factors, see HVAC variable table in section 3.3.
For example, for a 150,000 Btu/hr water boiler meeting AFUE 90% in at an existing large office building in
unknown location:
ΔTherms = 1549 * 150,000 * ((0.90/0.84)-1) / 100,000
= 166.0 Therms
For example, for a 150,000 Btu/hr water boiler meeting AFUE 90% at an existing large office building in
unknown location:
ΔPeak Therms = 166.0 * 0.013082
= 2.1711 Therms
Filed with the Iowa Utilities Board on September 23, 2020, EEP-2018-0002

Iowa Energy Efficiency Statewide Technical Reference Manual –3.3.1 Boiler
Vol.3 Nonresidential Measures July 22, 2020 FINAL Page 89 of 410
WATER IMPACT DESCRIPTIONS AND CALCULATION
N/A
DEEMED O&M COST ADJUSTMENT CALCULATION
N/A
MEASURE CODE: NR-HVC-BOIL-V04-210101
SUNSET DATE: 1/1/2023
Filed with the Iowa Utilities Board on September 23, 2020, EEP-2018-0002

Iowa Energy Efficiency Statewide Technical Reference Manual –3.3.2 Furnace
Vol.3 Nonresidential Measures July 22, 2020 FINAL Page 90 of 410
3.3.2. Furnace
DESCRIPTION
This measure covers the installation of a high efficiency gas furnace in a nonresidential or multifamily application.
High efficiency condensing gas furnaces achieve savings through the utilization of a sealed, super insulated
combustion chamber, more efficient burners, and multiple heat exchangers that remove a significant portion of the
waste heat from the flue gasses. Because multiple heat exchangers are used to remove waste heat from the escaping
flue gasses, most of the flue gasses condense and must be drained. Furnaces equipped with ECM fan motors can
save additional electric energy. ECM furnace fan is a separate measure.
This measure was developed to be applicable to the following program types: TOS, NC.
If applied to other program types, the measure savings should be verified.
DEFINITION OF EFFICIENT EQUIPMENT
To qualify for this measure the installed equipment must be a condensing furnace with input energy <225,000 Btu/hr
rated natural gas fired furnace with an Annual Fuel Utilization Efficiency (AFUE) rating that meets the minimum
standards according to utility program requirements.
DEFINITION OF BASELINE EQUIPMENT
The baseline for this measure is a non-condensing furnace with input energy <225,000 Btu/hr rated natural gas fired
furnace with an Annual Fuel Utilization Efficiency (AFUE) rating of 85%.
204
DEFINITION OF MEASURE LIFE
The expected equipment measure life is assumed to be 18 years.
205
DEEMED MEASURE COST
The incremental capital cost for this measure depends on efficiency as listed below:
206
AFUE
Full Install
Cost
Incremental
Install Cost
85%
$4,030
N/A
86%
$4,086
$56
87%
$4,143
$113
88%
$4,199
$169
89%
$4,256
$226
90%
$4,312
$282
91%
$4,369
$339
92%
$4,425
$395
93%
$4,482
$452
94%
$4,538
$508
204
The Federal Standard of 80% (Code of Federal Regulations, 10 CFR 430.32(e)(2)) is inflated to 85% for Furnaces to account
for significant market demand above the Federal minimum. This is based upon agreement of the Technical Advisory
Committee, reviewing information from other jurisdictions and in lieu of Iowa specific information.
205
Based on ‘ASHRAE Equipment Life Expectancy chart’.
206
Based on data provided in Federal Appliance Standards, Chapter 8.2 of DOE Technical Support Documents, Table 8.2.11
Average Total Installed Cost for Residential Furnaces for Non-weatherized Gas Furnaces, updated February 10, 2015. These
costs have been inflated from 2013 to 2018 costs by applying a cumulative cost of inflation of 5.1%. Where efficiency ratings
are not provided, the values are interpolated from those that are and market with an *. See “Furnace_DOE Chapter
8_02102015.xls” for more information.
Filed with the Iowa Utilities Board on September 23, 2020, EEP-2018-0002
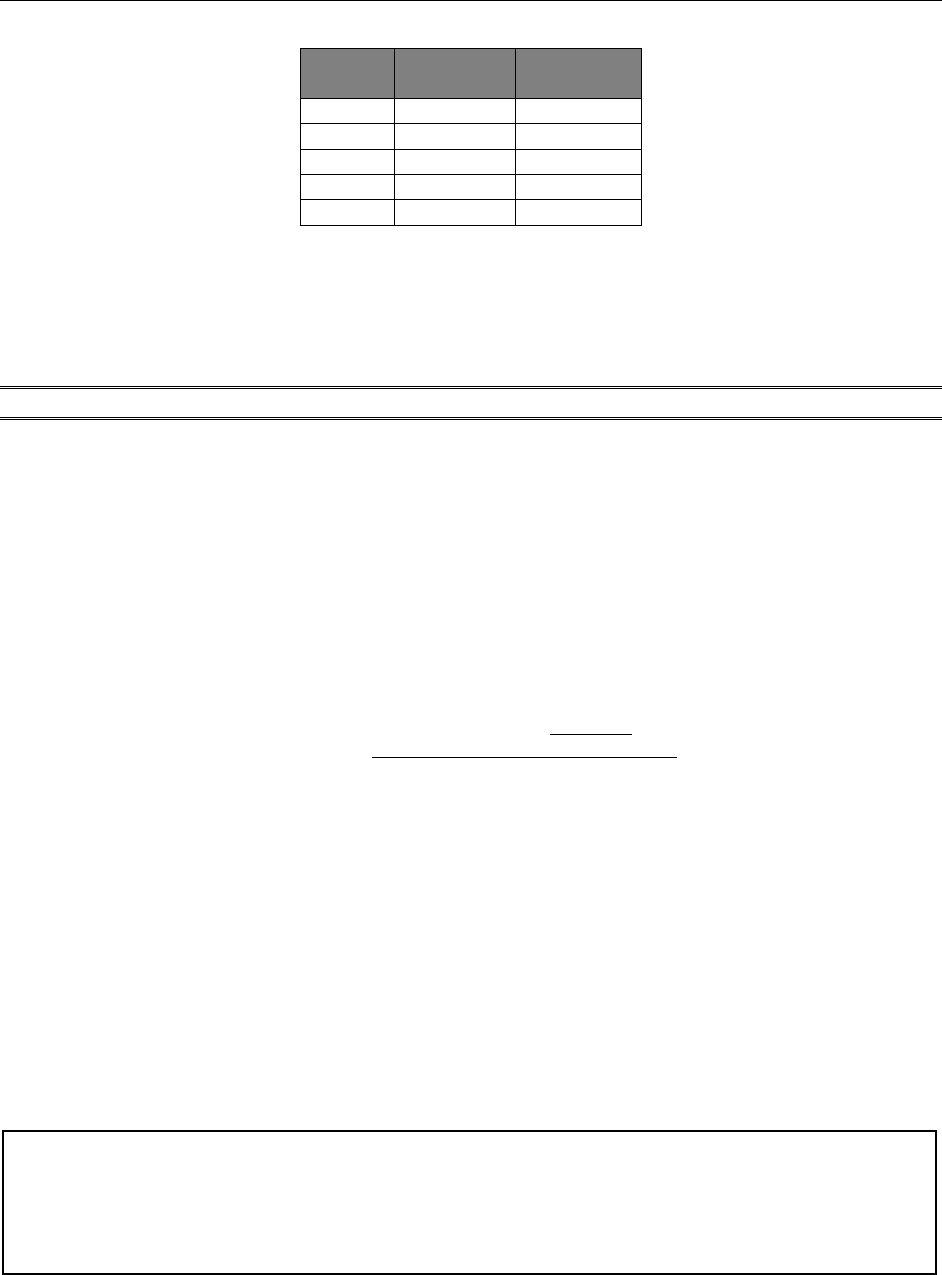
Iowa Energy Efficiency Statewide Technical Reference Manual –3.3.2 Furnace
Vol.3 Nonresidential Measures July 22, 2020 FINAL Page 91 of 410
AFUE
Full Install
Cost
Incremental
Install Cost
95%
$4,595
$565
96%
$4,888
$858
97%
$5,181
$1,151
98%
$5,474
$1,444
99%
$5,768
$1,738
Actual costs may be used if associated baseline costs can also be estimated for the application.
LOADSHAPE
Loadshape NRGH01:16 – Nonresidential Gas Heating (by Building Type)
Algorithm
CALCULATION OF SAVINGS
ELECTRIC ENERGY SAVINGS
N/A
SUMMER COINCIDENT PEAK DEMAND SAVINGS
N/A
NATURAL GAS ENERGY SAVINGS
Where:
EFLH = Equivalent Full Load Hours for heating are provided in section 3.3 HVAC End Use
Capacity = Nominal Heating Input Capacity Furnace Size (Btu/hr) for efficient unit, not existing unit
= Actual
AFUE
eff
= Annual Fuel Utilization Efficiency Rating (AFUE) of Energy Efficient equipment.
= Actual
AFUE
base
= Annual Fuel Utilization Efficiency Rating (AFUE) of Baseline equipment
= 85%
100,000 = Conversion of Btu to Therms
For example, for a 150,000 Btu/hr 92% efficient furnace installed at an existing small office building in
unknown location:
ΔTherms = (1358 * 150,000 * (0.92/0.85 – 1)) / 100,000
= 167.8 Therms
Filed with the Iowa Utilities Board on September 23, 2020, EEP-2018-0002

Iowa Energy Efficiency Statewide Technical Reference Manual –3.3.2 Furnace
Vol.3 Nonresidential Measures July 22, 2020 FINAL Page 92 of 410
PEAK GAS SAVINGS
Where:
ΔTherms = Therm impact calculated above
GCF = Gas Coincidence Factor for Heating
Building Type
GCF
207
Model Source
Convenience
0.016482
eQuest
Education
0.011480
OpenStudio
Grocery
0.013083
OpenStudio
Health
0.010179
OpenStudio
Hospital
0.015543
OpenStudio
Industrial
0.014296
eQuest
Lodging
0.013205
OpenStudio
Multifamily
0.012268
OpenStudio
Office - Large
0.013082
OpenStudio
Office - Small
0.016718
OpenStudio
Religious
0.011964
eQuest
Restaurant
0.015262
OpenStudio
Retail - Large
0.013281
eQuest
Retail - Small
0.014055
OpenStudio
Warehouse
0.015677
eQuest
Nonresidential Average
208
0.014658
N/A
WATER IMPACT DESCRIPTIONS AND CALCULATION
N/A
DEEMED O&M COST ADJUSTMENT CALCULATION
N/A
MEASURE CODE: NR-HVC-FRNC-V04-200101
SUNSET DATE: 1/1/2022
207
Calculated as the percentage of total savings in the maximum saving day, from models.
208
For weighting factors see HVAC variable table in section 3.3.
For example, for a 150,000 Btu/hr 92% efficient furnace installed stallation at an existing small office building
in unknown location:
ΔPeakTherms = 167.8 * 0.0167180
= 2.8053 Therms
Filed with the Iowa Utilities Board on September 23, 2020, EEP-2018-0002

Iowa Energy Efficiency Statewide Technical Reference Manual –3.3.3 Furnace Blower Motor
Vol.3 Nonresidential Measures July 22, 2020 FINAL Page 93 of 410
3.3.3. Furnace Blower Motor
DESCRIPTION
A furnace is purchased, or retrofitted, with a brushless permanent magnet (BPM) blower motor installed instead of
one with a lower efficiency motor. This measure characterizes only the electric savings associated with the fan during
the heating season. Savings decrease sharply with static pressure so duct improvements, and clean, low pressure
drop filters can maximize savings. Savings improve when the blower is used for cooling as well and when it is used
for continuous ventilation, but only if the non-BPM motor would have been used for continuous ventilation too. If
the customer runs the BPM blower continuously because it is a more efficient motor and would not run a non-BPM
motor that way, savings are near zero and possibly negative.
This measure was developed to be applicable to the following program types: TOS, RF, NC.
If applied to other program types, the measure savings should be verified.
DEFINITION OF EFFICIENT EQUIPMENT
A furnace with a brushless permanent magnet (BPM) blower motor, also known by the trademark ECM, BLDC, and
other names.
DEFINITION OF BASELINE EQUIPMENT
A furnace with a non-BPM blower motor. NOTE: Code of Federal Regulations applying to furnaces having a heat
input rate of less than 225,000 Btu/hr and meeting definitions of the Residential Product Class effectively prohibits
the manufacture of equipment utilizing non-BPM motors on and after July 3, 2019. By January 1, 2020 it shall be
assumed that all equipment available for sale conforms to this regulation and therefore ineligible to claim savings
for this measure. Given that the expected market for this measure could potentially rely on the Residential Product
Class of furnaces for heating, care should be taken to ensure savings are claimed only for eligible equipment, i.e.,
furnaces that fall into the Commercial Product Class.
DEEMED LIFETIME OF EFFICIENT EQUIPMENT
Measure life is deemed to be the remaining useful life of the furnace, as calculated by 20 years
209
minus furnace
age.
DEEMED MEASURE COST
If this measure is coupled with 3.3.2 Furnace, the cost of the efficient fan is assumed to be included in the cost of
the furnace and can therefore be taken as $0. As a stand-alone measure, cost is calculated as follows:
For TOS and NC projects, the incremental cost is calculated as follows:
Cost = $0.29 * Watts +$36.5
210
Where:
Watts = Nominal wattage of the efficient motor
For retrofit applications, the actual cost of labor plus materials should be used for screening purposes.
209
Consistent with assumed life of a new gas furnace. Table 8.3.3 The Technical support documents for federal residential
appliance standards: http://www1.eere.energy.gov/buildings/appliance_standards/residential/pdfs/fb_fr_tsd/chapter_8.pdf
210
Incremental costs established by comparing prices as listed on grainger.com 10/25/2015. See “ECM costs.xlsx” for complete
analysis methodology.
Filed with the Iowa Utilities Board on September 23, 2020, EEP-2018-0002

Iowa Energy Efficiency Statewide Technical Reference Manual –3.3.3 Furnace Blower Motor
Vol.3 Nonresidential Measures July 22, 2020 FINAL Page 94 of 410
LOADSHAPE
Loadshape NREH01:16 - Nonresidential Electric Heat (by Building Type)
Algorithm
CALCULATION OF ENERGY SAVINGS
ELECTRIC ENERGY SAVINGS
Where:
HP = Nominal horsepower of efficient motor
= Actual
0.746 = converts HP to kW
LF
base
= Load Factor of baseline motor at fan design CFM
= 65%
211
Hours = Annual motor operating hours
= 4000
212
SF = Savings factor
= 0.2
213
η
basemotor
= Efficiency rating of the baseline motor
= 0.85
214
SUMMER COINCIDENT PEAK DEMAND SAVINGS
There are no expected summer coincident peak demand savings for this measure.
NATURAL GAS SAVINGS
N/A
211
Lawrence Berkeley National Laboratory, and Resource Dynamics Corporation. (2008). “Improving Motor and Drive System
Performance; A Sourcebook for Industry”. U.S. Department of Energy, Office of Energy Efficiency and Renewable Energy,
Golden, CO: National Renewable Energy Laboratory.
212
Total number of hours furnaces are expected to be operating during the heating season. Considered a conservative
estimate, based on modeling results for Small Offices, Religious, Warehouse, Small Retail and Restaurants, which cumulatively
represent the majority of expected market.
213
Based on analysis of the complete dataset in the AHRI Residential Furnaces directly, which contains over 10,000 product
testing results. Analysis outlined in “AHRI res furnaces” shows that furnaces equipped with ECM motors consistently consumed
about half the annual auxiliary energy compared to furnaces equipped with non-ECM motors of similar size. Considering C&I
motors will typically be larger and therefore have higher baseline efficiencies, this savings factor is estimated to be .2 for C&I
applications.
214
Engineering judgment and considered a conservative estimate, based on the NEMA Premium Efficiencies for 1 HP motors,
the highest class of which is 85.5% efficient. Many ECM motors and their baseline counterparts have fractional horsepower
ratings, which will have even lower efficiencies.
Filed with the Iowa Utilities Board on September 23, 2020, EEP-2018-0002

Iowa Energy Efficiency Statewide Technical Reference Manual –3.3.3 Furnace Blower Motor
Vol.3 Nonresidential Measures July 22, 2020 FINAL Page 95 of 410
PEAK GAS SAVINGS
N/A
WATER IMPACT DESCRIPTIONS AND CALCULATION
N/A
DEEMED O&M COST ADJUSTMENT CALCULATION
N/A
MEASURE CODE: NR-HVC-FBLM-V03-200101
SUNSET DATE: 1/1/2023
Filed with the Iowa Utilities Board on September 23, 2020, EEP-2018-0002

Iowa Energy Efficiency Statewide Technical Reference Manual –3.3.4 Heat Pump Systems
Vol.3 Nonresidential Measures July 22, 2020 FINAL Page 96 of 410
3.3.4. Heat Pump Systems
DESCRIPTION
This measure applies to the installation of high-efficiency air cooled and water source heat pump systems. This
measure could apply to replacing an existing unit at the end of its useful life, or installation of a new unit in a new or
existing building
This measure was developed to be applicable to the following program types: TOS, NC. If applied to other program
types, the measure savings should be verified.
DEFINITION OF EFFICIENT EQUIPMENT
In order for this characterization to apply, the efficient equipment is assumed to be a high-efficiency air cooled,
water source, ground water source, or ground source heat pump system that exceeds the energy efficiency
requirements set forth by the Code of Federal Regulations and the International Energy Conservation Code (IECC)
2012.
DEFINITION OF BASELINE EQUIPMENT
In order for this characterization to apply, the baseline equipment is assumed to be a standard-efficiency air cooled,
or water source that meets the energy efficiency requirements set forth by the Code of Federal Regulations and the
International Energy Conservation Code (IECC) 2012. The rating conditions for the baseline and efficient equipment
efficiencies must be equivalent.
DEEMED LIFETIME OF EFFICIENT EQUIPMENT
The expected measure life is assumed to be 15 years.
215
DEEMED MEASURE COST
For analysis purposes, the incremental capital cost for air-cooled units is assumed to be $467.99 per ton for up to
and including CEE Tier 1 class products,
216
and $935.98 per ton for CEE Tier 2 and higher class products.
217
The
incremental cost for all other equipment types should be determined on a site-specific basis.
LOADSHAPE
Loadshape NREP01:16 - Nonresidential Electric Heat Pump (by Building Type)
Algorithm
CALCULATION OF SAVINGS
Note: The Code of Federal Regulations mandates that manufacturers comply with minimum efficiency standards for
certain types of heat pump equipment. Due to the fact that all equipment available for purchase must comply with
this regulation, the Code of Federal Regulation shall be taken as the principle authoritative source for specification
of baseline efficiency where applicable. Only in instances where equipment types or efficiency values are not
specified by the Code of Federal Regulations shall they be sourced from IECC 2012.
ELECTRIC ENERGY SAVINGS
215
Measure Life Report: Residential and Commercial/Industrial Lighting and HVAC Measures, GDS Associates, Inc., June 2007.
216
For specification details see; https://library.cee1.org/content/cee-commercial-unitary-ac-and-hp-specification-0
217
NEEP Incremental Cost Study (ICS) Final Report – Phase 3, May 2014.
Filed with the Iowa Utilities Board on September 23, 2020, EEP-2018-0002

Iowa Energy Efficiency Statewide Technical Reference Manual –3.3.4 Heat Pump Systems
Vol.3 Nonresidential Measures July 22, 2020 FINAL Page 97 of 410
For units with cooling capacities less than 65 kBtu/hr:
Where:
EFLH
cool
= Equivalent Full Load Hours for cooling are provided in section 3.3 HVAC End Use.
Capacity
Cool
= Cooling Capacity of Air Source Heat Pump (Btu/hr)
= Actual (where 1 ton = 12,000Btu/hr)
SEER
base
=Seasonal Energy Efficiency Ratio of the baseline equipment; see table below for
values.
218
SEER
ee
= Seasonal Energy Efficiency Ratio of the energy efficient equipment.
= Actual installed
EFLH
heat
= heating mode equivalent full load hours are provided in section 3.3 HVAC End Use.
Capacity
Heat
= Heating Capacity of Air Source Heat Pump (Btu/hr)
= Actual (where 1 ton = 12,000Btu/hr)
HSPF
base
= Heating Seasonal Performance Factor of the baseline equipment; see table below for
values.
HSPF
ee
= Heating Seasonal Performance Factor of the energy efficient equipment.
= Actual installed
For units with cooling capacities equal to or greater than 65 kBtu/hr and all water source units:
Where:
E
base
= Baseline equipment efficiency. Use Integrated Energy Efficiency Ratio (IEER), except in
instances of water source units, where Energy Efficiency Ratio (EER) shall be used; see the
table below for values.
E
ee
= Efficient equipment efficiency.
= Actual installed. Use Integrated Energy Efficiency Ratio (IEER), except in instances of
water source units, where Energy Efficiency Ratio (EER) shall be used.
3,412 = kBtu per kWh.
COP
base
= coefficient of performance of the baseline equipment; see table below for values.
COP
ee
= coefficient of performance of the energy efficient equipment.
218
Code of Federal Regulations and International Energy Conservation Code (IECC) 2012
Filed with the Iowa Utilities Board on September 23, 2020, EEP-2018-0002

Iowa Energy Efficiency Statewide Technical Reference Manual –3.3.4 Heat Pump Systems
Vol.3 Nonresidential Measures July 22, 2020 FINAL Page 98 of 410
= Actual installed
All other variables as defined above.
Reminder: IECC 2010 shall only source minimum efficiency requirements when not specified by the Code of
Federal Regulations.
Code of Federal Regulations: Table 3 to §431.97—Updates to the Minimum Cooling Efficiency Standards for Air
Conditioning and Heating Equipment and Table 4 to §431.97—Updates to the Minimum Heating Efficiency
Standards for Air-Cooled Air Conditioning and Heating Equipment [Heat Pumps]
Equipment type
Cooling capacity
Heating type
Cooling
Efficiency
level
Heating
Efficiency
level
Compliance
date
Small Commercial Packaged Air
Conditioning and Heating
Equipment (Air-Cooled)
≥65,000 Btu/h
and <135,000
Btu/h
Electric Resistance
Heating or No Heating
IEER = 12.2
N/A
1/1/2018
All Other Types of
Heating
IEER = 12.0
COP = 3.3
1/1/2018
Large Commercial Packaged Air
Conditioning and Heating
Equipment (Air-Cooled)
≥135,000 Btu/h
and <240,000
Btu/h
Electric Resistance
Heating or No Heating
IEER = 11.6
N/A
1/1/2018
All Other Types of
Heating
IEER = 11.4
COP = 3.2
1/1/2018
Very Large Commercial
Packaged Air Conditioning and
Heating Equipment (Air-
Cooled)
≥240,000 Btu/h
and <760,000
Btu/h
Electric Resistance
Heating or No Heating
IEER = 10.6
N/A
1/1/2018
All Other Types of
Heating
IEER = 10.4
COP = 3.2
1/1/2018
Small Commercial Package Air-
Conditioning and Heating
Equipment (Air-Cooled, 3-
Phase, Split-System)
<65,000 Btu/h
All
SEER = 14.0
HSPF = 8.2
1/1/2017
Small Commercial Package Air-
Conditioning and Heating
Equipment (Air-Cooled, 3-
Phase, Single-Package)
<65,000Btu/h
All
SEER = 14.0
HSPF = 8.0
1/1/2017
Small Commercial Packaged
Air-Conditioning and Heating
Equipment (Water Source:
Water-to-Air, Water-Loop)
<17,000 Btu/h
All
EER = 12.2
COP = 4.3
10/9/2015
≥17,000 Btu/h
and <65,000
Btu/h
All
EER = 13.0
COP = 4.3
10/9/2015
≥65,000 Btu/h
and
<135,000Btu/h
All
EER = 13.0
COP = 4.3
10/9/2015
Filed with the Iowa Utilities Board on September 23, 2020, EEP-2018-0002

Iowa Energy Efficiency Statewide Technical Reference Manual –3.3.4 Heat Pump Systems
Vol.3 Nonresidential Measures July 22, 2020 FINAL Page 99 of 410
IECC 2012 Specifications:
Filed with the Iowa Utilities Board on September 23, 2020, EEP-2018-0002

Iowa Energy Efficiency Statewide Technical Reference Manual –3.3.4 Heat Pump Systems
Vol.3 Nonresidential Measures July 22, 2020 FINAL Page 100 of 410
SUMMER COINCIDENT PEAK DEMAND SAVINGS
Where:
Capacity
Cool
= Cooling Capacity of Air Source Heat Pump (Btu/hr)
= Actual (where 1 ton = 12,000Btu/hr)
EER
base
= Energy Efficiency Ratio of the baseline equipment; see the tables above for values. Since
EER requirements for air-cooled heat pumps < 65 kBtu/hr are not specified, assume the
following conversion from SEER to EER: EER = -0.02 x SEER
2
+ 1.12 x SEER.
EER
ee
= Energy Efficiency Ratio of the energy efficient equipment. For air-cooled air conditioners
< 65 kBtu/hr, if the actual EERee is unknown, assume the following conversion from SEER
to EER: EER = –0.02 × SEER² + 1.12 × SEER.
CF = Summer System Peak Coincidence Factor for Cooling (dependent on building type)
For example, a single package 5 ton cooling unit at an existing restaurant in unknown location with 60,000
Btu/h heating capacity with a SEER of 15 and an HSPF of 9 saves
= [(60,000) * [(1/14) – (1/15)] * 1249] + [(60,000) * [(1/8) – (1/9)] * 1173]/1000
= 1334 kWh
Filed with the Iowa Utilities Board on September 23, 2020, EEP-2018-0002

Iowa Energy Efficiency Statewide Technical Reference Manual –3.3.4 Heat Pump Systems
Vol.3 Nonresidential Measures July 22, 2020 FINAL Page 101 of 410
Building Type
CF
219
Model Source
Convenience
92.3%
eQuest
Education
96.7%
OpenStudio
Grocery
100.0%
OpenStudio
Health
100.0%
OpenStudio
Hospital
98.6%
OpenStudio
Industrial
44.6%
eQuest
Lodging
97.4%
OpenStudio
Multifamily
100.0%
OpenStudio
Office - Large
98.8%
OpenStudio
Office - Small
100.0%
OpenStudio
Religious
94.3%
eQuest
Restaurant
99.6%
OpenStudio
Retail - Large
87.6%
eQuest
Retail - Small
100.0%
OpenStudio
Warehouse
77.9%
eQuest
Nonresidential Average
220
92.3%
N/A
NATURAL GAS ENERGY SAVINGS
N/A
WATER IMPACT DESCRIPTIONS AND CALCULATION
N/A
DEEMED O&M COST ADJUSTMENT CALCULATION
N/A
MEASURE CODE: NR-HVC-HPSY-V03-200101
SUNSET DATE: 1/1/2022
219
This calculation is the total savings in peak hour demand divided by the total savings in absolute peak demand.
220
For weighting factors, see HVAC variable table in section 3.3.
For example a 5 ton cooling unit at an existing restaurant in unknown location with 60,000 Btu/h heating
capacity with an EER of 14 and an HSPF of 9 saves
ΔkW = [(60,000) * [(1/11.76) – (1/12.3)]/1000 *.996
= 0.22 kW
Filed with the Iowa Utilities Board on September 23, 2020, EEP-2018-0002

Iowa Energy Efficiency Statewide Technical Reference Manual –3.3.5 Geothermal Source Heat Pump
Vol.3 Nonresidential Measures July 22, 2020 FINAL Page 102 of 410
3.3.5. Geothermal Source Heat Pump
DESCRIPTION
This measure characterizes the installation of an ENERGY STAR qualified Geothermal Source Heat Pump (GSHP)
either during new construction or at Time of Sale/Replacement of an existing system(s). The baseline is always
assumed to be a new baseline Air Source Heat Pump. Savings are calculated due to the GSHP providing heating and
cooling more efficiently than a baseline ASHP.
This measure was developed to be applicable to the following program types: TOS, NC.
If applied to other program types, the measure savings should be verified.
DEFINITION OF EFFICIENT EQUIPMENT
In order for this characterization to apply, the efficient equipment must be a Geothermal Source Heat Pump unit
meeting the minimum ENERGY STAR efficiency level standards effective at the time of installation as detailed below:
ENERGY STAR Requirements (Effective January 1, 2012)
Product Type
Cooling EER
Heating COP
Water-to-air
Closed Loop
17.1
3.6
Open Loop
21.1
4.1
Water-to-Water
Closed Loop
16.1
3.1
Open Loop
20.1
3.5
DGX
16
3.6
DEFINITION OF BASELINE EQUIPMENT
The baseline equipment is assumed to be a commercially rated Air Source Heat Pump meeting the energy efficiency
requirements set forth by the Code of Federal Regulations and the International Energy Conservation Code (IECC)
2012.
221
Code of Federal Regulations: Table 3 to §431.97—Updates to the Minimum Cooling Efficiency Standards for Air
Conditioning and Heating Equipment and Table 4 to §431.97—Updates to the Minimum Heating Efficiency
Standards for Air-Cooled Air Conditioning and Heating Equipment [Heat Pumps]
222
Equipment type
Cooling capacity
Heating type
Cooling
Efficiency
level
Heating
Efficiency
level
Compliance
date
Small Commercial Package Air-
Conditioning and Heating
Equipment (Air-Cooled, 3-
<65,000 Btu/h
All
SEER = 14.0
EER = 11.8
HSPF = 8.2
1/1/2017
221
The Federal Standard does not include an EER requirement, so it is approximated with this formula: (-0.02 * SEER
2
) + (1.12 *
SEER) Wassmer, M. (2003). A Component-Based Model for Residential Air Conditioner and Heat Pump Energy Calculations.
Masters Thesis, University of Colorado at Boulder. Equivalent EER is also approximated with this formula: EER = IEER/F where F
is based on a relationship between EER and IEER in ASHRAE 90.1 2010 Table 6.8.1A (approximately 1.018 for units 65,000 to
240,000 Btu/h and 1.01 for units 240,000 to 760,000 Btu/h).
222
The new compliance standards set by the Code of Federal Regulations for commercial air source heat pumps are more
aggressive and have a higher minimum cooling and heating efficiency requirements as compared to IECC 2012. In this instance,
federal standards supersede state code conservation requirements and the baseline equipment is defined as an air source heat
pumping meeting the minimum qualifying criteria as detailed in the Code of Federal Regulations.
Filed with the Iowa Utilities Board on September 23, 2020, EEP-2018-0002

Iowa Energy Efficiency Statewide Technical Reference Manual –3.3.5 Geothermal Source Heat Pump
Vol.3 Nonresidential Measures July 22, 2020 FINAL Page 103 of 410
Equipment type
Cooling capacity
Heating type
Cooling
Efficiency
level
Heating
Efficiency
level
Compliance
date
Phase, Split-System)
Small Commercial Package Air-
Conditioning and Heating
Equipment (Air-Cooled, 3-
Phase, Single-Package)
<65,000Btu/h
All
SEER = 14.0
EER = 11.8
HSPF = 8.0
1/1/2017
Small Commercial Packaged Air
Conditioning and Heating
Equipment (Air-Cooled)
≥65,000 Btu/h
and <135,000
Btu/h
Electric Resistance
Heating or No Heating
IEER = 12.2
EER = 12.0
N/A
1/1/2018
All Other Types of
Heating
IEER = 12.0
EER = 11.8
COP = 3.3
1/1/2018
Large Commercial Packaged Air
Conditioning and Heating
Equipment (Air-Cooled)
≥135,000 Btu/h
and <240,000
Btu/h
Electric Resistance
Heating or No Heating
IEER = 11.6
EER = 11.4
N/A
1/1/2018
All Other Types of
Heating
IEER = 11.4
EER = 11.2
COP = 3.2
1/1/2018
Very Large Commercial
Packaged Air Conditioning and
Heating Equipment (Air-
Cooled)
≥240,000 Btu/h
and <760,000
Btu/h
Electric Resistance
Heating or No Heating
IEER = 10.6
EER = 10.5
N/A
1/1/2018
All Other Types of
Heating
IEER = 10.4
EER = 10.3
COP = 3.2
1/1/2018
DEEMED LIFETIME OF EFFICIENT EQUIPMENT
The expected equipment measure life for Time of Sale or New Construction is assumed to be 25 years.
223
DEEMED MEASURE COST
The actual installed cost of the Geothermal Source Heat Pump should be used (default of $4,081per ton)
224
, minus
the assumed installation cost of the baseline equipment ($1,867 per ton for ASHP).
225
LOADSHAPE
Loadshape NREP01:16 - Nonresidential Electric Heat Pump (by Building Type)
Algorithm
CALCULATION OF SAVINGS
ELECTRIC ENERGY SAVINGS
223
System life of indoor components as per U.S. Department of Energy (DOE) estimates from the Office of Energy Efficiency &
Renewable Energy, Energy Saver Articles on Heat Pump Systems – Geothermal Heat Pumps. The ground loop has a much longer
life, but the compressor and other mechanical components are the same as an ASHP (based on Measure Life Report,
Residential and Commercial/Industrial Lighting and HVAC Measures, GDS Associates, June 2007).
224
Based on data provided on Home Advisor website, providing national average GSHP costs based on actual project quotes
from 132 Home Advisor members and contractors. Equipment and material cost of $2,581 per ton plus an added $1,500 per
ton installation cost (assuming vertical looping).
225
Based on data provided on Home Advisor website, providing national average ASHP costs based on actual project quotes
from 3,523 Home Advisor members and contractors.
Filed with the Iowa Utilities Board on September 23, 2020, EEP-2018-0002

Iowa Energy Efficiency Statewide Technical Reference Manual –3.3.5 Geothermal Source Heat Pump
Vol.3 Nonresidential Measures July 22, 2020 FINAL Page 104 of 410
Where:
EFLH
Cool
= Equivalent Full Load Hours for cooling are provided in section 3.3 HVAC End Use
Capacity
Cool
= Cooling Capacity of Geothermal Source Heat Pump (Btu/hr)
= Actual (1 ton = 12,000 Btu/hr)
PLF
Cool
= Part load cooling mode operation
= 0.85 if variable speed GSHP
226
= 0 if single/constant speed GSHP
FLF
Cool
= Full load cooling mode operation factor
= 0.15 if variable speed GSHP
= 1 if single/constant speed GSHP
EER
Base
= Energy Efficiency Ratio (EER) of the baseline equipment (new ASHP unit); use minimum
standard efficiencies as specified in the table in ‘Definition of Baseline Equipment’
section
227
EER
EE -
PL
= Part Load EER Efficiency of efficient GSHP unit
= Actual installed with adjustment for pumping energy:
228
Adjusted EER (closed loop) = 0.0000315*EER^3 - 0.0111*EER^2 + 0.959*EER
Adjusted EER (open loop) = 0.00005*EER^3 - 0.0145*EER^2 + 0.93*EER
EER
EE -
FL
= Full Load EER Efficiency of ENERGY STAR GSHP unit
= Actual installed with adjustment for pumping energy described above
EFLH
Heat
= Equivalent Full Load Hours for heating are provided in section 3.3 HVAC End Use
Capacity
Heat
= Full Load Heating Capacity of Geothermal Source Heat Pump (Btu/hr)
= Actual (1 ton = 12,000 Btu/hr)
PLF
Heat
= Part load heating mode operation
226
Based on Cadmus analysis of the relationship between part- and full-load capacities from building simulations of BEopt
(Building Energy Optimization) to generate the energy models. The models were calibrated using Cadmus metered data of 13
high efficiency multi-stage GSHP models functioning in both part- and full-loads.
227
The Federal Standard does not include an EER requirement, so it is approximated with the conversion formula from
Wassmer, M. (2003). A Component-Based Model for Residential Air Conditioner and Heat Pump Energy Calculations. Masters
Thesis, University of Colorado at Boulder. Equivalent EER is also approximated with this formula: EER = IEER/F where F is based
on a relationship between EER and IEER in ASHRAE 90.1 2010 Table 6.8.1A (approximately 1.018 for units 65,000 to 240,000
Btu/h and 1.01 for units 240,000 to 760,000 Btu/h).
228
The methodology provided is based upon REMRate protocol ‘Auxiliary Electric Energy of Ground Source Heat Pumps’;
http://www.resnet.us/standards/Auxiliary_Electric_Energy_of_Ground_Source_Heat_Pumps_Amendment.pdf
Filed with the Iowa Utilities Board on September 23, 2020, EEP-2018-0002

Iowa Energy Efficiency Statewide Technical Reference Manual –3.3.5 Geothermal Source Heat Pump
Vol.3 Nonresidential Measures July 22, 2020 FINAL Page 105 of 410
= 0.5 if variable speed GSHP
229
= 0 if single/constant speed GSHP
FLF
Heat
= Full load heating mode operation factor
= 0.5 if variable speed GSHP
= 1 if single/constant speed GSHP
HSPF
Base
= Heating System Performance Factor of new replacement baseline heating system
(kBtu/kWh); use minimum standard efficiencies as specified in the table in ‘Definition of
Baseline Equipment’ section
230
COP
EE -
PL
= Part Load Coefficient of Performance of efficient unit
= Actual Installed with adjustment for pumping energy:
231
Adjusted COP (closed loop) = 0.000416*COP^3 - 0.041*COP^2 + 1.0086*COP
Adjusted COP (open loop) = 0.00067*COP^3 - 0.0531*COP^2 + 0.976*COP
COP
EE -
FL
= Full Load Coefficient of Performance of efficient unit
= Actual Installed with adjustment for pumping energy described above
3.412 = Constant to convert the COP of the unit to the Heating Season Performance Factor
(HSPF).
229
Based on Cadmus analysis of the relationship between part- and full-load capacities from building simulations of BEopt
(Building Energy Optimization) to generate the energy models. The models were calibrated using Cadmus metered data of 13
high efficiency multi-stage GSHP models functioning in both part- and full-loads.
230
Federal standards detail heating efficiency in terms of coefficient of performance (COP). In order to convert HSPF to COP,
multiply by the constant, 3.412.
231
The methodology provided is based upon REMRate protocol ‘Auxiliary Electric Energy of Ground Source Heat Pumps’;
http://www.resnet.us/standards/Auxiliary_Electric_Energy_of_Ground_Source_Heat_Pumps_Amendment.pdf
For example, for a 5 ton closed loop GSHP unit with 24 Part Load EER, 18 Full Load EER and 4.2 Part Load
COP, 3.8 Full Load COP installed in an existing school in Burlington, IA.:
Adjusted Part Load EER = 0.0000315*24^3 - 0.0111*24^2 + 0.959*24
= 17.1
Adjusted Full Load EER = 0.0000315*18^3 - 0.0111*18^2 + 0.959*18
= 13.8
Adjusted Part Load COP = 0.000416*4.2^3 - 0.041*4.2^2 + 1.0086*4.2
= 4.2
Adjusted Full Load COP = 0.000416*3.8^3 - 0.041*3.8^2 + 1.0086*3.8
= 3.3
ΔkWh = (1,073 * 60,000 * ((0.85 * (1/(11.8 – 1/17.1)) + (0.15 * (1/(11.8 – 1/13.8)))) / 1,000 + (968
* 60,000 * ((0.5 * (1/8.2 – 1/(4.2 *3.412))) + (0.5 * (1/8.2 – 1/(3.3*3.412)))) / 1,000
= 1,556.0 + 3,312.8
= 4,868.8 kWh
Filed with the Iowa Utilities Board on September 23, 2020, EEP-2018-0002

Iowa Energy Efficiency Statewide Technical Reference Manual –3.3.5 Geothermal Source Heat Pump
Vol.3 Nonresidential Measures July 22, 2020 FINAL Page 106 of 410
SUMMER COINCIDENT PEAK DEMAND SAVINGS
Where:
EERbase = Energy Efficiency Ratio (EER) of the baseline equipment (new ASHP unit); use minimum
standard efficiencies as specified in the table in ‘Definition of Baseline Equipment’
section.
232
EER
FL
= Full Load EER Efficiency of ENERGY STAR GSHP unit
= Actual
CF = Summer System Peak Coincidence Factor for Cooling (dependent on building type)
Building Type
CF
233
Model Source
Convenience
92.3%
eQuest
Education
96.7%
OpenStudio
Grocery
100.0%
OpenStudio
Health
100.0%
OpenStudio
Hospital
98.6%
OpenStudio
Industrial
44.6%
eQuest
Lodging
97.4%
OpenStudio
Multifamily
100.0%
OpenStudio
Office - Large
98.8%
OpenStudio
Office - Small
100.0%
OpenStudio
Religious
94.3%
eQuest
Restaurant
99.6%
OpenStudio
Retail - Large
87.6%
eQuest
Retail - Small
100.0%
OpenStudio
Warehouse
77.9%
eQuest
Nonresidential Average
234
92.3%
N/A
232
The Federal Standard does not include an EER requirement, so it is approximated with the conversion formula from
Wassmer, M. (2003). A Component-Based Model for Residential Air Conditioner and Heat Pump Energy Calculations. Masters
Thesis, University of Colorado at Boulder. Equivalent EER is also approximated with this formula: EER = IEER/F where F is based
on a relationship between EER and IEER in ASHRAE 90.1 2010 Table 6.8.1A (approximately 1.018 for units 65,000 to 240,000
Btu/h and 1.01 for units 240,000 to 760,000 Btu/h).
233
This calculation is the total savings in peak hour demand divided by the total savings in absolute peak demand.
234
For weighting factors, see HVAC variable table in section 3.3.
Filed with the Iowa Utilities Board on September 23, 2020, EEP-2018-0002

Iowa Energy Efficiency Statewide Technical Reference Manual –3.3.5 Geothermal Source Heat Pump
Vol.3 Nonresidential Measures July 22, 2020 FINAL Page 107 of 410
NATURAL GAS SAVINGS
N/A
PEAK GAS SAVINGS
N/A
WATER IMPACT DESCRIPTIONS AND CALCULATION
N/A
DEEMED O&M COST ADJUSTMENT CALCULATION
N/A
MEASURE CODE: NR- HVAC-GSHP-V03-200101
SUNSET DATE: 1/1/2022
For example, for a 5 ton closed loop GSHP unit with 18 Full Load EER installed in an existing school in
Burlington, IA.:
Adjusted Full Load EER = 0.0000315*18^3 - 0.0111*18^2 + 0.959*18
= 13.8
ΔkW = (60,000 * (1/11.8 – 1/13.8) / 1,000) * 0.967
= 0.7127 kW
Filed with the Iowa Utilities Board on September 23, 2020, EEP-2018-0002

Iowa Energy Efficiency Statewide Technical Reference Manual –3.3.6 Single-Package and Split System Unitary Air
Conditioners
Vol.3 Nonresidential Measures July 22, 2020 FINAL Page 108 of 410
3.3.6. Single-Package and Split System Unitary Air Conditioners
DESCRIPTION
This measure promotes the installation of high-efficiency unitary air-, water-, and evaporatively cooled air
conditioning equipment, both single-package and split systems. Air conditioning (AC) systems are a major consumer
of electricity and systems that exceed baseline efficiencies can save considerable amounts of energy. This measure
could apply to the replacing of an existing unit at the end of its useful life or the installation of a new unit in a new
or existing building.
This measure was developed to be applicable to the following program types: TOS, NC. If applied to other program
types, the measure savings should be verified.
DEFINITION OF EFFICIENT EQUIPMENT
In order for this characterization to apply, the efficient equipment is assumed to be a high-efficiency air-, water-, or
evaporatively cooled air conditioner that exceeds the energy efficiency requirements set forth by the Code of Federal
Regulations and the International Energy Conservation Code (IECC) 2012.
DEFINITION OF BASELINE EQUIPMENT
In order for this characterization to apply, the baseline equipment is assumed to be a standard-efficiency air-, water,
or evaporatively cooled air conditioner that meets the energy efficiency requirements set forth by the Code of
Federal Regulations and the International Energy Conservation Code (IECC) 2012. The rating conditions for the
baseline and efficient equipment efficiencies must be equivalent.
DEEMED LIFETIME OF EFFICIENT EQUIPMENT
The expected measure life is assumed to be 15 years.
235
DEEMED MEASURE COST
The incremental capital cost for this measure is based upon capacity and efficiency level (defined be CEE
specifications),
236
as outlined in the following table:
237
Incremental cost ($/ton)
Capacity
Up to and including
CEE Tier 1 units
CEE Tier 2 and
above
< 135,000 Btu/hr
$63.42
$126.84
135,000 Btu/hr to > 250,000 Btu/hr
$63.42
$126.84
250,000 Btu/hr and greater
$18.92
$37.83
LOADSHAPE
Loadshape NREC01:16 - Nonresidential Cooling (by Building Type)
Algorithm
CALCULATION OF SAVINGS
Note: The Code of Federal Regulations mandates that manufacturers comply with minimum efficiency standards for
certain types of heat pump equipment. Due to the fact that all equipment available for purchase must comply with
235
Measure Life Report: Residential and Commercial/Industrial Lighting and HVAC Measures, GDS Associates, Inc., June 2007.
236
For specification details see; https://library.cee1.org/content/cee-commercial-unitary-ac-and-hp-specification-0
237
NEEP Incremental Cost Study (ICS) Final Report – Phase 3, May 2014.
Filed with the Iowa Utilities Board on September 23, 2020, EEP-2018-0002

Iowa Energy Efficiency Statewide Technical Reference Manual –3.3.6 Single-Package and Split System Unitary Air
Conditioners
Vol.3 Nonresidential Measures July 22, 2020 FINAL Page 109 of 410
this regulation, the Code of Federal Regulation shall be taken as the authoritative source for specification of baseline
efficiency in instances where IECC 2012 requires less aggressive efficiency standards.
ELECTRIC ENERGY SAVINGS
For units with cooling capacities less than 65 kBtu/hr:
For units with cooling capacities equal to or greater than 65 kBtu/hr:
Where:
Capacity
Cool
= Cooling Capacity of new equipment in Btu/hr (note 1 ton = 12,000Btu/hr)
= Actual installed
SEER
base
= Seasonal Energy Efficiency Ratio of baseline unit (kBtu/kWh); see table below for default
values
238
SEER
ee
= Seasonal Energy Efficiency Ratio of ENERGY STAR unit (kBtu/kWh)
= Actual installed
IEERbase = Integrated Energy Efficiency Ratio of baseline unit (kBtu/kWh); see table below for
default values
239
IEERee = Integrated Energy Efficiency Ratio of ENERGY STAR unit (kBtu/kWh)
= Actual installed
EFLH
cool
= Equivalent Full Load Hours for cooling are provided in section 3.3 HVAC End Use
Code of Federal Regulations: Table 3 to §431.97—Updates to the Minimum Cooling Efficiency Standards for Air
Conditioning and Heating Equipment
Equipment type
Cooling capacity
Heating type
Efficiency
level
Compliance
date
Small Commercial Packaged Air
Conditioning and Heating Equipment
(Air-Cooled)
≥65,000 Btu/h and
<135,000 Btu/h
Electric Resistance
Heating or No
Heating
IEER = 12.9
1/1/2018
All Other Types of
Heating
IEER = 12.7
1/1/2018
Large Commercial Packaged Air
Conditioning and Heating Equipment
(Air-Cooled)
≥135,000 Btu/h
and <240,000
Btu/h
Electric Resistance
Heating or No
Heating
IEER = 12.4
1/1/2018
All Other Types of
Heating
IEER = 12.2
1/1/2018
Very Large Commercial Packaged Air
≥240,000 Btu/h
Electric Resistance
IEER = 11.6
1/1/2018
238
Code of Federal Regulations and International Energy Conservation Code (IECC) 2012
239
Code of Federal Regulations and International Energy Conservation Code (IECC) 2012
Filed with the Iowa Utilities Board on September 23, 2020, EEP-2018-0002

Iowa Energy Efficiency Statewide Technical Reference Manual –3.3.6 Single-Package and Split System Unitary Air
Conditioners
Vol.3 Nonresidential Measures July 22, 2020 FINAL Page 110 of 410
Equipment type
Cooling capacity
Heating type
Efficiency
level
Compliance
date
Conditioning and Heating Equipment
(Air-Cooled)
and <760,000
Btu/h
Heating or No
Heating
All Other Types of
Heating
IEER = 11.4
1/1/2018
Small Commercial Package Air-
Conditioning and Heating Equipment
(Air-Cooled, 3-Phase, Split-System)
<65,000 Btu/h
All
SEER = 13.0
6/16/2008
Small Commercial Package Air-
Conditioning and Heating Equipment
(Air-Cooled, 3-Phase, Single-Package)
<65,000Btu/h
All
SEER = 14.0
1/1/2017
Filed with the Iowa Utilities Board on September 23, 2020, EEP-2018-0002

Iowa Energy Efficiency Statewide Technical Reference Manual –3.3.6 Single-Package and Split System Unitary Air
Conditioners
Vol.3 Nonresidential Measures July 22, 2020 FINAL Page 111 of 410
IECC 2012 Specifications:
Filed with the Iowa Utilities Board on September 23, 2020, EEP-2018-0002

Iowa Energy Efficiency Statewide Technical Reference Manual –3.3.6 Single-Package and Split System Unitary Air
Conditioners
Vol.3 Nonresidential Measures July 22, 2020 FINAL Page 112 of 410
SUMMER COINCIDENT PEAK DEMAND SAVINGS
Where:
EER
base
= Energy Efficiency Ratio of the baseline equipment; see table above for default values.
Since IECC 2012 does not provide EER requirements for air-cooled air conditioners < 65
kBtu/hr, assume the following conversion from SEER to EER: EER = –0.02 × SEER² + 1.12 ×
SEER
EER
ee
= Energy Efficiency Ratio of the energy efficient equipment. For air-cooled air conditioners
< 65 kBtu/hr, if the actual EERee is unknown, assume the following conversion from SEER
to EER: EER = –0.02 × SEER² + 1.12 × SEER
= Actual installed
For example, a 5 ton air cooled split system with a SEER of 15 at an existing small retail building in Burlington
would save
ΔkWH = (60,000) * [(1/13) – (1/15)] / 1000 * 891
= 548.3 kWh
Filed with the Iowa Utilities Board on September 23, 2020, EEP-2018-0002

Iowa Energy Efficiency Statewide Technical Reference Manual –3.3.6 Single-Package and Split System Unitary Air
Conditioners
Vol.3 Nonresidential Measures July 22, 2020 FINAL Page 113 of 410
CF = Summer System Peak Coincidence Factor for Cooling (dependent on building type)
Building Type
CF
240
Model Source
Convenience
92.3%
eQuest
Education
96.7%
OpenStudio
Grocery
100.0%
OpenStudio
Health
100.0%
OpenStudio
Hospital
98.6%
OpenStudio
Industrial
44.6%
eQuest
Lodging
97.4%
OpenStudio
Multifamily
100.0%
OpenStudio
Office - Large
98.8%
OpenStudio
Office - Small
100.0%
OpenStudio
Religious
94.3%
eQuest
Restaurant
99.6%
OpenStudio
Retail - Large
87.6%
eQuest
Retail - Small
100.0%
OpenStudio
Warehouse
77.9%
eQuest
Nonresidential Average
241
92.3%
N/A
NATURAL GAS ENERGY SAVINGS
N/A
WATER IMPACT DESCRIPTIONS AND CALCULATION
N/A
MEASURE CODE: NR-HVC-SPUA-V04-210101
SUNSET DATE: 1/1/2023
240
This calculation is the total savings in peak hour demand divided by the total savings in absolute peak demand.
241
For weighting factors, see HVAC variable table in section 3.3.
For example, a 5 ton air cooled split system with a SEER of 15 (EER unknown) at an existing small retail
building in Burlington would save:
EERbase = –0.02 × 13² + 1.12 × 13
= 11.2 EER
EERee = –0.02 × 15² + 1.12 × 15
= 12.3 EER
ΔkW = (60,000 * [(1/11.2) – (1/12.3)] / 1000 * 1.00
= 0.4791 kW
Filed with the Iowa Utilities Board on September 23, 2020, EEP-2018-0002

Iowa Energy Efficiency Statewide Technical Reference Manual –3.3.7 Electric Chiller
Vol.3 Nonresidential Measures July 22, 2020 FINAL Page 114 of 410
3.3.7. Electric Chiller
DESCRIPTION
This measure relates to the installation of a new electric chiller meeting the efficiency standards presented below.
This measure could relate to the replacement of an existing unit at the end of its useful life, or the installation of a
new system in an existing building (i.e. time of sale). Only single-chiller applications should be assessed with this
methodology. The characterization is not suited for multiple chillers projects or chillers equipped with variable speed
drives (VSDs).
This measure was developed to be applicable to the following program types: TOS, NC. If applied to other program
types, the measure savings should be verified.
DEFINITION OF EFFICIENT EQUIPMENT
In order for this characterization to apply, the efficient equipment is assumed to exceed the efficiency requirements
of the 2012 International Energy Conservation Code, Table 503.2.3(7)
DEFINITION OF BASELINE EQUIPMENT
In order for this characterization to apply, the baseline equipment is assumed to meet the efficiency requirements
of the 2012 International Energy Conservation Code, Table 503.2.3(7).
DEEMED LIFETIME OF EFFICIENT EQUIPMENT
The expected measure life is assumed to be 20 years.
242
DEEMED MEASURE COST
The incremental capital cost for this measure is provided below:
243
Air cooled, electrically operated ($/ton)
Capacity (tons)
< 9.9 EER
9.9 EER and
< 10.2 EER
10.2 EER and
< 10.52 EER
10.52 EER
and
greater
< 50
$137
$259
$350
$411
>= 50 and <100
$69
$129
$175
$206
>= 100 and <150
$46
$86
$117
$137
>= 150 and <200
$34
$65
$88
$103
>= 200
$17
$32
$44
$51
Water cooled, electrically operated, positive displacement (rotary screw and scroll) ($/ton)
Capacity (tons)
> .72 kW/ton
.72 and > .68
kW/ton
.68 and >.64
kW/ton
.64 kW/ton and less
< 50
$311
$518
N/A
N/A
>= 50 and <100
$143
$246
N/A
N/A
>= 100 and <150
N/A
N/A
N/A
N/A
242
2008 Database for Energy-Efficiency Resources (DEER), Version 2008.2.05, “Effective/Remaining Useful Life Values”,
California Public Utilities Commission, December 16, 2008 .
243
NEEP incremental cost update for Version 7 of the Mid-Atlantic TRM. Original data and analysis sourced from Itron. Measure
and baseline costs were calculated using hedonic models and data from Itron, 2010 –2012 WO017 Ex Ante Measure Cost Study,
conducted for the California Public Utility
Commission in 2014 and adjusted for inflation. See supporting document “NEEP Chiller Incremental
Cost_Recommendations_050917.xlsx”
Filed with the Iowa Utilities Board on September 23, 2020, EEP-2018-0002

Iowa Energy Efficiency Statewide Technical Reference Manual –3.3.7 Electric Chiller
Vol.3 Nonresidential Measures July 22, 2020 FINAL Page 115 of 410
Water cooled, electrically operated, positive displacement (rotary screw and scroll) ($/ton)
Capacity (tons)
> .72 kW/ton
.72 and > .68
kW/ton
.68 and >.64
kW/ton
.64 kW/ton and less
>= 150 and <200
N/A
N/A
$52
$104
>= 200
N/A
N/A
N/A
$13
Water cooled, electrically operated, positive displacement (reciprocating) ($/ton)
Capacity (tons)
> .60 kW/ton
.60 and > .58 kW/ton
.58 kw/ton and less
< 100
$88
$140
$244
>= 100 and <150
$59
$93
$162
>= 150 and <200
$44
$70
$122
>= 200 and <300
N/A
N/A
$31
>= 300
N/A
N/A
$13
LOADSHAPE
Loadshape NREC01:16 - Nonresidential Cooling (by Building Type)
Algorithm
CALCULATION OF SAVINGS
ELECTRIC ENERGY SAVINGS
Where:
TONS = chiller nominal cooling capacity in tons (note: 1 ton = 12,000 Btu/hr)
= Actual installed
IPLV
base
= efficiency of baseline equipment expressed as Integrated Part Load Value(kW/ton).
Chiller units are dependent on chiller type. See ‘Chiller Units, Convertion Values’ and
‘Baseline Efficiency Values by Chiller Type’ and Capacity in the Reference Tables section.
IPLV
ee
244
= efficiency of high efficiency equipment expressed as Integrated Part Load Value
(kW/ton)
245
= Actual installed
EFLH = Equivalent Full Load Hours for cooling are provided in section 3.3 HVAC End Use.
244
Integrated Part Load Value is a seasonal average efficiency rating calculated in accordance with ARI Standard 550/590. It
may be calculated using any measure of efficiency (EER, kW/ton, COP), but for consistency with IECC 2012, it is expressed in
terms of IPLV here.
245
Can determine IPLV from standard testing or looking at engineering specs for design conditions. Standard data is available
from AHRnetI.org. http://www.ahrinet.org/
For example, a 100 ton air-cooled electrically operated chiller in an existing warehouse with IPLV of 14 EER (0.86
kW/ton) and baseline EER of 12.5 (0.96 kW/ton) in unknown location would save:
ΔkWH = 100 * ((0.96) – (0.86)) * 864
= 8,640 kWh
Filed with the Iowa Utilities Board on September 23, 2020, EEP-2018-0002

Iowa Energy Efficiency Statewide Technical Reference Manual –3.3.7 Electric Chiller
Vol.3 Nonresidential Measures July 22, 2020 FINAL Page 116 of 410
SUMMER COINCIDENT PEAK DEMAND SAVINGS
Where:
PE
base
= Peak efficiency of baseline equipment expressed as Full Load (kW/ton)
= See “FULL LOAD” values from ‘Baseline Efficiency Values by Chiller Type and Capacity’
in Reference Tables section.
PE
ee
= Peak efficiency of high efficiency equipment expressed as Full Load (kW/ton)
= Actual installed
CF
= Summer System Peak Coincidence Factor for Cooling (dependent on building type)
Building Type
CF
246
Model Source
Convenience
92.3%
eQuest
Education
96.7%
OpenStudio
Grocery
100.0%
OpenStudio
Health
100.0%
OpenStudio
Hospital
98.6%
OpenStudio
Industrial
44.6%
eQuest
Lodging
97.4%
OpenStudio
Multifamily
100.0%
OpenStudio
Office - Large
98.8%
OpenStudio
Office - Small
100.0%
OpenStudio
Religious
94.3%
eQuest
Restaurant
99.6%
OpenStudio
Retail - Large
87.6%
eQuest
Retail - Small
100.0%
OpenStudio
Warehouse
77.9%
eQuest
Nonresidential Average
247
92.3%
N/A
NATURAL GAS ENERGY SAVINGS
N/A
PEAK GAS SAVINGS
N/A
WATER IMPACT DESCRIPTIONS AND CALCULATION
N/A
246
This calculation is the total savings in peak hour demand divided by the total savings in absolute peak demand.
247
For weighting factors, see HVAC variable table in section 3.3.
For example, a 100 ton air-cooled electrically operated chiller in an existing warehouse with a full load efficiency
of 12 EER (1 kW/ton) with baseline full load efficiency of 9.5 EER (1.26 kW/ton) in unknown location would save:
ΔkW = 100 * ((1.26) – (1.0)) * 0.779
= 20.25 kW
Filed with the Iowa Utilities Board on September 23, 2020, EEP-2018-0002

Iowa Energy Efficiency Statewide Technical Reference Manual –3.3.7 Electric Chiller
Vol.3 Nonresidential Measures July 22, 2020 FINAL Page 117 of 410
DEEMED O&M COST ADJUSTMENT CALCULATION
N/A
REFERENCE TABLES
Chillers Ratings - Chillers are rated with different units depending on equipment type as shown below.
Equipment Type
Unit
Air cooled, electrically operated
EER
Water cooled, electrically operated, positive
displacement (reciprocating)
kW/ton
Water cooled, electrically operated, positive
displacement (rotary screw and scroll)
kW/ton
In order to convert chiller equipment ratings to IPLV, the following relationships are provided:
kW/ton = 12 / EER
kW/ton = 12 / (COP x 3.412)
COP = EER / 3.412
COP = 12 / (kW/ton) / 3.412
EER = 12 / kW/ton
EER = COP x 3.412
Baseline Efficiency Values by Chiller Type and Capacity
248
Note: Efficiency requirements depend on the path (Path A or Path B) that the building owner has chosen to meet
compliance requirements. For air cooled and absorption chillers, Path A should be assumed. For water cooled
chillers, the building owner should be consulted and the relevant path used for calculations. When unknown, Path
A should be used.
248
International Energy Conservation Code (IECC)2012
Filed with the Iowa Utilities Board on September 23, 2020, EEP-2018-0002
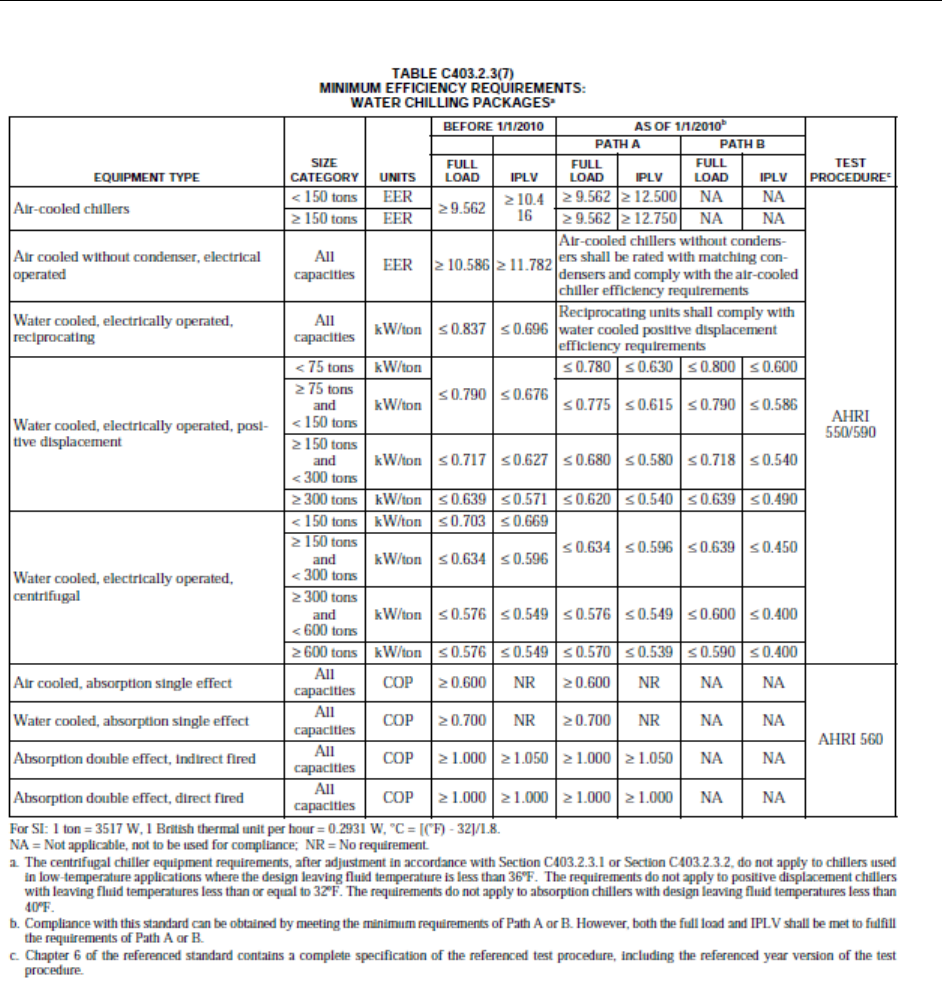
Iowa Energy Efficiency Statewide Technical Reference Manual –3.3.7 Electric Chiller
Vol.3 Nonresidential Measures July 22, 2020 FINAL Page 118 of 410
MEASURE CODE: NR-HVC-CHIL-V02-200101
SUNSET DATE: 1/1/2024
Filed with the Iowa Utilities Board on September 23, 2020, EEP-2018-0002

Iowa Energy Efficiency Statewide Technical Reference Manual –3.3.8 Package Terminal Air Conditioner (PTAC) and
Package Terminal Heat Pump (PTHP)
Vol.3 Nonresidential Measures July 22, 2020 FINAL Page 119 of 410
3.3.8. Package Terminal Air Conditioner (PTAC) and Package Terminal Heat Pump (PTHP)
DESCRIPTION
A PTAC is a packaged terminal air conditioner that cools and sometimes provides heat through an electric resistance
heater (heat strip). A PTHP is a packaged terminal heat pump. A PTHP uses its compressor year round to heat or
cool. In warm weather, it efficiently captures heat from inside your building and pumps it outside for cooling. In cool
weather, it captures heat from outdoor air and pumps it into your home, adding heat from electric heat strips as
necessary to provide heat.
This measure characterizes:
a) Time of Sale: the purchase and installation of a new efficient PTAC or PTHP.
b) Early Replacement: the early removal of an existing PTAC or PTHP from service, prior to its natural end
of life, and replacement with a new efficient PTAC or PTHP unit. Savings are calculated between existing
unit and efficient unit consumption during the remaining life of the existing unit, and between new
baseline unit and efficient unit consumption for the remainder of the measure life. The measure is only
valid for non-fuel switching installations – for example replacing a cooling only PTAC with a PTHP can
currently not use the TRM.
This measure was developed to be applicable to the following program types: TOS NC, EREP. If applied to other
program types, the measure savings should be verified.
DEFINITION OF EFFICIENT EQUIPMENT
In order for this characterization to apply, the efficient equipment is assumed to be PTACs or PTHPs that exceed
baseline efficiencies.
DEFINITION OF BASELINE EQUIPMENT
Time of Sale: the baseline conditions is provided in the Federal Baseline reference table provided below.
Early Replacement: the baseline is the existing PTAC or PTHP for the assumed remaining useful life of the unit and
the new baseline as defined above for the remainder of the measure life.
DEEMED LIFETIME OF EFFICIENT EQUIPMENT
The expected measure life is assumed to be 8 years.
249
Remaining life of existing equipment is assumed to be 3 years.
250
DEEMED MEASURE COST
Time of Sale: The incremental capital cost for this equipment is estimated to be $84/ton.
251
Early Replacement: The measure cost is the full cost of removing the existing unit and installing a new one. The
actual program cost should be used. If unknown assume $1,047 per ton.
252
The assumed deferred cost (after 3 years) of replacing existing equipment with new baseline unit is assumed to be
249
Based on 2015 DOE Technical Support Document, as recommended in Navigant ‘ComEd Effective Useful Life Research
Report’, May 2018
250
Standard assumption of one third of effective useful life.
251
DEER 2008. This assumes that baseline shift from IECC 2006 to IECC 2012 carries the same incremental costs. Values should
be verified during evaluation
252
Based on DCEO – IL PHA Efficient Living Program data.
Filed with the Iowa Utilities Board on September 23, 2020, EEP-2018-0002

Iowa Energy Efficiency Statewide Technical Reference Manual –3.3.8 Package Terminal Air Conditioner (PTAC) and
Package Terminal Heat Pump (PTHP)
Vol.3 Nonresidential Measures July 22, 2020 FINAL Page 120 of 410
$1,039 per ton.
253
This cost should be discounted to present value using the utilities’ discount rate.
LOADSHAPE
Loadshape NREP01:16 - Nonresidential Electric Heat Pump (by Building Type)
Algorithm
CALCULATION OF SAVINGS
ELECTRIC ENERGY SAVINGS
Electric savings for PTACs and PTHPs should be calculated using the following algorithms.
ENERGY SAVINGS
Time of Sale:
PTAC ΔkWh
254
= Annual kWh Savings
cool
PTHP ΔkWh
= Annual kWh Savings
cool +
Annual kWh Savings
heat
Early Replacement:
ΔkWh for remaining life of existing unit (1
st
3 years)
= Annual kWh Savings
cool +
Annual kWh Savings
heat
ΔkWh for remaining measure life (next 5 years)
= Annual kWh Savings
cool +
Annual kWh Savings
heat
253
Based on subtracting TOS incremental cost from the DCEO data and incorporating inflation rate of 1.91%.
254
There are no heating efficiency improvements for PTACs since although some do provide heating, it is always through
electric resistance and therefore the COPbase and COPee would be 1.0.
Filed with the Iowa Utilities Board on September 23, 2020, EEP-2018-0002

Iowa Energy Efficiency Statewide Technical Reference Manual –3.3.8 Package Terminal Air Conditioner (PTAC) and
Package Terminal Heat Pump (PTHP)
Vol.3 Nonresidential Measures July 22, 2020 FINAL Page 121 of 410
Where:
EFLH
cool
= Equivalent Full Load Hours for cooling are provided in section 3.3 HVAC End Use.
Capacity
Cool
= Cooling Capacity of Air Source Heat Pump (Btu/hr)
= Actual (where 1 ton = 12,000Btu/hr)
EER
base
= Energy Efficiency Ratio of the baseline equipment; see the table below for values.
EER
ee
= Energy Efficiency Ratio of the energy efficient equipment.
= Actual installed
EER
exist
= Energy Efficiency Ratio of the existing equipment
= Actual. If unknown assume 8.1 EER
255
EFLH
heat
= heating mode equivalent full load hours are provided in section 3.3 HVAC End Use.
Capacity
Heat
= Heating Capacity of Air Source Heat Pump (Btu/hr)
= Actual (where 1 ton = 12,000Btu/hr)
COP
base
= coefficient of performance of the baseline equipment; see table below for values.
COP
ee
= coefficient of performance of the energy efficient equipment.
= Actual installed
COP
exist
= coefficient of performance of the existing equipment
= Actual. If unknown assume 1.0 COP for PTAC units and 2.6 COP for PTHPs
256
3,412 = kBtu per kWh.
Copy of Table C403.2.3(3): Minimum Efficiency Reguirements: Electrically operated packaged terminal air
conditioners, packaged terminal heat pumps
Equipment Type
Minimum Efficiency as of 10/08/2012
PTAC (Cooling mode) New Construction
14.0 – (0.300 x Cap/1000) EER
PTAC (Cooling mode) Replacements
10.9 – (0.213 x Cap/1000) EER
PTHP (Cooling mode) New Construction
14.0 – (0.300 x Cap/1000) EER
PTHP (Cooling mode) Replacements
10.8 – (0.213 x Cap/1000) EER
PTHP (Heating mode) New Construction
3.7 – (0.052 x Cap/1000) COP
PTHP (Heating mode) Replacements
2.9 – (0.026 x Cap/1000) COP
“Cap” = The rated cooling capacity of the project in Btu/hr. If the units capacity is less than 7000
Btu/hr, use 7,000 Btu/hr in the calculation. If the unit’s capacity is greater than 15,000 Btu/hr,
use 15,000 Btu/hr in the calculations.
Replacement unit shall be factory labeled as follows “MANUFACTURED FOR REPLACEMENT
APPLICATIONS ONLY; NOT TO BE INSTALLED IN NEW CONSTRUCTION PROJECTS”, Replacement
efficiencies apply only to units with existing sleeves less than 16 inches (406mm) in height and
less than 42 inches (1067 mm) in width.
255
Estimated using the IECC building energy code up until year 2003 (p107;
https://law.resource.org/pub/us/code/ibr/icc.iecc.2000.pdf) and assuming a 1 ton unit; EER = 10 – (0.16 * 12,000/1,000) = 8.1.
256
Estimated using the IECC building energy code up until year 2003 (p107;
https://law.resource.org/pub/us/code/ibr/icc.iecc.2000.pdf) and assuming a 1 ton unit; COP = 2.9 – (0.026 * 12,000/1,000) =
2.6
Filed with the Iowa Utilities Board on September 23, 2020, EEP-2018-0002

Iowa Energy Efficiency Statewide Technical Reference Manual –3.3.8 Package Terminal Air Conditioner (PTAC) and
Package Terminal Heat Pump (PTHP)
Vol.3 Nonresidential Measures July 22, 2020 FINAL Page 122 of 410
SUMMER COINCIDENT PEAK DEMAND SAVINGS
Time of Sale:
Early Replacement:
ΔkW for remaining life of existing unit (1
st
3 years):
ΔkWh for remaining measure life (next 5 years):
Where:
CF = Summer System Peak Coincidence Factor for Cooling (dependent on building type)
Building Type
CF
257
Model Source
Convenience
92.3%
eQuest
Education
96.7%
OpenStudio
Grocery
100.0%
OpenStudio
Health
100.0%
OpenStudio
Hospital
98.6%
OpenStudio
Industrial
44.6%
eQuest
257
This calculation is the total savings in peak hour demand divided by the total savings in absolute peak demand.
Time of Sale (assuming new construction baseline):
For example, a 1 ton PTAC with an efficient EER of 12 at an existing hotel in Burlington saves:
= [(12,000) * [(1/10.4) – (1/12)] / 1000 * 1,464
= 225 kWh
Early Replacement (assuming replacement baseline for deferred replacement in 3 years):
For example, a 1 ton PTHP with an efficient EER of 12, COP of 3.0 at an existing restaurant in unknown location
replaces a PTAC unit (with electric resistance heat) with unknown efficiency.
ΔkWh for remaining life of existing unit (1
st
3 years)
= (12,000 * (1/8.1 – 1/12) * 1,173) / 1,000 + (12,000/3,412 * (1/1.0 – 1/3.0) * 1,249)
= 565 + 2,929
= 3,494 kWh
ΔkWh for remaining measure life (next 5 years)
= (12,000 * (1/8.3 – 1/12) * 1,173) / 1,000 + (12,000/3,412 * (1/1.0 – 1/3.0) * 1,249)
= 523 + 2,929
= 3,452 kWh
Filed with the Iowa Utilities Board on September 23, 2020, EEP-2018-0002

Iowa Energy Efficiency Statewide Technical Reference Manual –3.3.8 Package Terminal Air Conditioner (PTAC) and
Package Terminal Heat Pump (PTHP)
Vol.3 Nonresidential Measures July 22, 2020 FINAL Page 123 of 410
Building Type
CF
257
Model Source
Lodging
97.4%
OpenStudio
Multifamily
100.0%
OpenStudio
Office - Large
98.8%
OpenStudio
Office - Small
100.0%
OpenStudio
Religious
94.3%
eQuest
Restaurant
99.6%
OpenStudio
Retail - Large
87.6%
eQuest
Retail - Small
100.0%
OpenStudio
Warehouse
77.9%
eQuest
Nonresidential Average
258
92.3%
N/A
NATURAL GAS ENERGY SAVINGS
N/A
WATER IMPACT DESCRIPTIONS AND CALCULATION
N/A
DEEMED O&M COST ADJUSTMENT CALCULATION
N/A
MEASURE CODE: NR-HVC-PTAC-V02-200101
SUNSET DATE: 1/1/2022
258
For weighting factors, see HVAC variable table in section 3.3.
Time of Sale:
For example, a 1 ton PTAC with an efficient EER of 12 at an existing hotel in Burlington saves:
ΔkW = (12,000 * (1/10.4 – 1/12) / 1,000 *0.974
= 0.15 kW
Early Replacement (assuming replacement baseline for deferred replacement in 3 years):
For example, a 1 ton PTHP with an efficient EER of 12, COP of 3.0 at an existing restaurant in unknown location
replaces a PTAC unit (with electric resistance heat) with unknown efficiency.
ΔkW for remaining life of existing unit (1
st
3years):
ΔkW = 12,000 * (1/8.1 – 1/12) / 1,000 * 0.996
= 0.48 kW
ΔkW for remaining measure life (next 5 years):
ΔkW = 12,000 * (1/8.3 – 1/12) / 1,000 * 0.996
= 0.43 kW
Filed with the Iowa Utilities Board on September 23, 2020, EEP-2018-0002

Iowa Energy Efficiency Statewide Technical Reference Manual –3.3.9 Guest Room Energy Management (PTAC)
Vol.3 Nonresidential Measures July 22, 2020 FINAL Page 124 of 410
3.3.9. Guest Room Energy Management (PTAC)
DESCRIPTION
This measure applied to the installation of a temperature setback and lighting control system for individual guest
rooms. The savings are achieved based on Guest Room Energy Management’s (GREM’s) ability to automatically
adjust lighting levels and the guest room’s set temperatures and control the packaged terminal air conditioner
(PTAC) unit when the room is not occupied.
This measure was developed to be applicable to the following program types: TOS, NC. If applied to other program
types, the measure savings should be verified.
DEFINITION OF EFFICIENT EQUIPMENT
Guest room temperature set point must be controlled by automatic occupancy detectors or keycard that indicates
the occupancy status of the room. During unoccupied periods the system sets heating and cooling to a minimum,
and turns off lighting when the key card is removed. Once the guest returns and inserts the key card, the guest has
full control of the room systems. This measure bases savings on improved HVAC controls and reduced lighting loads.
The incentive is per guestroom controlled, rather than per sensor, for multi-room suites. Replacement or upgrades
of existing occupancy-based controls are not eligible for an incentive.
DEFINITION OF BASELINE EQUIPMENT
Guest room energy management thermostats replace manual lighting controls and heating/cooling temperature
set-point and fan On/Off/Auto thermostat controls for the PTAC.
DEEMED LIFETIME OF EFFICIENT EQUIPMENT
The measure life for GREM is 15 years.
259
DEEMED MEASURE COST
$260/unit
The incremental measure cost documented for this measure is $260 per room HVAC controller, which is the cost
difference between a non-programmable thermostat and a GREM.
260
DEEMED O&M COST ADJUSTMENTS
N/A
LOADSHAPE
Loadshape NREH07 – Nonresidential Electric Heat – Lodging
Loadshape NRECH07 – Nonresidential Cooling – Lodging
Loadshape NRGH07 – Nonresidential Gas Heating – Lodging
Algorithm
CALCULATION OF SAVINGS
Below are the annual kWh savings per installed energy management system for different climate zones. The savings
259
DEER 2008 value for energy management systems
260
This value was extracted from Smart Ideas projects in PY1 and PY2.
Filed with the Iowa Utilities Board on September 23, 2020, EEP-2018-0002

Iowa Energy Efficiency Statewide Technical Reference Manual –3.3.9 Guest Room Energy Management (PTAC)
Vol.3 Nonresidential Measures July 22, 2020 FINAL Page 125 of 410
are achieved based on GREM’s ability to automatically adjust the guest room’s set temperatures and control the
HVAC unit to maintain set temperatures for various occupancy modes. If the GREM is capable of controlling lighting,
additional savings result. The basis of savings is the 2013 California Building Energy Standards, which used EnergyPro
5 simulation.
261
For PTACs that use gas for heating, separate gas savings are outlined.
ELECTRIC ENERGY SAVINGS
Where:
Rooms = Number of rooms with a GREM system installed.
Other variables as listed in the table below:
Climate Zone
Heating savings
[kWh/room/year]
Cooling savings
[kWh/room/year]
Lighting savings
[kWh/room/year]
Zone 5
(Burlington)
111.3
24.6
62.0
Zone 6
(Mason City)
151.5
17.8
62.0
Average /
Unknown
135.8
22.2
62.0
SUMMER COINCIDENT PEAK DEMAND SAVINGS
Where:
EFLH
Cool
= Equivalent Full Load Hours for cooling are provided in section 3.3 HVAC End Use
CF = Summer System Peak Coincidence Factor for Cooling,
= 97.4% (for Lodging)
Other variables as defined above.
NATURAL GAS ENERGY SAVINGS
For PTACs with gas heating:
Where:
Rooms = Number of rooms with a GREM system installed.
Gas Savings factor as listed in the table below:
Climate Zone
Gas Savings
262
[therms/room/year]
Zone 5
(Burlington)
4.7
261
Results for California were adjusted to be Iowa-specific using a comparison of heating and cooling degree day differences.
See the supporting workbook titled “Hotel Energy Management.xlsx” for additional detail.
262
Savings include the assumption that the thermal efficiency of the heating unit is 80%, per IECC2012 code.
Filed with the Iowa Utilities Board on September 23, 2020, EEP-2018-0002

Iowa Energy Efficiency Statewide Technical Reference Manual –3.3.9 Guest Room Energy Management (PTAC)
Vol.3 Nonresidential Measures July 22, 2020 FINAL Page 126 of 410
Climate Zone
Gas Savings
262
[therms/room/year]
Zone 6
(Mason City)
6.5
Average /
Unknown
5.8
PEAK GAS SAVINGS
Where:
ΔTherms = Therm impact calculated above
GCF = Gas Coincidence Factor for Heating
= 0.681941for Lodging
WATER IMPACT DESCRIPTIONS AND CALCULATION
N/A
DEEMED O&M COST ADJUSTMENT CALCULATION
N/A
MEASURE CODE: NR-HVC-GREM-V02-200101
SUNSET DATE: 1/1/2022
Filed with the Iowa Utilities Board on September 23, 2020, EEP-2018-0002

Iowa Energy Efficiency Statewide Technical Reference Manual –3.3.10 Boiler Tune-up
Vol.3 Nonresidential Measures July 22, 2020 FINAL Page 127 of 410
3.3.10. Boiler Tune-up
DESCRIPTION
This measure is for a nonresidential boiler that provides space heating. The tune-up will improve boiler efficiency
by cleaning and/or inspecting burners, combustion chamber, and burner nozzles. Adjust air flow and reduce
excessive stack temperatures, adjust burner and gas input. Check venting, safety controls, and adequacy of
combustion air intake. Combustion efficiency should be measured before and after tune-up using an electronic flue
gas analyzer.
This measure was developed to be applicable to the following program types: RF.
If applied to other program types, the measure savings should be verified.
DEFINITION OF EFFICIENT EQUIPMENT
The recommended tune up requirements are listed below. It is recommended that utility programs require
technicians performing the work are appropriately certified.
• Measure combustion efficiency using an electronic flue gas analyzer.
• Adjust airflow and reduce excessive stack temperatures.
• Adjust burner and gas input, manual or motorized draft control.
• Check for proper venting.
• Complete visual inspection of system piping and insulation.
• Check safety controls.
• Check adequacy of combustion air intake.
• Clean fireside surfaces.
• Inspect all refractory. Patch and wash coat as required.
• Inspect gaskets on front and rear doors and replace as necessary.
• Seal and close front and rear doors properly.
• Clean low and auxiliary low water cut-off controls, then re-install using new gaskets.
• Clean plugs in control piping.
• Remove all hand hole and man hole plates. Flush boiler with water to remove loose scale and sediment.
• Replace all hand hole and man hole plates with new gaskets.
• Open feedwater tank manway, inspect and clean as required. Replace manway plate with new gasket.
• Clean burner and burner pilot.
• Check pilot electrode and adjust or replace.
• Clean air damper and blower assembly.
• Clean motor starter contacts and check operation.
• Make necessary adjustments to burner for proper combustion.
• Perform all flame safeguard and safety trip checks.
• Check all hand hole plates and man hole plates for leaks at normal operating temperatures and pressures.
• Troubleshoot any boiler system problems as requested by on-site personnel.
• Verify boiler delta T is within system design limits.
DEFINITION OF BASELINE EQUIPMENT
The baseline condition of this measure is a boiler that has not had a tune-up within the past 12 months
Filed with the Iowa Utilities Board on September 23, 2020, EEP-2018-0002

Iowa Energy Efficiency Statewide Technical Reference Manual –3.3.10 Boiler Tune-up
Vol.3 Nonresidential Measures July 22, 2020 FINAL Page 128 of 410
DEEMED LIFETIME OF EFFICIENT EQUIPMENT
The life of this measure is 1 year.
DEEMED MEASURE COST
The cost of this measure is the actual tune up cost.
LOADSHAPE
Loadshape NRGH01:16 – Nonresidential Gas Heating (by Building Type)
Loadshape NRGB01:16 – Nonresidential Gas Heat and Hot Water (by Building Type)
Algorithm
CALCULATION OF ENERGY SAVINGS
ELECTRIC ENERGY SAVINGS
N/A
SUMMER COINCIDENT PEAK DEMAND SAVINGS
N/A
NATURAL GAS SAVINGS
Where:
Capacity = Gas Boiler input size (Btu/hr)
= Actual
EFLH = Equivalent Full Load Hours for heating are provided in section 3.3 HVAC End Use
Effbefore = Combustion Efficiency of the boiler before the tune-up
= Actual
Ei = Combustion Efficiency Improvement of the boiler tune-up measure
263
= Actual
100,000 = Converts Btu to therms
263
The percentage improvement in combustion efficiency is deemed a reasonable proxy for the system improvement. If a full
thermal efficiency test is performed instead, that should be used.
For example, for a 200 kBtu boiler in an existing small office in unknown location that records an efficiency prior
to tune-up of 82% AFUE and a 1.8% improvement in efficiency after tune-up:
Δtherms = (200,000 * 1358 * (((0.82 + 0.018)/ 0.82) – 1)) /100,000
= 60.0 therms
Filed with the Iowa Utilities Board on September 23, 2020, EEP-2018-0002

Iowa Energy Efficiency Statewide Technical Reference Manual –3.3.10 Boiler Tune-up
Vol.3 Nonresidential Measures July 22, 2020 FINAL Page 129 of 410
PEAK GAS SAVINGS
Where:
ΔTherms = Therm impact calculated above
GCF = Gas Coincidence Factor for Heating
Building Type
GCF
264
Model Source
Convenience
0.016310
eQuest
Education
0.011480
OpenStudio
Grocery
0.013083
OpenStudio
Health
0.010179
OpenStudio
Hospital
0.015543
OpenStudio
Industrial
0.014240
eQuest
Lodging
0.013205
OpenStudio
Multifamily
0.012268
OpenStudio
Office - Large
0.013082
OpenStudio
Office - Small
0.016718
OpenStudio
Religious
0.011745
eQuest
Restaurant
0.015262
OpenStudio
Retail - Large
0.013281
eQuest
Retail - Small
0.014055
OpenStudio
Warehouse
0.015677
eQuest
Nonresidential Average
265
0.014623
N/A
WATER IMPACT DESCRIPTIONS AND CALCULATION
N/A
DEEMED O&M COST ADJUSTMENT CALCULATION
While there is likely to be some O&M cost savings due to reduced service calls, increased equipment life, etc., these
will only be realized with a regular maintenance schedule, which cannot be assumed for each individual tune-up
measure. This benefit is therefore conservatively excluded.
MEASURE CODE: NR-HVC-BLRT-V02-200101
SUNSET DATE: 1/1/2023
264
Calculated as the percentage of total savings in the maximum saving day, from models.
265
For weighting factors see HVAC variable table in section 3.3.
For example, for a 200 kBtu boiler in an existing small office in unknown location that records an efficiency prior
to tune-up of 82% AFUE and a 1.8% improvement in efficiency after tune-up:
ΔPeakTherms = 60.0 * 0.0167180
= 1.00031 therms
Filed with the Iowa Utilities Board on September 23, 2020, EEP-2018-0002

Iowa Energy Efficiency Statewide Technical Reference Manual –3.3.11 Furnace Tune-Up
Vol.3 Nonresidential Measures July 22, 2020 FINAL Page 130 of 410
3.3.11. Furnace Tune-Up
DESCRIPTION
This measure is for a tune-up to a natural gas furnace that provides space heating in a nonresidential application.
The tune-up will improve furnace performance by inspecting, cleaning and adjusting the furnace and appurtenances
for correct and efficient operation.
This measure was developed to be applicable to the following program types: RF.
If applied to other program types, the measure savings should be verified.
DEFINITION OF EFFICIENT EQUIPMENT
The recommended tune-up requirements are listed below. It is recommended that utility programs require
technicians performing the work are appropriately certified.
• Measure combustion efficiency using an electronic flue gas analyzer.
• Check and clean blower assembly and components per manufacturer’s recommendations.
• Where applicable, lubricate motor and inspect and replace fan belt if required.
• Inspect for gas leaks.
• Clean burner per manufacturer’s recommendations and adjust as needed.
• Check ignition system and safety systems and clean and adjust as needed.
• Check and clean heat exchanger per manufacturer’s recommendations.
• Inspect exhaust/flue for proper attachment and operation.
• Inspect control box, wiring, and controls for proper connections and performance.
• Check air filter and clean or replace per manufacturer’s recommendations.
• Inspect duct work connected to furnace for leaks or blockages.
• Measure temperature rise and adjust flow as needed.
• Check for correct line and load volts/amps.
• Check that thermostat operation is per manufacturer’s recommendations.
• Perform Carbon Monoxide test and adjust heating system until results are within standard industry
acceptable limits.
• Check and adjust gas input.
• Check high limit and other safety controls.
DEFINITION OF BASELINE EQUIPMENT
The baseline for a clean and check tune-up is a furnace assumed not to have had a tune-up in the past 2 years.
DEEMED LIFETIME OF EFFICIENT EQUIPMENT
The measure life of a clean and check tune-up is 2 years.
266
DEEMED MEASURE COST
The incremental cost for this measure should be the actual cost of tune-up.
LOADSHAPE
266
Based on VEIC professional judgment.
Filed with the Iowa Utilities Board on September 23, 2020, EEP-2018-0002

Iowa Energy Efficiency Statewide Technical Reference Manual –3.3.11 Furnace Tune-Up
Vol.3 Nonresidential Measures July 22, 2020 FINAL Page 131 of 410
Loadshape NRGH01:16 – Nonresidential Gas Heating (by Building Type)
Loadshape NREH01:16 – Nonresidential Electric Heating (by Building Type)
Algorithms
CALCULATION OF ENERGY SAVINGS
ELECTRIC ENERGY SAVINGS
Where:
ΔTherms = as calculated below
F
e
= Furnace Fan energy consumption as a percentage of annual fuel consumption
= 3.14%
267
29.3 = kWh per therm
SUMMER COINCIDENT PEAK DEMAND SAVINGS
N/A
NATURAL GAS SAVINGS
Where:
EFLH = Equivalent Full Load Hours for heating are provided in section 3.3 HVAC End Use
Capacity = Nominal Heating Input Capacity Furnace Size (Btu/hr)
= Actual
Effbefore = Combustion Efficiency of the furnace before the tune-up
= Actual
Ei = Combustion Efficiency Improvement of the furnace tune-up measure
268
= Actual
100,000 = Conversion of Btu to Therms
267
F
e
is not one of the AHRI certified ratings provided for residential furnaces, but can be reasonably estimated from a
calculation based on the certified values for fuel energy (Ef in MMBtu/yr) and Eae (kWh/yr). An average of a 300 record sample
(non-random) out of 1495 was 3.14%. This is, appropriately, ~50% greater than the Energy Star version 3 criteria for 2% F
e
. See
“Programmable Thermostats Furnace Fan Analysis.xlsx” for reference.
268
The percentage improvement in combustion efficiency is deemed a reasonable proxy for the system improvement. If a full
thermal efficiency test is performed instead, that should be used.
For example, for a 200 kBtu furnace in an existing small office in unknown location that records an efficiency prior
to tune-up of 82% AFUE and a 1.8% improvement in efficiency after tune-up:
Δtherms = (200,000 * 1358 * (((0.82 + 0.018)/ 0.82) – 1)) /100,000
= 60.0 therms
Filed with the Iowa Utilities Board on September 23, 2020, EEP-2018-0002

Iowa Energy Efficiency Statewide Technical Reference Manual –3.3.11 Furnace Tune-Up
Vol.3 Nonresidential Measures July 22, 2020 FINAL Page 132 of 410
PEAK GAS SAVINGS
Where:
ΔTherms = Therm impact calculated above
GCF = Gas Coincidence Factor for Heating
Building Type
GCF
269
Model Source
Convenience
0.016482
eQuest
Education
0.011480
OpenStudio
Grocery
0.013083
OpenStudio
Health
0.010179
OpenStudio
Hospital
0.015543
OpenStudio
Industrial
0.014296
eQuest
Lodging
0.013205
OpenStudio
Multifamily
0.012268
OpenStudio
Office - Large
0.013082
OpenStudio
Office - Small
0.016718
OpenStudio
Religious
0.011964
eQuest
Restaurant
0.015262
OpenStudio
Retail - Large
0.013281
eQuest
Retail - Small
0.014055
OpenStudio
Warehouse
0.015677
eQuest
Nonresidential Average
270
0.014658
N/A
WATER IMPACT DESCRIPTIONS AND CALCULATION
N/A
DEEMED O&M COST ADJUSTMENT CALCULATION
While there is likely to be some O&M cost savings due to reduced service calls, increased equipment life, etc., these
will only be realized with a regular maintenance schedule, which cannot be assumed for each individual tune-up
measure. This benefit is therefore conservatively excluded.
MEASURE CODE: NR-HVC-FTUN-V03-200101
SUNSET DATE: 1/1/2023
269
Calculated as the percentage of total savings in the maximum saving day, from models.
270
For weighting factors, see HVAC variable table in section 3.3.
For example, for a 200 kBtu furnace in a small office in unknown location that records an efficiency prior to tune-up
of 82% AFUE and a 1.8% improvement in efficiency after tune-up:
ΔPeakTherms = 60.0 * 0.0167180
= 1.0031 therms
Filed with the Iowa Utilities Board on September 23, 2020, EEP-2018-0002

Iowa Energy Efficiency Statewide Technical Reference Manual –3.3.12 Small Commercial Thermostats
Vol.3 Nonresidential Measures July 22, 2020 FINAL Page 133 of 410
3.3.12. Small Commercial Thermostats
DESCRIPTION
This measure characterizes the energy savings from the installation of a new Programmable or Advanced Thermostat
for reduced heating and cooling energy consumption through temperature set-back during unoccupied or reduced
demand times. This measure is limited to small businesses as defined by programs,
271
as they have smaller HVAC
systems that are similar to residential HVAC systems and may be controlled by a simple manual adjustment
thermostat. Mid- to large-sized businesses will typically have a building automation system or some other form of
automated HVAC controls. Therefore, use of this measure characterization is limited to select building types (such
as convenience stores, small retail, low rise office, restaurants, religious facilities). This measure is only appropriate
for single zone heating systems. Custom calculations are required for savings for programmable thermostats
installed in multi-zone systems.
This measure was developed to be applicable to the following program types: TOS, RF, DI.
If applied to other program types, the measure savings should be verified.
DEFINITION OF EFFICIENT EQUIPMENT
The criteria for this measure are established by replacement of a manual-only temperature control with one that
has the capability to adjust temperature setpoints according to a schedule without manual intervention.
DEFINITION OF BASELINE EQUIPMENT
For new thermostats the baseline is a non-programmable thermostat requiring manual intervention to change the
temperature setpoint.
DEEMED LIFETIME OF EFFICIENT EQUIPMENT
The expected measure life of a thermostat is assumed to be 8 years.
272
DEEMED MEASURE COST
Actual material and labor costs should be used if the implementation method allows. If unknown, the capital cost
for this measure is assumed to be $181.
273
LOADSHAPE
NREC17 – Non-Residential Cooling – Small Programmable Thermostat
NREP01:16 – Non-Residential Electric Heat Pump (by Building Type)
NRGH01:16 – Nonresidential Gas Heating (by Building Type)
271
The square footage of the small office prototype building modeled in is 7,500 sf.
272
8 years is based upon ASHRAE Applications (2003), Section 36, Table 3 estimate of 16 years for the equipment life, reduced
by 50% to account for persistence issues.
273
Nicor Rider 30 Business EER Program Database, Paid Rebates with Programmable Thermostat Installation Costs, Program to
Date as of January 11, 2013.
Filed with the Iowa Utilities Board on September 23, 2020, EEP-2018-0002

Iowa Energy Efficiency Statewide Technical Reference Manual –3.3.12 Small Commercial Thermostats
Vol.3 Nonresidential Measures July 22, 2020 FINAL Page 134 of 410
Algorithm
CALCULATION OF SAVINGS
ELECTRIC ENERGY SAVINGS
Electric energy savings is calculated as the sum of energy saved when cooling the building and energy saved when
heating the building:
∆kWh = ∆kWh
cooling
+ ∆kWh
heating
If central cooling exists, the electric energy saved in annual cooling due to the thermostat is:
Where:
Sqft = square footage of building controlled by thermostat
EfficiencyRating(exist)
cool
= efficiency rating of existing cooling equipment EER (btu hr/W)
If unknown assume code minimum
Savings Factor
cool
= cooling savings factor
= 0.53 kBtu/sf-yr
274
If the building is heated with electric heat (heat pump), the electric energy saved in annual heating due to the
thermostat is:
Where:
Savings Factor
heat
= 0.85 kBtu/sf-yr
275
3.142 = Conversion from kBtu to kWh
EfficiencyRating(exist)
electric
heat
= efficiency rating of existing heating system
= Actual. If unknown assume code minimum. Note: heat pumps will
have an efficiency greater than 100%
Other factors as defined above.
If the building is heated with a gas furnace, there will be some electric savings in heating the building attributed to
furnace fans operating fewer hours:
∆kWh
heating
= ∆Therms * Fe * 29.3
Where:
∆Therms = Gas savings calculated with equation below.
274
Cooling Savings Factors for the programmable thermostat are calculated as the savings in annual building load divided by
the square footage of the small office prototype building (7,500 sf) and converted to kBtu.
275
Heating Savings Factors for the programmable thermostat are calculated as the savings in annual building load divided by
the square footage of the prototype building (7,500 sf) and converted to kBtu.
Filed with the Iowa Utilities Board on September 23, 2020, EEP-2018-0002

Iowa Energy Efficiency Statewide Technical Reference Manual –3.3.12 Small Commercial Thermostats
Vol.3 Nonresidential Measures July 22, 2020 FINAL Page 135 of 410
Fe = Percentage of heating energy consumed by fans, assume 3.14%
276
29.3 = Conversion from therms to kWh
SUMMER COINCIDENT PEAK DEMAND SAVINGS
0.0
277
NATURAL GAS ENERGY SAVINGS
If building uses a gas heating system, the savings resulting from the thermostat is calculated with the following
formula:
Where:
Sqft = square footage of building controlled by thermostat
EfficiencyRating(exist)
heat
= efficiency rating of existing heating equipment (AFUE)
If unknown assume code minimum
Savings Factor
heat
= 0.85 kBtu/sf-yr
278
PEAK GAS SAVINGS
Where:
ΔTherms = Therm impact calculated above
GCF = Gas Coincidence Factor for Heating
Building Type
GCF
279
Model Source
Convenience
0.016482
eQuest
Education
0.011480
OpenStudio
Grocery
0.013083
OpenStudio
Health
0.010179
OpenStudio
Hospital
0.015543
OpenStudio
Industrial
0.014296
eQuest
Lodging
0.013205
OpenStudio
Multifamily
0.012268
OpenStudio
Office - Large
0.013082
OpenStudio
Office - Small
0.016718
OpenStudio
Religious
0.011964
eQuest
Restaurant
0.015262
OpenStudio
276
F
e
is not one of the AHRI certified ratings provided for furnaces, but can be reasonably estimated from a calculation based
on the certified values for fuel energy (Ef in MMBtu/yr) and Eae (kWh/yr). An average of a 300 record sample (non-random)
out of 1495 was 3.14% for residential units. This is, appropriately, ~50% greater than the Energy Star version 3 criteria for 2%
F
e
. See “Programmable Thermostats Furnace Fan Analysis.xlsx” for reference. Assumed to be consistent with C&I applications.
277
modeling work used to simulate savings for this measure showed no summer peak demand savings.
278
Heating Savings Factors for the programmable thermostat are calculated as the savings in annual building load divided by
the square footage of the prototype building (7,500 sf) and converted to kBtu.
279
Calculated as the percentage of total savings in the maximum saving day, from models.
Filed with the Iowa Utilities Board on September 23, 2020, EEP-2018-0002

Iowa Energy Efficiency Statewide Technical Reference Manual –3.3.12 Small Commercial Thermostats
Vol.3 Nonresidential Measures July 22, 2020 FINAL Page 136 of 410
Building Type
GCF
279
Model Source
Retail - Large
0.013281
eQuest
Retail - Small
0.014055
OpenStudio
Warehouse
0.015677
eQuest
Nonresidential Average
280
0.014658
N/A
WATER IMPACT DESCRIPTIONS AND CALCULATION
N/A
DEEMED O&M COST ADJUSTMENT CALCULATION
N/A
MEASURE CODE: NR-HVC-PROG-V04-210101
SUNSET DATE: 1/1/2022
280
For weighting factors, see HVAC variable table in section 3.3.
Filed with the Iowa Utilities Board on September 23, 2020, EEP-2018-0002

Iowa Energy Efficiency Statewide Technical Reference Manual –3.3.13 Variable Frequency Drives for HVAC Pumps
and Cooling Tower Fans
Vol.3 Nonresidential Measures July 22, 2020 FINAL Page 137 of 410
3.3.13. Variable Frequency Drives for HVAC Pumps and Cooling Tower Fans
DESCRIPTION
This measure applies to variable frequency drives (VFDs) installed on HVAC chilled water and hot water distribution
pumps (centrifugal pumps only) and cooling tower fans. There is a separate measure for HVAC supply and return
fans. The VFD will modulate the speed of the motor when it does not need to run at full load. Theoretically, since
the power of the motor is proportional to the cube of the speed for these types of applications, significant energy
savings will result.
This measure is not applicable for:
• Cooling towers, chilled or hot water pumps with any process load.
• VSD installation in existing cooling towers with 2-speed motors. (current code requires 2-speed motors for
cooling towers with motors greater than 7.5 HP)
• VSD installation in new cooling towers with motors greater than 7.5 HP
This measure was developed to be applicable to the following program types: TOS, RF.
If applied to other program types, the measure savings should be verified.
DEFINITION OF EFFICIENT EQUIPMENT
The VFD is applied to a pump motor 1-100 HP that does not have a VFD. The hydronic system that the VFD is applied
to must have a variable or reduced load. Installation is to include the necessary control points and parameters
(example: differential pressure, differential temperature, return water temperature) as determined by a qualified
engineer. The savings are based on the application of VFDs applied to a range of baseline systems, including no
control, inlet or outlet guide vanes, throttling valves, and three-way valves with bypass.
DEFINITION OF BASELINE EQUIPMENT
The time of sale baseline is a new motor installed without a VFD. Retrofit baseline is an existing motor operating as
is. Retrofit baselines may or may not include guide vanes, throttling valves, or other methods of control. This
information shall be collected from the customer.
Installations of new equipment with VFDs that are required by IECC 2012 as adopted by the State of Iowa are not
eligible to claim savings.
281
DEEMED LIFETIME OF EFFICIENT EQUIPMENT
The expected measure life for HVAC application is 15 years.
282
DEEMED MEASURE COST
Customer-provided costs will be used when available. Default incremental VFD costs are listed below for 1 to 100
HP motors.
283
281
IECC provisions for existing buildings are as follows: “Additions, alterations, renovations or repairs to an existing building,
building system or portion thereof shall conform to the provisions of this code as they relate to new construction without
requiring the unaltered portion(s) of the existing building or building system to comply with this Code”.
282
“NEEP Incremental Cost Study – Phase II Final Report, Navigant, 2013.”
283
Incremental costs are sourced from the “NEEP Incremental Cost Study – Phase II Final Report, Navigant, 2013” and adjusted
to account for regional labor cost differences between the Mid-Atlantic region and the state of Iowa. The Bureau of Labor
Statistics, Occupational Employment Statistics, State Occupational Employment and Wage Estimates from May 2018 were
leveraged in order to identify prevailing wage differences between the location of the original study and the state of Iowa.
Filed with the Iowa Utilities Board on September 23, 2020, EEP-2018-0002

Iowa Energy Efficiency Statewide Technical Reference Manual –3.3.13 Variable Frequency Drives for HVAC Pumps
and Cooling Tower Fans
Vol.3 Nonresidential Measures July 22, 2020 FINAL Page 138 of 410
HP
Cost
1-9 HP
$2,177
10-19 HP
$3,123
20-29 HP
$4,280
30-39 HP
$5,023
40-49 HP
$5,766
50-59 HP
$6,591
60-69 HP
$7,550
70-79 HP
$8,173
80-89 HP
$8,796
90-100 HP
$9,576
LOADSHAPE
Loadshape NRE07 – VFD - Boiler feedwater pumps
Loadshape NRE08 – VFD - Chilled water pumps
Loadshape NRE09 – VFD - Boiler circulation pumps
Loadshape NRE18 - VFD - Cooling Tower Fans
Algorithm
CALCULATION OF SAVINGS
ELECTRIC ENERGY SAVINGS
Where:
BHP = System Brake Horsepower
= (Nominal motor HP * Motor load factor)
Motors are assumed to have a load factor of 65% for calculating kW if actual values cannot be
determined.
284
Custom load factor may be applied if known.
EFFi = Motor efficiency, installed.
= Actual
Hours = Default hours are provided for HVAC applications which vary by building type.
285
When available,
actual hours should be used.
The type of hours to apply depends on the VFD application, according to the table below.
Application
Hours Type
Hot Water Pump
Heating
Chilled Water Pump
Cooling
284
Del Balso, Ryan J. “Investigation into the Reliability of Energy Efficiency/Demand Side Management Savings Estimates for
Variable Frequency Drives in Commercial Applications”, University of Colorado, Department of Civil, Environmental and
Architectural Engineering, 2013.
285
Based on models developed in OpenStudio. Building types denoted with an asterisk indicate values were referenced from
the ComEd TRM June 1, 2010 page 139.
Filed with the Iowa Utilities Board on September 23, 2020, EEP-2018-0002

Iowa Energy Efficiency Statewide Technical Reference Manual –3.3.13 Variable Frequency Drives for HVAC Pumps
and Cooling Tower Fans
Vol.3 Nonresidential Measures July 22, 2020 FINAL Page 139 of 410
Application
Hours Type
Cooling Tower Fan
Cooling
Building Type
Heating Run Hours
Cooling Run Hours
Convenience*
3628
2690
Education
6367
2796
Grocery
6499
2725
Health
8720
4770
Hospital
8289
8760
Industrial*
3977
3080
Lodging
5500
7909
Multifamily
5382
5084
Office - Large
5316
4596
Office - Small
1952
2138
Religious*
4763
2223
Restaurant
3027
2719
Retail – Large*
4218
2405
Retail - Small
3029
2266
Warehouse*
4100
1788
Nonresidential Average
3659
2182
ESF = Energy savings factor varies by VFD application. Units are kW/HP.
Application
ESF
286
Hot Water Centrifugal Pump
0.187
Chilled Water Centrifugal Pump
0.094
Cooling Tower Fan
0.382
SUMMER COINCIDENT PEAK DEMAND SAVINGS
Where:
DSF = Demand Savings Factor varies by VFD application.
287
Units are kW/HP. Values listed below are
based on typical peak load for the listed application.
Application
DSF
Hot Water Centrifugal Pump
0
Chilled Water Centrifugal Pump
0
Cooling Tower Fan
0.32
286
Based on OpenStudio Large Office model, finding difference in energy use for each VSD application. See ‘VSD Savings Factor
Calc.xls’.
287
Based on OpenStudio Large Office model, finding difference in maximum demand during peak period for each VSD
application. See ‘VSD Savings Factor Calc.xls’
For example, a 50-horsepower VFD operating 2386 hours annually driving a motor with 95% efficiency and a
load factor of 70% on a chilled water pump would save:
ΔkWh = 50/0.95 * 0.70 * 2386 * 0.094
= 8,263 kWh
Filed with the Iowa Utilities Board on September 23, 2020, EEP-2018-0002

Iowa Energy Efficiency Statewide Technical Reference Manual –3.3.13 Variable Frequency Drives for HVAC Pumps
and Cooling Tower Fans
Vol.3 Nonresidential Measures July 22, 2020 FINAL Page 140 of 410
NATURAL GAS ENERGY SAVINGS
There are no expected fossil fuel impacts for this measure.
288
PEAK GAS SAVINGS
N/A
WATER IMPACT DESCRIPTIONS AND CALCULATION
N/A
DEEMED O&M COST ADJUSTMENT CALCULATION
N/A
MEASURE CODE: NR-HVC-VFHP-V04-210101
SUNSET DATE: 1/1/2024
288
Consider updating measure to include heating and cooling savings in future revisions.
For example, a 50-horsepower VFD operating 2386 hours annually driving a motor with 95% efficiency and a
load factor of 70% on a chilled water pump would save:
ΔkW = 50/0.95 * 0.7 * 0
= 0kW
Filed with the Iowa Utilities Board on September 23, 2020, EEP-2018-0002

Iowa Energy Efficiency Statewide Technical Reference Manual –3.3.14 Variable Frequency Drives for HVAC Supply
and Return Fans
Vol.3 Nonresidential Measures July 22, 2020 FINAL Page 141 of 410
3.3.14. Variable Frequency Drives for HVAC Supply and Return Fans
DESCRIPTION
This measure applies to variable frequency drives (VFDs) installed on HVAC supply fans and return fans. There is a
separate measure for HVAC Pumps. The VFD will modulate the speed of the motor when it does not need to run at
full load. Theoretically, since the power of the motor is proportional to the cube of the speed for these types of
applications, significant energy savings will result.
This measure is applicable to the following program types: TOS, RF.
If applied to other program types, the measure savings should be verified.
DEFINITION OF EFFICIENT EQUIPMENT
The VFD is applied to an HVAC fan motor 1-100 HP that does not have a VFD. The air distribution system must have
a variable or reduced load, and installation is to include the necessary control point as determined by a qualified
engineer (example: differential pressure, temperature, or volume). Savings are based on the application of VFDs
to a range of baseline system conditions, including no control, inlet guide vanes, outlet guide vanes, relief
dampers, and throttling valves.
DEFINITION OF BASELINE EQUIPMENT
The time of sale baseline is a new motor installed without a VFD or other methods of control. Retrofit baseline is
an existing motor operating as is. Retrofit baselines may or may not include guide vanes, throttling valves, or other
methods of control. This information shall be collected from the customer.
Installations of new equipment with VFDs that are required by IECC 2012 as adopted by the State of Iowa are not
eligible to claim savings.
289
DEEMED LIFETIME OF EFFICIENT EQUIPMENT
The expected measure life for HVAC application is 15 years.
290
DEEMED MEASURE COST
Customer provided costs will be used when available. Default measure costs are listed below for up to 100 hp
motors.
291
HP
Cost
1-9 HP
$2,177
10-19 HP
$3,123
20-29 HP
$4,4,280
30-39 HP
$5,5,023
40-49 HP
$5,766
50-59 HP
$6,591
60-69 HP
$7,550
289
IECC provisions for existing buildings are as follows: “Additions, alterations, renovations or repairs to an existing building,
building system or portion thereof shall conform to the provisions of this code as they relate to new construction without
requiring the unaltered portion(s) of the existing building or building system to comply with this Code”.
290
“NEEP Incremental Cost Study – Phase II Final Report, Navigant, 2013.”
291
Incremental costs are sourced from the “NEEP Incremental Cost Study – Phase II Final Report, Navigant, 2013” and adjusted
to account for regional labor cost differences between the Mid-Atlantic region and the state of Iowa. The Bureau of Labor
Statistics, Occupational Employment Statistics, State Occupational Employment and Wage Estimates from May 2018 were
leveraged in order to identify prevailing wage differences between the location of the original study and the state of Iowa.
Filed with the Iowa Utilities Board on September 23, 2020, EEP-2018-0002

Iowa Energy Efficiency Statewide Technical Reference Manual –3.3.14 Variable Frequency Drives for HVAC Supply
and Return Fans
Vol.3 Nonresidential Measures July 22, 2020 FINAL Page 142 of 410
HP
Cost
70-79 HP
$8,173
80-89 HP
$8,796
90-100 HP
$9,576
LOADSHAPE
Loadshape NRE04 – VFD - Supply fans
Loadshape NRE05 – VFD - Return fans
Loadshape NRE06 – VFD - Exhaust fans
Algorithm
CALCULATION OF SAVINGS
ELECTRIC ENERGY SAVINGS
292
kWh
Base
=
kWh
Retrofit
=
∆kWh
fan
=
∆kWh
total
=
Where:
= Baseline annual energy consumption (kWh/yr)
= Retrofit annual energy consumption (kWh/yr)
= Fan-only annual energy savings
= Total project annual energy savings
= Conversion factor for HP to kWh
= Nominal horsepower of controlled motor
= Load Factor; Motor Load at Fan Design CFM (Default = 65%)
293
= Installed nominal/nameplate motor efficiency
= Actual
= Annual operating hours for fan motor based on building type
292
Methodology developed and tested in Del Balso, Ryan Joseph. “Investigation into the Reliability of Energy
Efficiency/Demand Side Management Savings Estimates for Variable Frequency Drives in Commercial Applications”. A project
report submitted to the Faculty of the Graduate School of the University of Colorado, 2013.
293
Lawrence Berkeley National Laboratory, and Resource Dynamics Corporation. (2008). “Improving Motor and Drive System
Performance; A Sourcebook for Industry”. U.S. Department of Energy, Office of Energy Efficiency and Renewable Energy,
Golden, CO: National Renewable Energy Laboratory.
Filed with the Iowa Utilities Board on September 23, 2020, EEP-2018-0002

Iowa Energy Efficiency Statewide Technical Reference Manual –3.3.14 Variable Frequency Drives for HVAC Supply
and Return Fans
Vol.3 Nonresidential Measures July 22, 2020 FINAL Page 143 of 410
Default hours are provided for HVAC applications which vary by building type.
294
When
available, actual hours should be used.
Building Type
Fan Run
Hours
Convenience*
4630
Education
3544
Grocery
8743
Health
3478
Hospital
4570
Industrial*
2850
Lodging
3909
Multifamily
8760
Office - Large
2662
Office - Small
7667
Religious*
2412
Restaurant
7300
Retail - Large*
4065
Retail - Small
7410
Warehouse*
2920
Nonresidential Average
295
4978
= Percentage of run-time spent within a given flow fraction range:
296
Flow Fraction
(% of design cfm)
Percent of Time at Flow Fraction
0% to 10%
0.0%
10% to 20%
1.0%
20% to 30%
5.5%
30% to 39%
15.5%
40% to 49%
22.0%
50% to 59%
25.0%
60% to 69%
19.0%
70% to 79%
8.5%
80% to 89%
3.0%
90% to 100%
0.5%
= Part load ratio for a given flow fraction range based on the baseline flow control type
(see table below)
= Part load ratio for a given flow fraction range based on the retrofit flow control type
(see table below)
294
Based on outputs from OpenStudio modeling. Building types noted by an asterisk rely on values originally derived from
eQuest modeling. In those instances, the fan hours are based on lighting hours by building type. For Fan based HVAC, fans
generally operate full speed during building occupancy whether full speed is needed or not. The time VFDs will save energy is
during building occupancy hours which corresponds most closely to lighting hours of use.
295
For weighting factors, see HVAC variable table in section 3.3.
296
Based on 2012 ASHRAE Handbook; HVAC Systems and Equipment, page 45.11, Figure 12.
Filed with the Iowa Utilities Board on September 23, 2020, EEP-2018-0002

Iowa Energy Efficiency Statewide Technical Reference Manual –3.3.14 Variable Frequency Drives for HVAC Supply
and Return Fans
Vol.3 Nonresidential Measures July 22, 2020 FINAL Page 144 of 410
Control Type
Part Load Ratio for each Flow Fraction
10%
20%
30%
40%
50%
60%
70%
80%
90%
100%
No Control or Bypass
Damper
1.00
1.00
1.00
1.00
1.00
1.00
1.00
1.00
1.00
1.00
Discharge Dampers
0.46
0.55
0.63
0.70
0.77
0.83
0.88
0.93
0.97
1.00
Outlet Damper, BI & Airfoil
Fans
0.53
0.53
0.57
0.64
0.72
0.80
0.89
0.96
1.02
1.05
Inlet Damper Box
0.56
0.60
0.62
0.64
0.66
0.69
0.74
0.81
0.92
1.07
Inlet Guide Vane, BI &
Airfoil Fans
0.53
0.56
0.57
0.59
0.60
0.62
0.67
0.74
0.85
1.00
Inlet Vane Dampers
0.38
0.40
0.42
0.44
0.48
0.53
0.60
0.70
0.83
0.99
Outlet Damper, FC Fans
0.22
0.26
0.30
0.37
0.45
0.54
0.65
0.77
0.91
1.06
Eddy Current Drives
0.17
0.20
0.25
0.32
0.41
0.51
0.63
0.76
0.90
1.04
Inlet Guide Vane, FC Fans
0.21
0.22
0.23
0.26
0.31
0.39
0.49
0.63
0.81
1.04
VFD with duct static
pressure controls
0.09
0.10
0.11
0.15
0.20
0.29
0.41
0.57
0.76
1.01
VFD with low/no duct
static pressure
0.05
0.06
0.09
0.12
0.18
0.27
0.39
0.55
0.75
1.00
Provided below are the resultant values based upon the defaults provided above:
Control Type
No Control or Bypass Damper
1.00
Discharge Dampers
0.80
Outlet Damper, BI & Airfoil Fans
0.78
Inlet Damper Box
0.69
Inlet Guide Vane, BI & Airfoil Fans
0.63
Inlet Vane Dampers
0.53
Outlet Damper, FC Fans
0.53
Eddy Current Drives
0.49
Inlet Guide Vane, FC Fans
0.39
VFD with duct static pressure controls
0.30
VFD with low/no duct static pressure
0.27
= HVAC interactive effects factor for energy (default = 15.7%)
297
SUMMER COINCIDENT PEAK DEMAND SAVINGS
kW
Base
=
kW
Retrofit
=
∆kW
fan
=
∆kW
total
=
297
Del Balso, Ryan Joseph. “Investigation into the Reliability of Energy Efficiency/Demand Side Management Savings Estimates
for Variable Frequency Drives in Commercial Applications”. A project report submitted to the Faculty of the Graduate School of
the University of Colorado, 2013.
Filed with the Iowa Utilities Board on September 23, 2020, EEP-2018-0002

Iowa Energy Efficiency Statewide Technical Reference Manual –3.3.14 Variable Frequency Drives for HVAC Supply
and Return Fans
Vol.3 Nonresidential Measures July 22, 2020 FINAL Page 145 of 410
Where:
= Baseline summer coincident peak demand (kW)
= Retrofit summer coincident peak demand (kW)
= Fan-only summer coincident peak demand impact
= Total project summer coincident peak demand impact
= The part load ratio for the average flow fraction between the peak daytime
hours during the weekday peak time period based on the baseline flow control
type (default average flow fraction during peak period = 90%)
= The part load ratio for the average flow fraction between the peak daytime
hours during the weekday peak time period based on the retrofit flow control
type (default average flow fraction during peak period = 90%)
= HVAC interactive effects factor for summer coincident peak demand
(default = 15.7%)
NATURAL GAS ENERGY SAVINGS
There are no expected fossil fuel impacts for this measure.
298
PEAK GAS SAVINGS
N/A
WATER IMPACT DESCRIPTIONS AND CALCULATION
N/A
DEEMED O&M COST ADJUSTMENT CALCULATION
N/A
MEASURE CODE: NR-HVC-VFDF-V03-200101
SUNSET DATE: 1/1/2023
298
Consider updating measure to include heating and cooling savings in future revisions.
Filed with the Iowa Utilities Board on September 23, 2020, EEP-2018-0002

Iowa Energy Efficiency Statewide Technical Reference Manual –3.3.15 Duct Insulation
Vol.3 Nonresidential Measures July 22, 2020 FINAL Page 146 of 410
3.3.15. Duct Insulation
DESCRIPTION
Energy and demand saving are realized through reductions in the building cooling and heating loads by insulting
ductwork in unconditioned areas. This measure was developed to be applicable to the following program types:
RF.
If applied to other program types, the measure savings should be verified.
DEFINITION OF EFFICIENT EQUIPMENT
The efficient condition is ductwork in unconditioned areas that has been insulated.
DEFINITION OF BASELINE EQUIPMENT
The baseline condition is the existing ductwork in unconditioned areas.
DEEMED LIFETIME OF EFFICIENT EQUIPMENT
The expected measure life is assumed to be 20 years.
299
DEEMED MEASURE COST
Per the 2008 Database for Energy-Efficiency Resources (DEER), Version 2008.2.05, “Cost Values and Summary
Documentation”, the material cost for R-3 insulation is $0.75 per square foot. The installation cost is $0.61 per
square foot. The total measure cost, therefore, is $1.36 per square foot of insulation installed. However, the actual
cost should be used when available.
LOADSHAPE
NREC01:16 – Nonresidential Cooling (by Building Type)
NREH01:16 – Nonresidential Electric Heat (by Building Type)
NREP01:16 – Nonresidential Electric Heat Pump (by Building Type)
NRGH01:16 – Nonresidential Gas Heating (by Building Type)
Algorithm
CALCULATION OF ENERGY SAVINGS
Savings should only be claimed for ductwork that exists on the exterior of the building or in uninsulated spaces.
ELECTRIC ENERGY SAVINGS
Electric energy savings is calculated as the sum of energy saved when cooling the building and energy saved when
heating the building
∆kWh = ∆kWh
cooling
+ ∆kWh
heating
If central cooling, the electric energy saved in annual cooling due to the added insulation is
299
Consistent with duct insulation measure life specified in the MidAmerican Energy Company Joint Assessment, February
2013.
Filed with the Iowa Utilities Board on September 23, 2020, EEP-2018-0002

Iowa Energy Efficiency Statewide Technical Reference Manual –3.3.15 Duct Insulation
Vol.3 Nonresidential Measures July 22, 2020 FINAL Page 147 of 410
Where:
R
existing
= Duct heat loss coefficient with existing insulation [(hr-⁰F-ft
2
)/Btu]
= Actual, must be non-zero.
R
new
= Duct heat loss coefficient with new insulation [(hr-⁰F-ft
2
)/Btu]
= Actual
Area = Area of the duct surface exposed to the unconditioned space that has been insulated
[ft
2
].
EFLH
cooling
= Equivalent Full Load Hours for Cooling [hr] are provided in Section 3.3, HVAC end use
ΔT
AVG,cooling
= Average temperature difference [⁰F] during cooling season between outdoor air
temperature and assumed 60⁰F duct supply air temperature.
300
Climate Zone
(City based upon)
OA
AVG,cooling
[°F]
301
ΔT
AVG,cooling
[°F]
Zone 5 (Burlington)
80.4
20.4
Zone 6 (Mason City)
75.2
15.2
Average / Unknown
78.6
18.6
1,000 = Conversion from Btu to kBtu
η
cooling
= Seasonal energy efficiency ratio (SEER) of cooling system (kBtu/kWh)
= Actual
If the building is heated with electric heat (resistance or heat pump), the electric energy saved in annual heating
due to the added insulation is:
Where:
EFLH
heating
= Equivalent Full Load Hours for Heating [hr] are provided in Section 4.4, HVAC end
use
ΔT
AVG,heating
= Average temperature difference [⁰F] during heating season between outdoor air
temperature and assumed 115⁰F duct supply temperature.
302
300
Leaving coil air temperatures are typically about 55⁰F. 60⁰F is used as an average temperature, recognizing that some heat
transfer occurs between the ductwork and the environment it passes through.
301
National Solar Radiation Data Base -- 1991- 2005 Update: Typical Meteorological Year 3
http://rredc.nrel.gov/solar/old_data/nsrdb/1991-2005/tmy3/by_state_and_city.html . Heating Season defined as September
17
th
through April 13
th
, cooling season defined as May 20 through August 15
th
. For cooling season, temperatures from 8AM to
8PM were used to establish average temperatures as this is when cooling systems are expected to be loaded.
302
Forced air supply temperatures are typically 130⁰F. 115⁰F is used as an average temperature, recognizing that some heat
transfer occurs between the ductwork and the environment it passes through.
Filed with the Iowa Utilities Board on September 23, 2020, EEP-2018-0002

Iowa Energy Efficiency Statewide Technical Reference Manual –3.3.15 Duct Insulation
Vol.3 Nonresidential Measures July 22, 2020 FINAL Page 148 of 410
Climate Zone
(City based upon)
OA
AVG,heating
[°F]
303
ΔT
AVG,heating
[°F]
Zone 5
(Burlington)
39.6
75.4
Zone 6
(Mason City)
30.1
84.9
Average / Unknown
35.9
79.1
3,142 = Conversion from Btu to kWh.
η
heating
= Efficiency of heating system
= Actual. Note: electric resistance heating and heat pumps will have an efficiency
greater than or equal to 100%
If the building is heated with a gas furnace, there will be some electric savings in heating the building attributed to
extra insulation since the furnace fans will run less.
∆kWh
heating
= ∆Therms * Fe * 29.3
Where:
∆Therms = Gas savings calculated with equation below.
Fe = Percentage of heating energy consumed by fans, assume 3.14%
304
29.3 = Conversion from therms to kWh
303
National Solar Radiation Data Base -- 1991- 2005 Update: Typical Meteorological Year 3
http://rredc.nrel.gov/solar/old_data/nsrdb/1991-2005/tmy3/by_state_and_city.html . Heating Season defined as September
17
th
through April 13
th
, cooling season defined as May 20 through August 15
th
. For cooling season, temperatures from 8AM to
8PM were used to establish average temperatures as this is when cooling systems are expected to be loaded.
304
F
e
is not one of the AHRI certified ratings provided for furnaces, but can be reasonably estimated from a calculation based
on the certified values for fuel energy (Ef in MMBtu/yr) and Eae (kWh/yr). An average of a 300 record sample (non-random)
out of 1495 was 3.14% for residential units. This is, appropriately, ~50% greater than the Energy Star version 3 criteria for 2%
F
e
. See “Programmable Thermostats Furnace Fan Analysis.xlsx” for reference. Assumed to be consistent with C&I applications.
For example, 100 ft
2
of duct surface with a pre-insulation R-value of 3.5 is insulated in an existing small retail
building in unknown location with 10.5 SEER central AC, and 1.92COP heat pump system, and the duct R-value
with new insulation is 10.0:
ΔkWh = ΔkWh
cooling
+ ΔkWh
heating
= ((1/3.5 – 1/10.0) * 100 * 780 * 18.6 / (1,000 * 10.5)) + ((1/3.5 – 1/10.0) * 100 * 1,372 * 79.1/
(3,412 * 1.92))
= 22.2 + 266.2
= 288.4 kWh
For example, 100 ft
2
of duct surface with a pre-insulation R-value of 3.5 is insulated in an existing small retail
building in unknown location with a gas furnace with system efficiency of 70%, and the duct R-value with new
insulation is 10.0:
ΔkWh = 24.9 * 0.0314 * 29.3
= 22.9 kWh
Filed with the Iowa Utilities Board on September 23, 2020, EEP-2018-0002

Iowa Energy Efficiency Statewide Technical Reference Manual –3.3.15 Duct Insulation
Vol.3 Nonresidential Measures July 22, 2020 FINAL Page 149 of 410
SUMMER COINCIDENT PEAK DEMAND SAVINGS
Where:
EFLH
cooling
= Equivalent full load hours of air conditioning are provided in Section 3.3, HVAC end use
CF = Summer System Peak Coincidence Factor for Cooling (dependent on building type)
Building Type
CF
305
Model Source
Convenience
92.3%
eQuest
Education
96.7%
OpenStudio
Grocery
100.0%
OpenStudio
Health
100.0%
OpenStudio
Hospital
98.6%
OpenStudio
Industrial
44.6%
eQuest
Lodging
97.4%
OpenStudio
Multifamily
100.0%
OpenStudio
Office - Large
98.8%
OpenStudio
Office - Small
100.0%
OpenStudio
Religious
94.3%
eQuest
Restaurant
99.6%
OpenStudio
Retail - Large
87.6%
eQuest
Retail - Small
100.0%
OpenStudio
Warehouse
77.9%
eQuest
Nonresidential Average
306
92.3%
N/A
NATURAL GAS SAVINGS
If building uses a gas heating system, the savings resulting from the insulation is calculated with the following
formula.
Where:
R
existing
= Duct heat loss coefficient with existing insulation
[(hr-⁰F-ft
2
)/Btu]
R
new
= Duct heat loss coefficient with new insulation [(hr-⁰F-ft
2
)/Btu]
Area = Area of the duct surface exposed to the unconditioned space that has been insulated
[ft
2
].
305
This calculation is the total savings in peak hour demand divided by the total savings in absolute peak demand, from models.
306
For weighting factors, see HVAC variable table in section 3.3.
For example, 100 ft
2
of duct surface with a pre-insulation R-value of 3.5 is insulated in an existing small retail
building in unknown location with 10.5 SEER central cooling, and the duct R-value with new insulation is 10.0:
ΔkW = 22.2 / 780 * 1.00
= 0.0280 kW
Filed with the Iowa Utilities Board on September 23, 2020, EEP-2018-0002

Iowa Energy Efficiency Statewide Technical Reference Manual –3.3.15 Duct Insulation
Vol.3 Nonresidential Measures July 22, 2020 FINAL Page 150 of 410
EFLH
cooling
= Equivalent Full Load Hours for Cooling [hr] are provided in Section 3.3, HVAC end use
ΔT
AVG,heating
= Average temperature difference [⁰F] during heating season (see above)
100,000 = Conversion from BTUs to Therms
η
heat
= Efficiency of heating system
= Actual
PEAK GAS SAVINGS
Where:
ΔTherms = Therm impact calculated above
GCF = Gas Coincidence Factor for Heating
Building Type
GCF
307
Model Source
Convenience
0.016482
eQuest
Education
0.011480
OpenStudio
Grocery
0.013083
OpenStudio
Health
0.010179
OpenStudio
Hospital
0.015543
OpenStudio
Industrial
0.014296
eQuest
Lodging
0.013205
OpenStudio
Multifamily
0.012268
OpenStudio
Office - Large
0.013082
OpenStudio
Office - Small
0.016718
OpenStudio
Religious
0.011964
eQuest
Restaurant
0.015262
OpenStudio
Retail - Large
0.013281
eQuest
Retail - Small
0.014055
OpenStudio
Warehouse
0.015677
eQuest
Nonresidential Average
308
0.014658
N/A
307
Calculated as the percentage of total savings in the maximum saving day, from models.
308
For weighting factors, see HVAC variable table in section 3.3.
For example, 100 ft
2
of duct surface with a pre-insulation R-value of 3.5 is insulated in an existing small retail
building in unknown location with a gas furnace with system efficiency of 70%, and the duct R-value with new
insulation is 10.0:
ΔTherms = ((1/3.5 – 1/8.0) * 100 * 1,372 * 79.1/ (100,000 * 0.70))
= 24.9 therms
For example, 100 ft
2
of duct surface with a pre-insulation R-value of 3.5 is insulated in a small retail building in
unknown location with a gas furnace with system efficiency of 70%, and the duct R-value with new insulation is
10.0:
ΔPeakTherms = 24.9 * 0.0140550
= 0.3500 therms
Filed with the Iowa Utilities Board on September 23, 2020, EEP-2018-0002

Iowa Energy Efficiency Statewide Technical Reference Manual –3.3.15 Duct Insulation
Vol.3 Nonresidential Measures July 22, 2020 FINAL Page 151 of 410
WATER IMPACT DESCRIPTIONS AND CALCULATION
N/A
DEEMED O&M COST ADJUSTMENT CALCULATION
N/A
MEASURE CODE: NR-HVC-DUCT-V02-200101
SUNSET DATE: 1/1/2022
Filed with the Iowa Utilities Board on September 23, 2020, EEP-2018-0002

Iowa Energy Efficiency Statewide Technical Reference Manual –3.3.16 Duct Repair and Sealing
Vol.3 Nonresidential Measures July 22, 2020 FINAL Page 152 of 410
3.3.16. Duct Repair and Sealing
DESCRIPTION
Air leaks in ductwork passing through exterior spaces are sealed through strategic use and location of air-tight
materials. An estimate of savings is provided in two ways. It is highly recommended that leaks be detected and pre-
and post-sealing leakage rates measured by qualified/certified HVAC professionals
309
. Where this occurs, an
algorithm is provided to estimate the site specific savings. Where test in/test out has not occurred, a conservative
deemed assumption is provided.
This measure was developed to be applicable to the following program types: RF.
If applied to other program types, the measure savings should be verified.
DEFINITION OF EFFICIENT EQUIPMENT
Air sealing materials and diagnostic testing should meet all eligibility program qualification criteria. The initial and
final tested leakage rates should be assessed in such a manner that the identified reductions can be properly
discerned, particularly in situations wherein multiple building envelope measures may be implemented
simultaneously.
DEFINITION OF BASELINE EQUIPMENT
The existing duct leakage to exterior, unconditioned spaces should be determined through approved and
appropriate test methods using a blower door and/or duct blasting. The baseline condition of the ductwork upon
first inspection significantly affects the opportunity for cost-effective energy savings through air-sealing.
DEEMED LIFETIME OF EFFICIENT EQUIPMENT
The expected measure life is assumed to be 15 years.
310
DEEMED MEASURE COST
The actual capital cost for this measure should be used in screening.
LOADSHAPE
NREC01:16 – Nonresidential Cooling (by Building Type)
NREH01:16 – Nonresidential Electric Heat (by Building Type)
NREP01:16 – Nonresidential Electric Heat Pump (by Building Type)
NRGH01:16 – Nonresidential Gas Heating (by Building Type)
Algorithm
CALCULATION OF SAVINGS
ELECTRIC ENERGY SAVINGS
Test In / Test Out Approach
309
In order for leakage rates to be considered accurate, performance testing must be carried out be a professional with a high
level of experience in the C&I building sector.
310
Measure Life Report, Residential and Commercial/Industrial Lighting and HVAC Measures, GDS Associates, 2007.
Filed with the Iowa Utilities Board on September 23, 2020, EEP-2018-0002

Iowa Energy Efficiency Statewide Technical Reference Manual –3.3.16 Duct Repair and Sealing
Vol.3 Nonresidential Measures July 22, 2020 FINAL Page 153 of 410
Where:
= If central cooling, reduction in annual cooling requirement due to air sealing
CFM
Pre
= Average duct leakage to exterior at normal operating conditions as estimated by
professional testing before air sealing
= Actual
311
CFM
Post
= Average duct leakage to exterior at normal operating conditions as estimated by
professional testing after air sealing
= Actual
60 = Converts Cubic Feet per Minute to Cubic Feet per Hour
EFLH
cooling
= Equivalent Full Load Hours for Cooling [hr] are provided in Section 3.3, HVAC end use
ΔT
AVG,cooling
= Average temperature difference [⁰F] during cooling season between outdoor air
temperature and assumed 60⁰F duct supply air temperature:
312
Climate Zone
(City based upon)
OA
AVG,cooling
[°F]
313
ΔT
AVG,cooling
[°F]
Zone 5 (Burlington)
80.4
20.4
Zone 6 (Mason City)
75.2
15.2
Average / Unknown
78.6
18.6
0.018 = Specific Heat Capacity of Air (Btu/ft
3
*°F)
LM = Latent multiplier to account for latent cooling demand
= dependent on location:
314
Climate Zone (City based upon)
LM
Zone 5 (Burlington)
5.0
Zone 6 (Mason City)
5.9
Average/ unknown
5.2
1000 = Converts Btu to kBtu
η
cooling
= Seasonal energy efficiency ratio (SEER) of cooling system (kBtu/kWh)
= Actual
311
This savings estimate assumes that any conditioned air leaked through exterior ducting will need to subsequently be made
up with outside air. CFM calculations should be performed and provided by a qualified HVAC professional.
312
Leaving coil air temperatures are typically about 55⁰F. 60⁰F is used as an average temperature, recognizing that some heat
transfer occurs between the ductwork and the environment it passes through.
313
National Solar Radiation Data Base -- 1991- 2005 Update: Typical Meteorological Year 3
http://rredc.nrel.gov/solar/old_data/nsrdb/1991-2005/tmy3/by_state_and_city.html . Heating Season defined as September
17
th
through April 13
th
, cooling season defined as May 20 through August 15
th
. For cooling season, temperatures from 8AM to
8PM were used to establish average temperatures as this is when cooling systems are expected to be loaded.
314
The Latent Multiplier is used to convert the sensible cooling savings calculated to a value representing sensible and latent
cooling loads, again assuming outside makeup air. The values are derived from the methodology outlined in Infiltration Factor
Calculation Methodology by Bruce Harley, Senior Manager, Applied Building Science, CLEAResult 11/18/2015.
Filed with the Iowa Utilities Board on September 23, 2020, EEP-2018-0002

Iowa Energy Efficiency Statewide Technical Reference Manual –3.3.16 Duct Repair and Sealing
Vol.3 Nonresidential Measures July 22, 2020 FINAL Page 154 of 410
= If electric heat (resistance or heat pump), reduction in annual electric heating due to
air sealing
EFLH
heating
= Equivalent Full Load Hours for Heating [hr] are provided in Section 3.3, HVAC end
use
ΔT
AVG,heating
= Average temperature difference [⁰F] during heating season between outdoor air
temperature and assumed 115⁰F duct supply temperature:
315
Climate Zone
(City based upon)
OA
AVG,heating
[°F]
316
ΔT
AVG,heating
[°F]
Zone 5 (Burlington)
39.6
75.4
Zone 6 (Mason City)
30.1
84.9
Average / Unknown
35.9
79.1
3,142 = Conversion from Btu to kWh.
η
heating
= Efficiency of heating system
= Actual. Note: electric resistance heating and heat pumps will have an efficiency
greater than or equal to 100%
Conservative Deemed Approach
Where:
SavingsPerUnit = Annual savings per linear foot, dependent on heating / cooling equipment
317
Note: savings factors are additive. For example, a building with both heating and cooling
provided by heat pumps would save (1.64+3.27) = 4.91 kWh/ft
End Use
HVAC System
SavingsPerUnit (kWh/ft)
Cooling DX
Air Conditioning
1.64
315
Forced air supply temperatures are typically 130⁰F. 115⁰F is used as an average temperature, recognizing that some heat
transfer occurs between the ductwork and the environment it passes through.
316
National Solar Radiation Data Base -- 1991- 2005 Update: Typical Meteorological Year 3
http://rredc.nrel.gov/solar/old_data/nsrdb/1991-2005/tmy3/by_state_and_city.html . Heating Season defined as September
17
th
through April 13
th
, cooling season defined as May 20 through August 15
th
. For cooling season, temperatures from 8AM to
8PM were used to establish average temperatures as this is when cooling systems are expected to be loaded.
317
The values in the table represent estimates that are half those provided by Cadmus for the Joint Assessment, based on
building simulations performed. The conservative estimate is more appropriate for a deemed estimate. These values should be
re-evaluated if EM&V values provide support for a higher deemed estimate.
For example, an existing small retail building (2,000 Sq) Ft in unknown location with 10.5 SEER central cooling
and a heat pump system with COP of 1.92, with pre- and post-sealing natural infiltration rates of 40 and 25
CFM, respectively:
ΔkWh = ΔkWh
cooling
+ ΔkWh
heating
= [((40 – 25) * 60 * 780 * 18.6 * 0.018 * 5.2) / (1000 * 10.5)] +
[((40 – 25) * 60 * 13721608 * 79.1 * 0.018) / (1.92 * 3,412)]
= 116 + 268
= 384 kWh
Filed with the Iowa Utilities Board on September 23, 2020, EEP-2018-0002

Iowa Energy Efficiency Statewide Technical Reference Manual –3.3.16 Duct Repair and Sealing
Vol.3 Nonresidential Measures July 22, 2020 FINAL Page 155 of 410
End Use
HVAC System
SavingsPerUnit (kWh/ft)
Space Heat
Electric
Resistance/Furnace
5.00
Heat Pump - Cooling
Heat Pump
1.64
Heat Pump - Heating
Heat Pump
3.27
L
Duct
= Linear footage of exterior ductwork sealed
= Actual
Additional Fan savings
= If gas furnace heat, kWh savings for reduction in fan run time
= ΔTherms * F
e
* 29.3
F
e
= Furnace Fan energy consumption as a percentage of annual fuel consumption
= 3.14%
318
29.3 = kWh per therm
SUMMER COINCIDENT PEAK DEMAND SAVINGS
Where:
EFLH
cooling
= Equivalent full load hours of air conditioning are provided in Section 3.3, HVAC end use
CF = Summer System Peak Coincidence Factor for Cooling (dependent on building type)
Building Type
CF
319
Model Source
Convenience
92.3%
eQuest
Education
96.7%
OpenStudio
Grocery
100.0%
OpenStudio
Health
100.0%
OpenStudio
Hospital
98.6%
OpenStudio
Industrial
44.6%
eQuest
Lodging
97.4%
OpenStudio
Multifamily
100.0%
OpenStudio
Office - Large
98.8%
OpenStudio
Office - Small
100.0%
OpenStudio
Religious
94.3%
eQuest
318
F
e
is not one of the AHRI certified ratings provided for residential furnaces, but can be reasonably estimated from a
calculation based on the certified values for fuel energy (Ef in MMBtu/yr) and Eae (kWh/yr). An average of a 300 record sample
(non-random) out of 1495 was 3.14%. This is, appropriately, ~50% greater than the ENERGY STAR version 3 criteria for 2% F
e
.
See “Furnace Fan Analysis.xlsx” for reference.
319
This calculation is the total savings in peak hour demand divided by the total savings in absolute peak demand.
For example, restaurant in Burlington with a gas furnace with system efficiency of 70%, with pre- and post-
sealing natural infiltration rates of 40 and 25 CFM, respectively:
ΔkWh = 17.9 * 0.0314 * 29.3
= 16.5 kWh
Filed with the Iowa Utilities Board on September 23, 2020, EEP-2018-0002

Iowa Energy Efficiency Statewide Technical Reference Manual –3.3.16 Duct Repair and Sealing
Vol.3 Nonresidential Measures July 22, 2020 FINAL Page 156 of 410
Building Type
CF
319
Model Source
Restaurant
99.6%
OpenStudio
Retail - Large
87.6%
eQuest
Retail - Small
100.0%
OpenStudio
Warehouse
77.9%
eQuest
Nonresidential Average
320
92.3%
N/A
NATURAL GAS SAVINGS
Test In / Test Out Approach
If Natural Gas heating:
Where:
100,000 = Conversion from BTUs to Therms
Other factors as defined above.
Conservative Deemed Approach
Where:
SavingsPerUnit = Annual savings per linear foot, dependent on heating / cooling equipment:
321
End Use
HVAC System
SavingsPerUnit (Therms/ft)
Space Heat Boiler
Gas Boiler*
0.26
Space Heat Furnace
Gas Furnace
0.26
*Note: in instances where boilers supply heat to terminal units or VAV boxes that are already inside
conditioned space, savings should not be claimed, as not conditioned air is not passing through
exterior ductwork.
L
Duct
= Linear footage of exterior ductwork sealed
320
For weighting factors, see HVAC variable table in section 3.3.
321
The values in the table represent estimates of savings from a 3% improvement in total usage. The values are half those
provided by Cadmus for the Joint Assessment, based on building simulations performed. The conservative estimate is more
appropriate for a deemed estimate. These values should be re-evaluated if EM&V values provide support for a higher deemed
estimate.
For example, an existing small retail building (2,000 Sq) Ft in unknown location with 10.5 SEER central cooling
and a heat pump system with COP of 1.92, with pre- and post-sealing natural infiltration rates of 40 and 25 CFM,
respectively:
ΔkW = 116 / 780 * 1.00
= 0.15 kW
For example, an existing restaurant in Burlington with a gas furnace with system efficiency of 70%, with pre-
and post-sealing natural infiltration rates of 40 and 25 CFM, respectively:
ΔTherms = ((40 – 25) * 60 * 1040 * 75.4 * 0.018) / (0.70 * 100,000)
= 17.9 therms
Filed with the Iowa Utilities Board on September 23, 2020, EEP-2018-0002

Iowa Energy Efficiency Statewide Technical Reference Manual –3.3.16 Duct Repair and Sealing
Vol.3 Nonresidential Measures July 22, 2020 FINAL Page 157 of 410
= Actual
PEAK GAS SAVINGS
Where:
ΔTherms = Therm impact calculated above
GCF = Gas Coincidence Factor for Heating
Building Type
GCF
322
Model Source
Convenience
0.016482
eQuest
Education
0.011480
OpenStudio
Grocery
0.013083
OpenStudio
Health
0.010179
OpenStudio
Hospital
0.015543
OpenStudio
Industrial
0.014296
eQuest
Lodging
0.013205
OpenStudio
Multifamily
0.012268
OpenStudio
Office - Large
0.013082
OpenStudio
Office - Small
0.016718
OpenStudio
Religious
0.011964
eQuest
Restaurant
0.015262
OpenStudio
Retail - Large
0.013281
eQuest
Retail - Small
0.014055
OpenStudio
Warehouse
0.015677
eQuest
Nonresidential Average
323
0.014658
N/A
WATER IMPACT DESCRIPTIONS AND CALCULATION
N/A
DEEMED O&M COST ADJUSTMENT CALCULATION
N/A
MEASURE CODE: NR-HVC-DCTS-V02-200101
SUNSET DATE: 1/1/2022
322
Calculated as the percentage of total savings in the maximum saving day, from models.
323
For weighting factors, see HVAC variable table in section 3.3.
For example, restaurant in Burlington with a gas furnace with system efficiency of 70%, with pre- and post-
sealing natural infiltration rates of 40 and 25 CFM, respectively:
∆PeakTherms = 17.9 * 0.0152620
= 0.2732 therms
Filed with the Iowa Utilities Board on September 23, 2020, EEP-2018-0002

Iowa Energy Efficiency Statewide Technical Reference Manual –3.3.17 Chiller Pipe Insulation
Vol.3 Nonresidential Measures July 22, 2020 FINAL Page 158 of 410
3.3.17. Chiller Pipe Insulation
DESCRIPTION
Energy and demand saving are realized through reductions in the building cooling loads by insulating chiller piping
that passes through unconditioned areas.
This measure was developed to be applicable to the following program types: RF.
If applied to other program types, the measure savings should be verified.
DEFINITION OF EFFICIENT EQUIPMENT
The efficient condition is chiller piping in unconditioned areas that has been insulated.
DEFINITION OF BASELINE EQUIPMENT
The baseline condition is the existing chiller piping in unconditioned areas.
DEEMED LIFETIME OF EFFICIENT EQUIPMENT
The measure life is assumed to be 15 years.
324
DEEMED MEASURE COST
The incremental measure cost for insulation is the full cost of adding insulation to the pipe. Actual installation costs
should be used for the measure cost. For planning purposes, the following costs can be used to estimate the full cost
of materials and labor, based on RS Means pricing.
325
The following table summarizes the estimated costs for this
measure per foot of insulation added and include installation costs:
Insulation Thickness
1 Inch
2 Inches
Pipe- RS Means #
220719.10.5170
220719.10.5530
Jacket- RS Means #
220719.10.0156
220719.10.0320
Jacket Type
PVC
Aluminum
Insulation Cost per foot
$9.40
$13.90
Jacket Cost per foot
$4.57
$7.30
Total Cost per foot
$13.97
$21.20
LOADSHAPE
NREC01:16 – Nonresidential Cooling (by Building Type)
Algorithm
CALCULATION OF ENERGY SAVINGS
Savings should only be claimed for chiller piping that exists on the exterior of the building or in uninsulated spaces.
ELECTRIC ENERGY SAVINGS
The electric energy saved in annual cooling due to the added insulation is:
324
Measure Life Report, Residential and Commercial/Industrial Lighting and HVAC Measures, GDS Associates, June 2007.
http://neep.org/uploads/EMV%20Forum/EMV%20Studies/measure_life_GDS%5B1%5D.pdf
325
RS Means 2008. Mechanical Cost Data, pages 106 to 119
Filed with the Iowa Utilities Board on September 23, 2020, EEP-2018-0002
Iowa Energy Efficiency Statewide Technical Reference Manual –3.3.17 Chiller Pipe Insulation
Vol.3 Nonresidential Measures July 22, 2020 FINAL Page 159 of 410
Where:
L
SP
= Length of straight pipe to be insulated (linear foot)
= actual installed (linear foot)
L
OC
= Total equivalent length of the other components (valves and tees) of pipe to be
insulated
= See following table “Equivalent Length of Other Components – Elbows and Tees” for
equivalent lengths. The total equivalent length is equal to the sum of equivalent lengths
for each component; e.g., five 1” straight tee components has a total equivalent length of
(5 x .38ft) = 1.9ft.
Equivalent Length of Other Components – Elbows and Tees (L
oc
)
Nominal Pipe
Diameter
Equivalent Length of Other Components (ft)
90 Degree Elbow
Straight Tee
1”
0.30
0.38
2”
0.66
0.63
EFLH
cooling
= Equivalent Full Load Hours for Cooling [hr] are provided in Section 3.3, HVAC end use
HG
Base/Eff
= Average heat gain factor [BTU/hr/ft] for the baseline and efficient cases, respectively.
= Based on insulation thickness as shown in the following table:
326
Insulation Thickness [in.]
Average Heat Gain [BTU/hr/ft]
Bare
47.100
0.5
14.413
1
9.063
1.5
6.973
2
5.798
2.5
5.038
3
4.450
3.5
4.068
4
3.768
4.5
3.475
5
3.288
5.5
3.130
6
2.990
6.5
2.875
7
2.770
7.5
2.680
8
2.600
8.5
2.523
9
2.455
9.5
2.398
10
2.340
326
Based on simulation results from 3E Plus v4.1. Values are the average of 850F MF Blanket, Type IV, C553-11 and 450F MF
BLANKET, Type II, C553-11 insulation types and assume working temperatures of 68F ambient and 40F process. See reference
workbook titled “Chiller Pipe Simulation Factors.xlsx” for additional details.
Filed with the Iowa Utilities Board on September 23, 2020, EEP-2018-0002

Iowa Energy Efficiency Statewide Technical Reference Manual –3.3.17 Chiller Pipe Insulation
Vol.3 Nonresidential Measures July 22, 2020 FINAL Page 160 of 410
1,000 = Conversion from Btu to kBtu
η
cooling
= Energy efficiency ratio (EER) of cooling system (kBtu/kWh)
= Actual. If not directly specified, EER may be calculated from other commonly listed
efficiency ratings (kW/ton or COP):
EER = 12 / kW/ton
EER = COP x 3.412
SUMMER COINCIDENT PEAK DEMAND SAVINGS
Where:
EFLH
cooling
= Equivalent full load hours of air conditioning are provided in Section 3.3, HVAC end use
CF = Summer System Peak Coincidence Factor for Cooling (dependent on building type)
Building Type
CF
327
Model Source
Convenience
92.3%
eQuest
Education
96.7%
OpenStudio
Grocery
100.0%
OpenStudio
Health
100.0%
OpenStudio
Hospital
98.6%
OpenStudio
Industrial
44.6%
eQuest
Lodging
97.4%
OpenStudio
Multifamily
100.0%
OpenStudio
Office - Large
98.8%
OpenStudio
Office - Small
100.0%
OpenStudio
Religious
94.3%
eQuest
Restaurant
99.6%
OpenStudio
Retail - Large
87.6%
eQuest
Retail - Small
100.0%
OpenStudio
Warehouse
77.9%
eQuest
Nonresidential Average
328
92.3%
N/A
327
This calculation is the total savings in peak hour demand divided by the total savings in absolute peak demand, from
models.
328
For weighting factors, see HVAC variable table in section 3.3.
For example, 3” thick insulation is installed on 100 feet of 2” diameter, bare straight pipe with 5 straight tee
components in an existing industrial building in unknown location with a 12.0 EER cooling system:
ΔkWh = ΔkWh
cooling
= ((100 + 3.2) * 1,063 * (47.100 - 4.450)) / (1,000 *12)
= 389.9 kWh
Filed with the Iowa Utilities Board on September 23, 2020, EEP-2018-0002

Iowa Energy Efficiency Statewide Technical Reference Manual –3.3.17 Chiller Pipe Insulation
Vol.3 Nonresidential Measures July 22, 2020 FINAL Page 161 of 410
NATURAL GAS SAVINGS
N/A
PEAK GAS SAVINGS
N/A
WATER IMPACT DESCRIPTIONS AND CALCULATION
N/A
DEEMED O&M COST ADJUSTMENT CALCULATION
N/A
MEASURE CODE: NR-HVC-CPIN-V03-200101
SUNSET DATE: 1/1/2022
For example, 3” thick insulation is installed on 100 feet of 2” diameter, bare straight pipe with 5 straight tee
components in an industrial building in unknown location with a 12.0 EER cooling system:
ΔkW = 389.9/1,063 * 0.446
= 0.1636 kW
Filed with the Iowa Utilities Board on September 23, 2020, EEP-2018-0002

Iowa Energy Efficiency Statewide Technical Reference Manual –3.3.18 Hydronic Heating Pipe Insulation
Vol.3 Nonresidential Measures July 22, 2020 FINAL Page 162 of 410
3.3.18. Hydronic Heating Pipe Insulation
DESCRIPTION
This measure provides rebates for installation of ≥1” or ≥2” fiberglass, foam, calcium silicate or other types of
insulation with similar insulating properties to existing bare pipe on straight piping as well as other pipe components
such as elbows, tees, valves, and flanges for all Nonresidential installations.
Savings estimates are provided for the both exposed indoor or above ground outdoor piping distributing fluid in the
following system types (natural gas fired systems only):
• Hydronic heating systems (with or without outdoor reset controls), including:
o boiler systems that do not circulate water around a central loop and operate upon demand from
a thermostat (“non-recirculation”)
o systems that recirculate during heating season only (“Recirculation – heating season only”)
o systems recirculating year round (“Recirculation – year round”)
• Low and high-pressure steam systems
o non-recirculation
o recirculation - heating season only
o recirculation - year round
Process piping can also use the algorithms provided but requires custom entry of hours.
Minimum qualifying nominal pipe diameter is 1”. Indoor piping must have at least 1” of insulation and outdoor piping
must have at least 2” of insulation and include an all-weather protective jacket. New advanced insulating materials
may be thinner and savings can be calculated with 3E Plus.
This measure was developed to be applicable to the following program types: RF, DI
If applied to other program types, the measure savings should be verified.
DEFINITION OF EFFICIENT EQUIPMENT
The efficient case is installing pipe wrap insulation to a length of pipe. Indoor piping must have at least 1” of
insulation (or equivalent R-value) and outdoor piping must have at least 2” of insulation (or equivalent R-value) and
include an all-weather protective jacket. Minimum qualifying pipe diameter is 1”. Insulation must be continuous and
contiguous over fittings that directly connect to straight pipe, including elbows and tees.
329
DEFINITION OF BASELINE EQUIPMENT
The base case for savings estimates is a bare pipe. Pipes are required by new construction code to be insulated but
are still commonly found uninsulated in older commercial buildings.
DEEMED LIFETIME OF EFFICIENT EQUIPMENT
The measure life is assumed to be 15 years.
330
DEEMED MEASURE COST
Actual costs should be used if known. Otherwise the deemed measure costs below based on RS Means
331
pricing
reference materials may be used.
332
The following table summarizes the estimated costs for this measure per foot
329
ASHRAE Handbook—Fundamentals, 23.14; Hart, G., “Saving energy by insulating pipe components on steam and hot water
distribution systems”, ASHRAE Journal, October 2011
330
Measure Life Report, Residential and Commercial/Industrial Lighting and HVAC Measures, GDS Associates, June 2007.
http://neep.org/uploads/EMV%20Forum/EMV%20Studies/measure_life_GDS%5B1%5D.pdf
331
RS Means 2008. Mechanical Cost Data, pages 106 to 119
332
RS Means 2010: “for fittings, add 3 linear feet for each fitting plus 4 linear feet for each flange of the fitting”
Filed with the Iowa Utilities Board on September 23, 2020, EEP-2018-0002

Iowa Energy Efficiency Statewide Technical Reference Manual –3.3.18 Hydronic Heating Pipe Insulation
Vol.3 Nonresidential Measures July 22, 2020 FINAL Page 163 of 410
of insulation added and include installation costs:
Insulation Thickness
1 Inch (Indoor)
2 Inches (Outdoor)
Pipe- RS Means #
220719.10.5170
220719.10.5530
Jacket- RS Means #
220719.10.0156
220719.10.0320
Jacket Type
PVC
Aluminum
Insulation Cost per foot
$9.40
$13.90
Jacket Cost per foot
$4.57
$7.30
Total Cost per foot
$13.97
$21.20
LOADSHAPE
Loadshape NRGH01:16 – Nonresidential Gas Heating (by Building Type)
Loadshape NRGB01:16 – Nonresidential Gas Heat and Hot Water (by Building Type)
Algorithm
CALCULATION OF ENERGY SAVINGS
ELECTRIC ENERGY SAVINGS
N/A
SUMMER COINCIDENT PEAK DEMAND SAVINGS
N/A
NATURAL GAS ENERGY SAVINGS
Where:
L
SP
= Length of straight pipe to be insulated (linear foot)
= actual installed (linear foot)
L
OC
= Total equivalent length of the other components (valves and tees) of pipe to be
insulated
= See following table “Equivalent Length of Other Components – Elbows and Tees” for
equivalent lengths. The total equivalent length is equal to the sum of equivalent lengths
for each component; e.g., five 1” straight tee components has a total equivalent length of
(5 x .38ft) = 1.9ft.
Equivalent Length of Other Components – Elbows and Tees (L
oc
)
Nominal Pipe
Diameter
Equivalent Length of Other Components (ft)
90 Degree Elbow
Straight Tee
1”
0.30
0.38
2”
0.66
0.63
EFLH
heating
= Equivalent Full Load Hours for heating [hr] are provided in Section 3.3, HVAC end use
Q
Base
- Q
Eff
= Difference in heat loss rate due to the added insulation [BTU/hr/ft]
Filed with the Iowa Utilities Board on September 23, 2020, EEP-2018-0002

Iowa Energy Efficiency Statewide Technical Reference Manual –3.3.18 Hydronic Heating Pipe Insulation
Vol.3 Nonresidential Measures July 22, 2020 FINAL Page 164 of 410
= Based on system type and location of the piping as shown in the following table:
333
Pipe
Location
System Type
Qbase – Qeff
(Btu/hr/ft)
Indoor
Hot Water Space Heating - Without Outdoor Reset
90
Hot Water Space Heating- With Outdoor Reset, Heating Season Only
61
Hot Water Space Heating - With Outdoor Reset, Year-Round
45
Low Pressure Steam
192
High Pressure Steam
362
Outdoor
Hot Water Space Heating - Without Outdoor Reset
439
Hot Water Space Heating- With Outdoor Reset, Heating Season Only
347
Hot Water Space Heating - With Outdoor Reset, Year-Round
293
Low Pressure Steam
678
High Pressure Steam
1049
100,000 = Conversion from Btu to Therms
η
heat
= Efficiency of heating system
= Actual. If unknown, assume the following:
= 82% for a hot water boiler or 80% for a steam boiler
334
TRF = Thermal Regain Factor for space type, applied only to space heating energy and is
applied to values resulting from Δtherms/ft tables below
335
= See table below for base TRF values by pipe location
May vary seasonally such as: TRF[summer] * summer hours + TRF[winter] * winter hours,
where TRF values reflecting summer and winter conditions are apportioned by the hours
for those conditions. TRF may also be adjusted by building specific balance temperature
and operating hours above and below that balance temperature.
336
Pipe Location
Assumed
Regain
TRF, Thermal
Regain Factor
Outdoor
0%
1.0
Indoor, heated space
85%
0.15
Indoor, semi- heated, (unconditioned space, with
heat transfer to conditioned space. E.g.: boiler
room, ceiling plenum, basement, crawlspace, wall)
30%
0.70
Indoor, unheated, (no heat transfer to conditioned
space)
0%
1.0
333
The heat loss estimates (Q
base
and Q
eff
) were developed using the 3E Plus v4.0 software program, a heat loss calculation
software provided by the NAIMA (North American Insulation Manufacturer Association). The energy savings analysis is based
on adding 1-inch (indoor) or 2-inch (outdoor) thick insulation around bare pipe. See reference workbook titled “Hydronic
Heating Pipe Insulation.xlsx” for additional details and assumptions.
334
Code of Federal Regulations for gas-fired hot water and steam boilers < 300,000 Btu/h and manufactured after September 1,
2012 and before January 15, 2021 (10 CFR 430.32(e)(2)).. Effective January 15, 2021 the new federal compliance standard for
boilers increases to an AFUE of 84%; however, because this is a retrofit measure, these standards are not applicable to the
efficiency of the existing boiler..
335
Thermal regain for residential pipe insulation measures is discussed in Home Energy Services Impact Evaluation, prepared for
the Massachusetts Residential Retrofit and Low Income Program Area Evaluation, Cadmus Group, Inc., August 2012 and
Andrews, John, Better Duct Systems for Home Heating and Cooling, U.S. Department of Energy, 2001. Recognizing the
differences between residential and commercial heating systems, the factors have been adjusted based on professional
judgment. This factor would benefit from additional study and evaluation.
336
Thermal Regain Factor_4-30-14.docx
Filed with the Iowa Utilities Board on September 23, 2020, EEP-2018-0002
Iowa Energy Efficiency Statewide Technical Reference Manual –3.3.18 Hydronic Heating Pipe Insulation
Vol.3 Nonresidential Measures July 22, 2020 FINAL Page 165 of 410
Pipe Location
Assumed
Regain
TRF, Thermal
Regain Factor
Location not specified
85%
0.15
Custom
Custom
1 – assumed regain
PEAK GAS SAVINGS
Where:
ΔTherms = Therm impact calculated above
GCF = Gas Coincidence Factor for Heating
Building Type
GCF
337
Model Source
Convenience
0.016482
eQuest
Education
0.011480
OpenStudio
Grocery
0.013083
OpenStudio
Health
0.010179
OpenStudio
Hospital
0.015543
OpenStudio
Industrial
0.014296
eQuest
Lodging
0.013205
OpenStudio
Multifamily
0.012268
OpenStudio
Office - Large
0.013082
OpenStudio
Office - Small
0.016718
OpenStudio
Religious
0.011964
eQuest
Restaurant
0.015262
OpenStudio
Retail - Large
0.013281
eQuest
Retail - Small
0.014055
OpenStudio
Warehouse
0.015677
eQuest
Nonresidential Average
338
0.014658
N/A
337
Calculated as the percentage of total savings in the maximum saving day, from models.
338
For weighting factors, see HVAC variable table in section 3.3.
For example, 1” thick insulation is installed on 100 feet of 1” diameter, bare straight pipe with 5 straight tee
components distributing fluid in a low-pressure steam system and located in an indoor space heated with a
steam boiler, in an industrial building in unknown location:
ΔTherms = ((100 + 1.9) * 1,183 * 192 * 0.15) / (100,000 * 0.80)
= 43.4 therms
For example, 1” thick insulation is installed on 100 feet of 1” diameter, bare straight pipe with 5 straight tee
components distributing fluid in a low-pressure steam system and located in an indoor space heated with a
steam boiler, in an industrial building in unknown location:
ΔTherms = 43.4 * 0.014296
= 0.6204 therms
Filed with the Iowa Utilities Board on September 23, 2020, EEP-2018-0002

Iowa Energy Efficiency Statewide Technical Reference Manual –3.3.18 Hydronic Heating Pipe Insulation
Vol.3 Nonresidential Measures July 22, 2020 FINAL Page 166 of 410
WATER IMPACT DESCRIPTIONS AND CALCULATION
N/A
DEEMED O&M COST ADJUSTMENT CALCULATION
N/A
MEASURE CODE: NR-HVC-HPIN-V03-210101
SUNSET DATE: 1/1/2024
Filed with the Iowa Utilities Board on September 23, 2020, EEP-2018-0002

Iowa Energy Efficiency Statewide Technical Reference Manual –3.3.19 Shut Off Damper for Space Heating Boilers
or Furnaces
Vol.3 Nonresidential Measures July 22, 2020 FINAL Page 167 of 410
3.3.19. Shut Off Damper for Space Heating Boilers or Furnaces
DESCRIPTION
This measure is for Nonresidential atmospheric boilers or furnaces providing space heating without a shut off
damper. When appliances are on standby mode warm room air is drawn through the stack via the draft hood or
dilution air inlet at a rate proportional to the stack height, diameter and outdoor temperature. More air is drawn
through the vent immediately after the appliance shuts off and the flue is still hot. Installation of a new shut off
damper can prevent heat from being drawn up the warm vent and reducing the amount of air that passes through
the furnace or boiler heat exchanger. This reduction in air can slightly increase overall operating efficiency by
reducing the time needed to achieve steady-state operating conditions.
This measure was developed to be applicable to the following program types: RF.
If applied to other program types, the measure savings should be verified.
DEFINITION OF EFFICIENT EQUIPMENT
To qualify the space heating boiler or furnace must have a new electrically or thermally activated shut off damper
installed on either the exhaust flue or combustion air intake. Barometric dampers do not qualify. The damper
actuation shall be interlocked with the firing controls.
DEFINITION OF BASELINE EQUIPMENT
The baseline boiler or furnace incorporates no shut off damper on the combustion air intake or flue exhaust.
DEEMED LIFETIME OF EFFICIENT EQUIPMENT
The measure life for the shut off damper is 15 years,
339
or for the remaining lifetime of the heating equipment,
whichever is less.
DEEMED MEASURE COST
Given the variability in cost associated with differences in system specifications and design, as well as choice of
measure technology, actual installed costs should be used as available or based on program-specific qualification
requirements. When unavailable a deemed measure cost of $1,500 shall be assumed.
340
LOADSHAPE
Loadshape NRGH01:16 – Nonresidential Gas Heating (by Building Type)
Algorithm
CALCULATION OF SAVINGS
ELECTRIC ENERGY SAVINGS
N/A
SUMMER COINCIDENT PEAK DEMAND SAVINGS
339
State of Wisconsin Public Service Commission of Wisconsin Focus on Energy Evaluation Business Programs: Measure Life
Study Final Report: August 25, 2009, Table 1-2. Recommended Measure Life by WISeerts Group Description, pg. 1-4.
340
CODES AND STANDARDS ENHANCEMENT INITIATIVE (CASE) PROCESS BOILERS, 2013 California Building Energy Efficiency
Standards, California Utilities Statewide Codes and Standards Team, October 2011, pg. 22
Filed with the Iowa Utilities Board on September 23, 2020, EEP-2018-0002

Iowa Energy Efficiency Statewide Technical Reference Manual –3.3.19 Shut Off Damper for Space Heating Boilers
or Furnaces
Vol.3 Nonresidential Measures July 22, 2020 FINAL Page 168 of 410
N/A
NATURAL GAS ENERGY SAVINGS
Where:
N
gi
= Boiler gas input size (kBtu/hr)
= Custom
SF = Savings factor
= 1%
341
Note: The savings factor assumes the boiler or furnace is located in an unconditioned
space. The savings factor can be higher for those units located within conditioned space.
EFLH = Default Equivalent Full Load Hours for heating are provided in section 3.3 HVAC End
Use.
When available, actual hours should be used.
100 = convert kBtu to therms
PEAK GAS SAVINGS
Where:
ΔTherms = Therm impact calculated above
GCF = Gas Coincidence Factor for Heating
Building Type
GCF
342
Model Source
Convenience
0.016482
eQuest
Education
0.011480
OpenStudio
Grocery
0.013083
OpenStudio
Health
0.010179
OpenStudio
Hospital
0.015543
OpenStudio
Industrial
0.014296
eQuest
Lodging
0.013205
OpenStudio
Multifamily
0.012268
OpenStudio
Office - Large
0.013082
OpenStudio
Office - Small
0.016718
OpenStudio
Religious
0.011964
eQuest
Restaurant
0.015262
OpenStudio
Retail - Large
0.013281
eQuest
341
Based on internet review of savings potential;
“Up to 4%”: Use of Automatic Vent Dampers for New and Existing Boilers and Furnaces, Energy Innovators Initiative Technical
Fact Sheet, Office of Energy Efficiency, Canada, 2002
“Up to 1%”: Page 9, The Carbon Trust, “Steam and high temperature hot water boilers”
http://www.carbontrust.com/media/13332/ctv052_steam_and_high_temperature_hot_water_boilers.pdf,
“1 - 2%”: Page 2, Sustainable Energy Authority of Ireland “Steam Systems Technical Guide”, see reference file “SEAI Technical
Guide – Steam Systems.”
342
Calculated as the percentage of total savings in the maximum saving day, from models.
Filed with the Iowa Utilities Board on September 23, 2020, EEP-2018-0002

Iowa Energy Efficiency Statewide Technical Reference Manual –3.3.19 Shut Off Damper for Space Heating Boilers
or Furnaces
Vol.3 Nonresidential Measures July 22, 2020 FINAL Page 169 of 410
Building Type
GCF
342
Model Source
Retail - Small
0.014055
OpenStudio
Warehouse
0.015677
eQuest
Nonresidential Average
343
0.014658
N/A
WATER IMPACT DESCRIPTIONS AND CALCULATION
N/A
DEEMED O&M COST ADJUSTMENT CALCULATION
A deemed, one-time Operations and Maintenance cost of $150 shall be included in cost-effectiveness calculations
and occur in year 10 of the measure life to account for controller replacement.
344
MEASURE CODE: NR-HVC-SODP-V02-200101
SUNSET DATE: 1/1/2024
343
For weighting factors, see HVAC variable table in section 3.3.
344
CODES AND STANDARDS ENHANCEMENT INITIATIVE (CASE) PROCESS BOILERS, 2013 California Building Energy Efficiency
Standards, California Utilities Statewide Codes and Standards Team, October 2011, pg. 22
Filed with the Iowa Utilities Board on September 23, 2020, EEP-2018-0002

Iowa Energy Efficiency Statewide Technical Reference Manual –3.3.20 Room Air Conditioner
Vol.3 Nonresidential Measures July 22, 2020 FINAL Page 170 of 410
3.3.20. Room Air Conditioner
DESCRIPTION
This measure relates to the purchase and installation of a room air conditioning unit that meets the ENERGY STAR
minimum qualifying efficiency specifications, in place of a baseline unit meeting minimum Federal Standard
efficiency ratings presented below:
345
Product Class (Btu/H)
Federal Standard
CEERbase, with
louvered sides,
without reverse
cycle
346
Federal Standard
CEERbase, without
louvered sides,
without reverse
cycle
ENERGY STAR
CEERee, with
louvered sides
ENERGY STAR
CEERee, without
louvered sides
< 8,000
11.0
10.0
12.1
11.0
8,000 to 10,999
10.9
9.6
12.0
10.6
11,000 to 13,999
9.5
10.5
14,000 to 19,999
10.7
9.3
11.8
10.2
20,000 to 24,999
9.4
9.4
10.3
10.3
25,000-27,999
9.0
>=28,000
9.9
Casement
Federal Standard
CEERbase
ENERGY STAR CEERee
Casement-only
9.5
10.5
Casement-slider
10.4
11.4
Reverse Cycle -
Product Class
(Btu/H)
Federal Standard
CEERbase, with
louvered sides
Federal Standard
CEERbase,
without louvered
sides
347
ENERGY STAR
CEERee, with
louvered
sides
348
ENERGY STAR
CEERee,
without
louvered sides
< 14,000
N/A
9.3
N/A
10.2
>= 14,000
N/A
8.7
N/A
9.6
< 20,000
9.8
N/A
10.8
N/A
>= 20,000
9.3
N/A
10.2
N/A
This measure was developed to be applicable to the following program types: TOS. If applied to other program types,
345
Side louvers that extend from a room air conditioner model in order to position the unit in a window. A model without
louvered sides is placed in a built-in wall sleeve and are commonly referred to as "through-the-wall" or "built-in" models.
Casement-only refers to a room air conditioner designed for mounting in a casement window of a specific size.
Casement-slider refers to a room air conditioner with an encased assembly designed for mounting in a sliding or casement
window of a specific size.
https://www.energystar.gov/sites/default/files/ENERGY%20STAR%20Version%204.0%20Room%20Air%20Conditioners%20Prog
ram%20Requirements.pdf and https://library.cee1.org/content/cee-residential-heating-and-cooling-systems-initiative-
description/
Reverse cycle refers to the heating function found in certain room air conditioner models.
Note these efficiency levels represent ratings without the Connected Allowance.
346
Federal standard air conditioner baselines. https://ees.lbl.gov/product/room-air-conditioners
347
Federal standard air conditioner baselines. https://ees.lbl.gov/product/room-air-conditioners
348
EnergyStar version 4.0 Room Air Conditioner Program Requirements.
https://www.energystar.gov/sites/default/files/ENERGY STAR Version 4.0 Room Air Conditioners Program Requirements.pdf.
Filed with the Iowa Utilities Board on September 23, 2020, EEP-2018-0002

Iowa Energy Efficiency Statewide Technical Reference Manual –3.3.20 Room Air Conditioner
Vol.3 Nonresidential Measures July 22, 2020 FINAL Page 171 of 410
the measure savings should be verified.
DEFINITION OF EFFICIENT EQUIPMENT
To qualify for this measure the new room air conditioning unit must meet the ENERGY STAR efficiency standards
presented above.
DEFINITION OF BASELINE EQUIPMENT
The baseline assumption is a new room air conditioning unit that meets the current minimum federal efficiency
standards presented above.
DEEMED LIFETIME OF EFFICIENT EQUIPMENT
The measure life is assumed to be 9 years.
349
DEEMED MEASURE COST
The incremental cost for this measure is assumed to be $50 for an ENERGY STAR unit.
350
LOADSHAPE
Loadshapes NREC01-NREC16 dependent on building type.
Algorithm
CALCULATION OF SAVINGS
ELECTRIC ENERGY SAVINGS
Where:
FLH
RoomAC
= Full Load Hours of room air conditioning unit:
351
Building Type
Zone 5
(Burlington)
Zone 6
(Mason City)
Average /
Unknown
Heating
Cooling
Heating
Cooling
Heating
Cooling
EFLH
EFLH
EFLH
EFLH
EFLH
EFLH
Convenience
243
458
379
350
332
419
Education
300
328
464
221
403
290
Grocery
158
612
299
460
228
538
349
Energy Star Room Air Conditioner Savings Calculator,
http://www.energystar.gov/index.cfm?fuseaction=find_a_product.showProductGroup&pgw_code=AC
350
Energy Star Room Air Conditioner Savings Calculator,
http://www.energystar.gov/index.cfm?fuseaction=find_a_product.showProductGroup&pgw_code=AC
351
Equivalent Full load hours for room AC is likely to be significantly lower than for central AC. In the absence of any empirical
evidence for commercial room AC use in Iowa, the same relationship as applied in the Residential measure is applied; The
average ratio of FLH for Room AC (provided in RLW Report: Final Report Coincidence Factor Study Residential Room Air
Conditioners, June 23, 2008:
http://www.puc.nh.gov/Electric/Monitoring%20and%20Evaluation%20Reports/National%20Grid/117_RLW_CF%20Res%20RAC.
pdf) to FLH for Central Cooling for the same location (provided by AHRI:
http://www.energystar.gov/ia/business/bulk_purchasing/bpsavings_calc/Calc_CAC.xls) is 31%. This ratio has been applied to
the EFLH assumptions from Section 3.3 (modeling).
Filed with the Iowa Utilities Board on September 23, 2020, EEP-2018-0002

Iowa Energy Efficiency Statewide Technical Reference Manual –3.3.20 Room Air Conditioner
Vol.3 Nonresidential Measures July 22, 2020 FINAL Page 172 of 410
Building Type
Zone 5
(Burlington)
Zone 6
(Mason City)
Average /
Unknown
Heating
Cooling
Heating
Cooling
Heating
Cooling
EFLH
EFLH
EFLH
EFLH
EFLH
EFLH
Health
317
362
474
278
438
330
Hospital
281
571
427
423
333
519
Industrial
263
367
395
265
367
330
Lodging
433
466
589
336
528
420
Multifamily
433
466
589
336
528
420
Office - Large
419
380
501
301
462
354
Office - Small
400
339
519
244
463
304
Religious
410
344
581
247
557
320
Restaurant
321
411
428
296
387
365
Retail - Large
277
375
432
267
404
334
Retail - Small
372
365
548
261
498
322
Warehouse
374
296
504
215
446
268
Nonresidential
Average
371
337
513
241
464
303
Btu/H = Size of unit
= Actual. If unknown assume 8500 Btu/hr
352
CEERbase = Efficiency of baseline unit
= As provided in tables above
CEERee = Efficiency of ENERGY STAR unit
= Actual. If unknown assume minimum qualifying standard as provided in tables
above
SUMMER COINCIDENT PEAK DEMAND SAVINGS
Where:
CF = Summer Peak Coincidence Factor for measure
= 0.3
353
352
Based on maximum capacity average from the RLW Report: Final Report Coincidence Factor Study Residential Room Air
Conditioners, June 23, 2008
353
In the absence of empirical evidence for commercial room AC usage in Iowa, the Residential assumption is used as a proxy;
Consistent with coincidence factors found in:
RLW Report: Final Report Coincidence Factor Study Residential Room Air Conditioners, June 23, 2008
For example, for an 8,500 Btu/H capacity ENERGY STAR unit, with louvered sides, in a multifamily setting in
Burlington:
ΔkWH
ENERGY STAR
= (433 * 8500 * (1/10.9 – 1/12.0)) / 1000
= 31.0 kWh
Filed with the Iowa Utilities Board on September 23, 2020, EEP-2018-0002

Iowa Energy Efficiency Statewide Technical Reference Manual –3.3.20 Room Air Conditioner
Vol.3 Nonresidential Measures July 22, 2020 FINAL Page 173 of 410
1.01 = Factor to convert CEER to EER (CEER includes standby and off power consumption
354
Other variables as defined above
NATURAL GAS SAVINGS
N/A
PEAK GAS SAVINGS
N/A
WATER IMPACT DESCRIPTIONS AND CALCULATION
N/A
DEEMED O&M COST ADJUSTMENT CALCULATION
N/A
MEASURE CODE: NR-HVC-RMAC-V02-190101
SUNSET DATE: 1/1/2022*
* This measure has a pending code and standard change; however, no utility currently offers the measure. Once the
new standard becomes effective the measure will become inactive unless a utility plans to start offering the measure
again.
(http://www.puc.nh.gov/Electric/Monitoring%20and%20Evaluation%20Reports/National%20Grid/117_RLW_CF%20Res%20RA
C.pdf)
354
Since the new CEER rating includes standby and off power consumption, for peak calculations it is more appropriate to
apply the EER rating, but it appears as though new units will only be rated with a CEER rating. Version 3.0 of the ENERGY STAR
specification provided equivalent EER and CEER ratings and for the most popular size band the EER rating is approximately 1%
higher than the CEER. See ‘ENERGY STAR Version 3.1 Room Air Conditioners Program Requirements’.
For example for an 8,500 Btu/H capacity ENERGY STAR unit, with louvered sides, in a convenience store in
Burlington during system peak:
ΔkW
ENERGY STAR
= (8500 * (1/10.9*1.01 – 1/12.0*1.01)) / 1000 * 0.3
= 0.0212 kW
Filed with the Iowa Utilities Board on September 23, 2020, EEP-2018-0002

Iowa Energy Efficiency Statewide Technical Reference Manual –3.3.21 Room Air Conditioner Recycling
Vol.3 Nonresidential Measures July 22, 2020 FINAL Page 174 of 410
3.3.21. Room Air Conditioner Recycling
DESCRIPTION
This measure describes the savings resulting from running a drop-off service taking existing commercial, inefficient
Room Air Conditioner units from service prior to their natural end of life. This measure assumes that a percentage
of these units will be replaced with a baseline standard efficiency unit (note that if it is actually replaced by a new
ENERGY STAR qualifying unit, the savings increment between baseline and ENERGY STAR will be recorded in the
Efficient Products program).
This measure was developed to be applicable to the following program types: ERET.
If applied to other program types, the measure savings should be verified.
DEFINITION OF EFFICIENT EQUIPMENT
N/A. This measure relates to the retiring of an existing inefficient unit.
DEFINITION OF BASELINE EQUIPMENT
The baseline condition is the existing inefficient room air conditioning unit.
DEEMED LIFETIME OF EFFICIENT EQUIPMENT
The assumed remaining useful life of the existing room air conditioning unit being retired is 3 years.
355
DEEMED MEASURE COST
The actual implementation cost for recycling the existing unit should be used.
LOADSHAPE
Loadshapes NREC01-NREC16 dependent on building type.
Algorithm
CALCULATION OF SAVINGS
ELECTRIC ENERGY SAVINGS
Where:
Hours = Full Load Hours of room air conditioning unit
356
355
One third of assumed measure life for Room AC.
356
Equivalent Full load hours for room AC is likely to be significantly lower than for central AC. In the absence of any empirical
evidence for commercial room AC use in Iowa, the same relationship as applied in the Residential measure is applied; The
average ratio of FLH for Room AC (provided in RLW Report: Final Report Coincidence Factor Study Residential Room Air
Conditioners, June 23, 2008:
http://www.puc.nh.gov/Electric/Monitoring%20and%20Evaluation%20Reports/National%20Grid/117_RLW_CF%20Res%20RAC.
pdf) to FLH for Central Cooling for the same location (provided by AHRI: see reference file “RoomAC_Calculator”) is 31%. This
ratio has been applied to the EFLH assumptions from Section 3.3 (modeling).
Filed with the Iowa Utilities Board on September 23, 2020, EEP-2018-0002

Iowa Energy Efficiency Statewide Technical Reference Manual –3.3.21 Room Air Conditioner Recycling
Vol.3 Nonresidential Measures July 22, 2020 FINAL Page 175 of 410
Building Type
Zone 5
(Burlington)
Zone 6
(Mason City)
Average /
Unknown
Heating
Cooling
Heating
Cooling
Heating
Cooling
EFLH
EFLH
EFLH
EFLH
EFLH
EFLH
Convenience
243
458
379
350
332
419
Education
300
328
464
221
403
290
Grocery
158
612
299
460
228
538
Health
317
362
474
278
438
330
Hospital
281
571
427
423
333
519
Industrial
263
367
395
265
367
330
Lodging
433
466
589
336
528
420
Multifamily
433
466
589
336
528
420
Office - Large
419
380
501
301
462
354
Office - Small
400
339
519
244
463
304
Religious
410
344
581
247
557
320
Restaurant
321
411
428
296
387
365
Retail - Large
277
375
432
267
404
334
Retail - Small
372
365
548
261
498
322
Warehouse
374
296
504
215
446
268
Nonresidential
Average
371
337
513
241
464
303
BtuH = Average size of rebated unit. Use actual if available - if not, assume 8500.
357
EERexist = Efficiency of recycled unit
= Actual if recorded - If not, assume 9.8.
358
%replaced = Percentage of units dropped off that are replaced
Scenario
%replaced
Customer states unit will not be replaced
0%
Customer states unit will be replaced
100%
Unknown
76%
359
CEERNewbase = Efficiency of baseline unit
357
Based on maximum capacity average from the RLW Report; “Final Report Coincidence Factor Study Residential Room Air
Conditioners, June 23, 2008.”
358
The Federal Minimum for the most common type of unit (8000 – 13999 Btuh with side vents) from 1990-2000 was 9.0 EER,
from 2000-2014 it was 9.8 EER, and is currently (2015) 10.9 CEER. Retirement programs will see a large array of ages being
retired, and the true EER of many will have been significantly degraded. We have selected 9.0 as a reasonable estimate of the
average retired unit, given a 9 year expected measure life. This is supported by material on the ENERGY STAR website, which, if
reverse-engineered, indicates that an EER of 9.16 is used for savings calculations for a 10-year old RAC. Another statement
indicates that units that are at least 10 years old use 20% more energy than a new ES unit, which equates to: 10.9EER/1.2 = 9.1
EER; http://www.energystar.gov/ia/products/recycle/documents/RoomAirConditionerTurn-InAndRecyclingPrograms.pdf
359
In the absence of empirical evidence for commercial Room AC replacement rates, the Residential assumption is used; Based
on Nexus Market Research Inc, RLW Analytics, December 2005; “Impact, Process, and Market Study of the Connecticut
Appliance Retirement Program: Overall Report.” Report states that 63% were replaced with ENERGY STAR units and 13% with
non-ENERGY STAR. However, this formula assumes all are non-ENERGY STAR since the increment of savings between baseline
units and ENERGY STAR would be recorded by the Efficient Products program when the new unit is purchased.
Filed with the Iowa Utilities Board on September 23, 2020, EEP-2018-0002
Iowa Energy Efficiency Statewide Technical Reference Manual –3.3.21 Room Air Conditioner Recycling
Vol.3 Nonresidential Measures July 22, 2020 FINAL Page 176 of 410
= 10.9
360
1.01 = Factor to convert EER to CEER (CEER includes standby and off power consumption).
361
SUMMER COINCIDENT PEAK DEMAND SAVINGS
Where:
CF = Summer Peak Coincidence Factor for measure
= 0.3
362
Other variables as defined above
NATURAL GAS SAVINGS
N/A
PEAK GAS SAVINGS
N/A
WATER IMPACT DESCRIPTIONS AND CALCULATION
N/A
DEEMED O&M COST ADJUSTMENT CALCULATION
N/A
MEASURE CODE: NR-APL-RACR-V02-180101
SUNSET DATE: 1/1/2023
360
Minimum Federal Standard for capacity range and most popular class (Without reverse cycle, with louvered sides, and 8,000
to 13,999 Btu/h); http://www1.eere.energy.gov/buildings/appliance_standards/product.aspx/productid/41
361
Since the new CEER rating includes standby and off power consumption, for peak calculations it is more appropriate to apply
the EER rating, but it appears as though new units will only be rated with a CEER rating. Version 3.0 of the ENERGY STAR
specification provided equivalent EER and CEER ratings and for the most popular size band the EER rating is approximately 1%
higher than the CEER. See ‘ENERGY STAR Version 3.1 Room Air Conditioners Program Requirements’.
362
In the absence of empirical evidence for commercial room AC usage in Iowa, the Residential assumption is used as a proxy;
Consistent with coincidence factors found in:
RLW Report: Final Report Coincidence Factor Study Residential Room Air Conditioners, June 23, 2008
(http://www.puc.nh.gov/Electric/Monitoring%20and%20Evaluation%20Reports/National%20Grid/117_RLW_CF%20Res%20RA
C.pdf)
For example, for a room air conditioner removed from service in a multifamily setting in Burlington:
ΔkWH
= ((466 * 8500)/(9.8/1.01 * 1,000)) – (0.76 * (466 * 8500)/(10.9 * 1,000))
= 132.0 kWh
For example, for a room air conditioner removed from service in a multifamily setting in Burlington:
ΔkW
= (132.0/466) * 0.3
= 0.0850 kW
Filed with the Iowa Utilities Board on September 23, 2020, EEP-2018-0002

Iowa Energy Efficiency Statewide Technical Reference Manual –3.3.22 Steam Trap Replacement or Repair
Vol.3 Nonresidential Measures July 22, 2020 FINAL Page 177 of 410
3.3.22. Steam Trap Replacement or Repair
DESCRIPTION
This measure applies to the repair or replacement of failed steam traps on HVAC steam distribution systems. Faulty
steam traps can allow excess steam to escape, wasting the energy used to generate steam and increasing the amount
of steam generated. The measure is applicable to steam systems in commercial, industrial, and multifamily buildings.
This measure was developed to be applicable to the following program type: RF.
If applied to other program types, the measure savings should be verified.
DEFINITION OF EFFICIENT EQUIPMENT
The efficient equipment is a repaired, rebuilt, or replaced steam trap.
DEFINITION OF BASELINE EQUIPMENT
The baseline equipment is a failed steam trap that needs to be repaired, rebuilt, or replaced as confirmed by a steam
trap survey. No minimum leak rate is required – qualifying failed steam traps may be failed closed, partially open,
or completely open.
DEEMED LIFETIME OF EFFICIENT EQUIPMENT
The life of this measure is 6 years.
363
DEEMED MEASURE COST
Measure cost depends on building type (commercial or industrial) and maximum steam system operating pressure
(psig).
Steam System
Total Installed Cost (per
Steam Trap)
364
Commercial (all operating pressures)
$177
Industrial, ≤ 15 psig
$280
Industrial, > 15 ≤ 30 psig
$300
Industrial, > 30 ≤ 125 psig
$323
Industrial, > 125 ≤ 200 psig
$415
Industrial, > 200 ≤ 250 psig
$275
Industrial, > 250 psig
Custom
LOADSHAPE
Loadshape NRGH01:16 – Nonresidential Gas Heating (by Building Type)
Algorithm
CALCULATION OF ENERGY SAVINGS
ENERGY SAVINGS
363
Measure life from Work Paper: Steam Traps Revision #1. Resource Solutions Group, August 2011.
364
Steam trap costs from Work Paper: Steam Traps Revision #1. Resource Solutions Group, August 2011. Measure cost includes
installation cost of $100 per trap, from Implement a Sustainable Steam-Trap Management Program, America Institute of
Chemical Engineers, January 2014.
Filed with the Iowa Utilities Board on September 23, 2020, EEP-2018-0002

Iowa Energy Efficiency Statewide Technical Reference Manual –3.3.22 Steam Trap Replacement or Repair
Vol.3 Nonresidential Measures July 22, 2020 FINAL Page 178 of 410
ELECTRIC ENERGY SAVINGS
N/A
SUMMER COINCIDENT PEAK DEMAND SAVINGS
N/A
NATURAL GAS ENERGY SAVINGS
Where:
LeakRate = Average steam loss rate (lb/hr) per leaking trap
= 24.24 x (P
Inlet
+ 14.7) x D² x %Adjust
Where:
24.24 = Constant from Napier’s equation (lb/(hr-psia-in
2
)
P
Inlet
= Steam trap inlet pressure (psig)
= Actual
14.7 = Atmospheric pressure (psia)
D = Diameter of steam trap orifice (in)
= Actual
%Adjust = Adjustment factor (%) to reduce the maximum theoretical steam flow to
the average steam flow
= 50%
365
H
vap
= Heat of vaporization of steam (Btu/lb)
= Use values from table below, based on steam trap inlet pressure (psig):
366
P
Inlet
(psig)
H
vap
(Btu/lb)
2
966
5
960
10
952
15
945
20
939
25
934
30
929
40
926
50
912
60
905
70
898
80
892
90
886
100
880
110
875
365
Enbridge adjustment factor, from Work Paper: Steam Traps Revision #1. Resource Solutions Group, August 2011.
366
Heat of vaporization values from Steam Tables, Power Plant Service, Inc.
Filed with the Iowa Utilities Board on September 23, 2020, EEP-2018-0002

Iowa Energy Efficiency Statewide Technical Reference Manual –3.3.22 Steam Trap Replacement or Repair
Vol.3 Nonresidential Measures July 22, 2020 FINAL Page 179 of 410
P
Inlet
(psig)
H
vap
(Btu/lb)
120
871
125
868
130
866
140
862
150
857
160
853
180
845
200
834
225
829
250
820
Hours
Heat
= Custom entry, annual operating hours of steam plant
%Leak = Percentage of leaking or blow-through steam traps
= 1.0 when applied to the replacment of an individual leaking trap. If a number of steam
traps are replaced and the system has not been audited, %Leak is applied to reflect the
assumed percentage of steam traps that were actually leaking and in need of
replacement. Use 27% for commerical customers and 16% for industrial customers.
367
EFF
Heat
= Boiler efficiency (%)
= Actual operating efficiency.
100,000 = Factor to convert Btus to therms
PEAK GAS SAVINGS
Where:
ΔTherms = Therm impact calculated above
GCF = Gas Coincidence Factor for Heating
Building Type
GCF
368
Model Source
Convenience
0.016310
eQuest
Education
0.011480
OpenStudio
Grocery
0.013083
OpenStudio
Health
0.010179
OpenStudio
Hospital
0.015543
OpenStudio
Industrial
0.014240
eQuest
Lodging
0.013205
OpenStudio
Multifamily
0.012268
OpenStudio
Office - Large
0.013082
OpenStudio
367
% Leak values from Work Paper: Steam Traps Revision #1. Resource Solutions Group, August 2011.
368
Calculated as the percentage of total savings in the maximum saving day, from models.
For example, replacing a single failed steam trap with a 0.125 inch orifice diameter operating on a 30 psi
system with 75% efficiency that operates 4,500 hours annually in a small retail setting will save:
ΔTherms = (24.24 * (30 + 14.7) * 0.125
2
* 0.5) * 929 * 4,500 * 1.0 / (0.75 * 100,000)
= 471.8 Therms
Filed with the Iowa Utilities Board on September 23, 2020, EEP-2018-0002

Iowa Energy Efficiency Statewide Technical Reference Manual –3.3.22 Steam Trap Replacement or Repair
Vol.3 Nonresidential Measures July 22, 2020 FINAL Page 180 of 410
Building Type
GCF
368
Model Source
Office - Small
0.016718
OpenStudio
Religious
0.011745
eQuest
Restaurant
0.015262
OpenStudio
Retail - Large
0.013281
eQuest
Retail - Small
0.014055
OpenStudio
Warehouse
0.015677
eQuest
Nonresidential Average
369
0.014623
N/A
WATER IMPACT DESCRIPTIONS AND CALCULATION
N/A
DEEMED O&M COST ADJUSTMENT CALCULATION
N/A
MEASURE CODE: NR-HVC-STRE-V02-200101
SUNSET DATE: 1/1/2022
369
For weighting factors, see HVAC variable table in section 3.3.
For example, replacing a single failed steam trap with a 0.125 inch orifice diameter operating on a 30 psi
system with 75% efficiency that operates 4,500 hours annually in a small retail setting will save:
ΔTherms = 471.8 * 0.0140550
= 6.6311 Therms
Filed with the Iowa Utilities Board on September 23, 2020, EEP-2018-0002

Illinois Statewide Technical Reference Manual – 3.3.23 Electric HVAC Tune-up
Vol.3 Nonresidential Measures July 22, 2020 FINAL Page 181 of 410
3.3.23. Electric HVAC Tune-up
DESCRIPTION
This measure is for the tune-up of electric cooling equipment, such as a unitary or split system air conditioner or a
central air source or geothermal heat pump. This should not be used for water based systems such as chillers. The
tune-up will improve performance by inspecting, cleaning, and adjusting the system for correct and efficient
operation. An air conditioning system that is operating as designed saves energy and provides adequate cooling and
comfort to the conditioned space. Heating savings are not currently characterized, however we hope to be able to
add a much wider range of fault conditions based on NRELs recent modeling work through OpenStudio in a future
cycle.
This measure was developed to be applicable to the following program types: RF.
DEFINITION OF EFFICIENT EQUIPMENT
In order for this characterization to apply, the efficient equipment is assumed to be a unitary or split system air
conditioner at least 3 tons in capacity. The measure assumes that a certified technician performs the following items:
• Check refrigerant charge
• Identify and repair leaks if refrigerant charge is low
• Measure and record refrigerant pressures
• Measure and record temperature drop at indoor coil
• Clean condensate drain line
• Clean outdoor coil and straighten fins
• Clean indoor and outdoor fan blades
• Clean indoor coil with spray-on cleaner and straighten fins
• Repair damaged insulation – suction line
• Change air filter
• Measure and record blower amp draw
DEFINITION OF BASELINE EQUIPMENT
In order for this characterization to apply, the baseline condition is assumed to be an AC system that that does not
have a standing maintenance contract or a tune up within in the past 36 months.
DEEMED LIFETIME OF EFFICIENT EQUIPMENT
The expected measure life is assumed to be 3 years.
370
DEEMED MEASURE COST
A copy of contractor invoices that detail the work performed, as well as additional labor and parts to improve/repair
air conditioner performance should be submitted to the program and used as the measure cost.
LOADSHAPE
Loadshape NREC01:16 - Nonresidential Cooling (by Building Type)
370
3 years is given for “Clean Condenser Coils – Commercial” and “Clean Evaporator Coils”. DEER2014 EUL Table.
Filed with the Iowa Utilities Board on September 23, 2020, EEP-2018-0002

Illinois Statewide Technical Reference Manual – 3.3.23 Electric HVAC Tune-up
Vol.3 Nonresidential Measures July 22, 2020 FINAL Page 182 of 410
Algorithm
CALCULATION OF SAVINGS
ELECTRIC ENERGY SAVINGS
Where:
Capacity
Cool
= capacity of the cooling equipment in Btu per hour (note 1 ton = 12,000Btu/hr)
= Actual
EERbefore = Energy Efficiency Ratio of the baseline equipment prior to tune-up
= Actual
371
EERafter = Energy Efficiency Ratio of the baseline equipment after to tune-up
= Actual
EFLH = Equivalent Full Load Hours for cooling in Existing Buildings are provided in section 3.3
HVAC End Use
Where it is not possible or appropriate to perform Test in and Test out of the equipment, the following deemed
methdology can be used:
Where:
%Savings = Deemed percent savings per Tune-Up component. These are additive multiple
components are performed (total provided below):
372
Tune-Up Component
% savings
Correct Refrigerant Charge
2%
Clean condenser coils
1%
Clean evaporator coils
1%
If full tune up performed
5%
371
In the context of this measure Energy Efficiency Ratio (EER) refers to field-measured steady-state rate of heat energy
removal (e.g., cooling capacity) by the equipment in Btuh divided by the steady-state rate of energy input to the equipment in
watts. This ratio is expressed in Btuh per watt (Btuh/watt). The cooling capacity may be derived using either refrigerant or air-
side measurements. The measurement is performed at the outdoor and indoor environmental conditions that are present at
the time the tune-up is being performed, and should be normalized using a correction function to the AHRI 210/240 Standard
test conditions. The correction function should be developed based on manufacturer’s performance data. Care must be taken
to ensure the unit is fully loaded and operating at or near steady-state.
372
Savings estimates are determined by applying each maintenance issue (high/low refrigerant charge, dirty condenser coil,
dirty evaporator coil and all three combined) to the base maintained Office OpenStudio model and comparing electricity
consumption.
Filed with the Iowa Utilities Board on September 23, 2020, EEP-2018-0002

Illinois Statewide Technical Reference Manual – 3.3.23 Electric HVAC Tune-up
Vol.3 Nonresidential Measures July 22, 2020 FINAL Page 183 of 410
SUMMER COINCIDENT PEAK DEMAND SAVINGS
Where:
CF = Summer System Peak Coincidence Factor for Cooling (dependent on building type)
Building Type
CF
373
Model Source
Convenience
92.3%
eQuest
Education
96.7%
OpenStudio
Grocery
100.0%
OpenStudio
Health
100.0%
OpenStudio
Hospital
98.6%
OpenStudio
Industrial
44.6%
eQuest
Lodging
97.4%
OpenStudio
Multifamily
100.0%
OpenStudio
Office - Large
98.8%
OpenStudio
Office - Small
100.0%
OpenStudio
Religious
94.3%
eQuest
Restaurant
99.6%
OpenStudio
Retail - Large
87.6%
eQuest
Retail - Small
100.0%
OpenStudio
Warehouse
77.9%
eQuest
Nonresidential Average
374
92.3%
N/A
NATURAL GAS ENERGY SAVINGS
N/A
WATER IMPACT DESCRIPTIONS AND CALCULATION
N/A
DEEMED O&M COST ADJUSTMENT CALCULATION
N/A
373
This calculation is the total savings in peak hour demand divided by the total savings in absolute peak demand.
374
For weighting factors, see HVAC variable table in section 3.3.
For example, a 12 EER, 60,000 Btuh rooftop air conditioner on a restaurant in Burlington receives a full tune-up:
ΔkWh = (60000 / (1000 * 12)) * 1,397 * 5%
= 349 kWh
For example, a 12 EER, 60,000 Btuh rooftop air conditioner on a restaurant in Burlington receives a full tune-up:
ΔkW = 349 / 1397 * 0.996
= 0.2488 kW
Filed with the Iowa Utilities Board on September 23, 2020, EEP-2018-0002

Illinois Statewide Technical Reference Manual – 3.3.23 Electric HVAC Tune-up
Vol.3 Nonresidential Measures July 22, 2020 FINAL Page 184 of 410
MEASURE CODE: NR-HVC-ACTU-V01-210101
SUNSET DATE: 1/1/2025
Filed with the Iowa Utilities Board on September 23, 2020, EEP-2018-0002

Iowa Energy Efficiency Statewide Technical Reference Manual – 3.4 Lighting End Use
Vol.3 Nonresidential Measures July 22, 2020 FINAL Page 185 of 410
3.4. Lighting
The nonresidential lighting measures use a standard set of variables for hours of use, waste heat factors, coincidence
factors, and HVAC interaction effects. This table has been developed based on OpenStudio and eQuest modeling
performed by VEIC. The models, prototype building descriptions, methodology documentation, and final results can
be found on the Iowa TRM SharePoint Site (TRM Reference Documents; Non Residential; Modeling). For ease of
review, the table is included here and referenced in each measure.
Note where a measure installation is within a building or application that does not fit with any of the defined building
types below, the user should apply custom assumptions where it is reasonable to estimate them, else the building
of best fit should be utilized. For the specific assumptions used in each model, refer to table in the “IA Prototype
Building Descriptions” file in the SharePoint folder referenced above.
Building Type
HOU
WHFe
375
WHFd
376
CF
377
WHFh
378
IFTherm
s Eff =
80%
IFkWh
(resista
nce)
COP = 1
IFkWh
(heat
pump)
COP =
2.3
Model
Source
Agricultural
Animal Housing
and
Warehousing
2920
1.0
1.0
61.8%
0.000
0.000
0.000
0.000
eQuest
Convenience
4630
1.14
1.31
100.0%
0.36
0.015
0.36
0.16
eQuest
Education
1877
1.07
1.48
65.27%
0.45
0.019
0.45
0.20
OpenStudio
Exterior
Lighting
4676
1.0
1.0
0%
0.000
0.000
0.000
0.000
OpenStudio
Grocery
4663
1.02
1.20
82.11%
0.30
0.013
0.30
0.13
OpenStudio
Health
3806
1.09
1.69
67.00%
0.35
0.015
0.35
0.15
OpenStudio
Hospital
6520
1.16
1.26
55.95%
0.18
0.008
0.18
0.08
OpenStudio
Industrial
2850
1.02
1.02
91.80%
0.37
0.016
0.37
0.16
eQuest
Lodging
3061
1.23
1.47
61.07%
0.19
0.008
0.19
0.08
OpenStudio
Multifamily
3061
1.13
1.15
71.17%
0.44
0.019
0.44
0.19
OpenStudio
Office - Large
2920
1.17
1.04
60.20%
0.29
0.013
0.29
0.13
OpenStudio
Office - Small
2920
1.10
1.28
51.79%
0.33
0.014
0.33
0.15
OpenStudio
Religious
2412
1.12
1.32
66.00%
0.46
0.020
0.46
0.20
eQuest
Restaurant
5443
1.00
1.47
100.00%
0.00
0.000
0.00
0.00
OpenStudio
Retail - Large
4065
1.00
1.28
100.0%
0.00
0.000
0.00
0.00
eQuest/Open
Studio
Retail - Small
3694
1.09
1.20
100.00%
0.36
0.015
0.36
0.16
OpenStudio
375
Determined as the total building electrical savings divided by the lighting electrical savings. Note that effects of heat pump,
electric heat or dehumidification were removed to isolate only the cooling waste heat impacts.
376
Determining WHFd for weather dependent, interactive measures uses the same two energy model runs as WHFe. The
calculation uses the difference in average total peak hour demand divided by the difference in average lighting peak hour
demand.
377
This calculation is the total savings in peak hour demand divided by the total savings in absolute peak demand.
378
This unit-less factor is calculated based on changes in peak heating load (equipment output) relative to the change in peak
lighting demand. This method allows universal applicability to various heating fuels and efficiencies. The appropriate IF can be
calculated by applying the correct conversion factor and heating system efficiency without needing multiple modeling runs to
represent various heating fuels.
Filed with the Iowa Utilities Board on September 23, 2020, EEP-2018-0002

Iowa Energy Efficiency Statewide Technical Reference Manual – 3.4 Lighting End Use
Vol.3 Nonresidential Measures July 22, 2020 FINAL Page 186 of 410
Building Type
HOU
WHFe
375
WHFd
376
CF
377
WHFh
378
IFTherm
s Eff =
80%
IFkWh
(resista
nce)
COP = 1
IFkWh
(heat
pump)
COP =
2.3
Model
Source
Warehouse
2920
1.00
1.19
61.8%
0.00
0.000
0.00
0.00
eQuest/Open
Studio
Nonresidential
Average
379
3065
1.06
1.28
69.07%
0.24
0.010
0.24
0.10
N/A
Unconditioned
building
As
above
1.0
1.0
As
above
0.000
0.000
0.000
0.000
N/A
Refrigerated
Cases
380
As
above
1.29
1.29
As
above
0.000
0.000
0.000
0.000
N/A
Freezer
Cases
381
As
above
1.50
1.50
As
above
0.000
0.000
0.000
0.000
N/A
379
For weighting factors, see HVAC variable table in section 3.3.
380
WHFe and WHFd for refrigerated case lighting is 1.29 (calculated as (1 + (1.0 / 3.5))). Based on the assumption that all
lighting in refrigerated cases is mechanically cooled, with a typical 3.5 COP refrigeration system efficiency, and assuming 100%
of lighting heat needs to be mechanically cooled at time of summer peak.
381
WHFe and WHFd for freezer case lighting is 1.50 (calculated as (1 + (1.0 / 2.0))). Based on the assumption that all lighting in
freezer cases is mechanically cooled, with a typical 2.0 COP freezer system efficiency, and assuming 100% of lighting heat needs
to be mechanically cooled at time of summer peak.
Filed with the Iowa Utilities Board on September 23, 2020, EEP-2018-0002

Iowa Energy Efficiency Statewide Technical Reference Manual –3.4.1 Compact Fluorescent Lamp - Standard
Vol.3 Nonresidential Measures July 22, 2020 FINAL Page 187 of 410
3.4.1. Compact Fluorescent Lamp - Standard
NOTE: THIS MEASURE IS EFFECTIVE UNTIL 12/31/2017. IT SHOULD NOT BE USED BEYOND THAT DATE BUT IS LEFT IN THE
MANUAL FOR REFERENCE PURPOSES.
DESCRIPTION
An efficient ENERGY STAR qualified compact fluorescent screw-in bulb (CFL) is installed in place of a baseline screw-
in bulb.
This characterization assumes that the CFL is installed in a commercial location. This is therefore appropriate for
commercially targeted programs, or, if the implementation strategy does not allow for the installation location to
be known (e.g., an upstream retail program), utilities should develop an assumption of the Residential v
Nonresidential split and apply the relevant assumptions to each portion.
Federal legislation stemming from the Energy Independence and Security Act of 2007 (EISA) requires all general-
purpose light bulbs between 40W and 100W to be approximately 30% more energy efficient than standard
incandescent bulbs. Production of 100W, standard efficacy incandescent lamps ended in 2012, followed by
restrictions on 75W in 2013 and 60W and 40W in 2014. The baseline for this measure has therefore become bulbs
(improved incandescent or halogen) that meet the new standard. Furthermore, the Technical Advisory Committee
approved assuming a blended baseline condition of EISA qualified incandescent/halogen, CFL and LED lamps. This
assumption should be reviewed during each update cycle and when the net to gross impacts for this measure are
determined.
A provision in the EISA regulations requires that by January 1, 2020, all lamps meet efficiency criteria of at least 45
lumens per watt, in essence making the baseline equivalent to a current day CFL. Therefore, the measure life
(number of years that savings should be claimed) should be reduced once the assumed lifetime of the bulb exceeds
2020.
This measure was developed to be applicable to the following program types: TOS, DI, RF.
If applied to other program types, the measure savings should be verified.
DEFINITION OF EFFICIENT EQUIPMENT
In order for this characterization to apply, the high-efficiency equipment must be a standard general service
ENERGY STAR qualified CFL based upon the v1.1 ENERGY STAR specification for lamps
(https://www.energystar.gov/sites/default/files/ENERGY%20STAR%20Lamps%20V1%201_Specification.pdf. Note a
new ENERGY STAR specification v2.0 will become effective on 1/2/2017
(https://www.energystar.gov/sites/default/files/asset/document/ENERGY%20STAR%20Lamps%20V2%20Revised%
20Spec.pdf).
DEFINITION OF BASELINE EQUIPMENT
The baseline condition for this measure is assumed to be a blend of 70% EISA qualified halogen or incandescent and
20% CFL and 5% LED
382
.
DEEMED LIFETIME OF EFFICIENT EQUIPMENT
The expected measure life should be calculated by dividing the rated life of the bulb (10,000 hours
383
) by the run
hours for the building type. For example, using the average nonresidential assumption of 3065 hours would give 3.3
382
As proposed and discussed by Iowa TRM Oversight Committee and Technical Advisory Committee.
383
As per ENERGY STAR Lamp evaluation specification V1.1, ENERGY STAR bulbs will have a rated life of at least 10,000 hours.
Filed with the Iowa Utilities Board on September 23, 2020, EEP-2018-0002

Iowa Energy Efficiency Statewide Technical Reference Manual –3.4.1 Compact Fluorescent Lamp - Standard
Vol.3 Nonresidential Measures July 22, 2020 FINAL Page 188 of 410
years. The lifetime should be capped to the number of years until 2020 due to the EISA backstop provision.
DEEMED MEASURE COST
The incremental capital cost assumption for all bulbs under 2,000 lumens is $1.03
384
(baseline cost of $2.17
385
and
efficient cost of $3.20).
For bulbs over 2,000 lumens, the assumed incremental capital cost is $2.76
386
(baseline cost of $3.44
387
and efficient
cost of $6.20).
For a Direct Install measure, actual program delivery costs should be used if available. If not, the full cost of $3.20
388
per <2000 lumen bulb or $6.20 per ≥ 2,000 lumen bulb should be used, plus $10 labor
389
for a total measure cost of
$13.20 per <2,000 lumen bulb and $16.20 per ≥ 2,000 lumen bulb.
LOADSHAPE
Loadshape NREL01:16 – Nonresidential Lighting (by Building Type)
Algorithm
CALCULATION OF SAVINGS
ELECTRIC ENERGY SAVINGS
Where:
Watts
Base
= Actual (if retrofit measure) or based on lumens of CFL bulb installed and includes blend
of incandescent/halogen
390
, CFL and LED by weightings provided in table below
391
. Note
that when an IA net-to-gross (NTG) factor is determined for this measure, this blended
baseline should be replaced with the Incandescent/Halogen baseline only..
Watts
EE
= Actual wattage of CFL purchased or installed - If unknown, assume the following
defaults
392
:
384
Incandescent/halogen and CFL assumptions based on incremental costs for 60W equivalent (dominant bulb) from “2010-
2012 WA017 Ex Ante Measure Cost Study Draft Report”, Itron, February 28, 2014.
385
Based on 70% Incandescent ($1.40), 25% CFL ($3.20) and 5% LED ($7.87). LED lamp costs are based on a 2014/2015 VEIC
review of a year’s worth of LED sales through VEIC implemented programs. The retail cost was averaged and then DOE price
projection trends (from Department of Energy, 2012; “Energy Savings Potential of Solid-State Lighting in General Illumination
Applications”, Table A.1) used to decrease the cost for a 2017 TRM assumption (see 2015 LED Sales Review.xls). LED costs are
falling rapidly and should be reviewed in each update cycle.
386
Based on high brightness lamps from “2010-2012 WA017 Ex Ante Measure Cost Study Draft Report”, Itron, February 28,
2014.
387
Based on 70% Incandescent ($1.60), 25% CFL ($6.20) and 5% LED ($15.39)
388
Based on 15W CFL, “2010-2012 WA017 Ex Ante Measure Cost Study Draft Report”, Itron, February 28, 2014.
389
Assumption based on 15 minutes (including portion of travel time) and $40 per hour.
390
Incandescent/Halogen wattage is based upon the post first phase of EISA wattage and wattage bins consistent with ENERGY
STAR, v1.1; http://www.energystar.gov/sites/default/files/ENERGY%20STAR%20Lamps%20V1%201_Specification.pdf.
391
Weightings were determined through discussions with the Technical Advisory Committee. These are based upon review of
Itron socket saturation and inventory data, in addition to review of multiple other data sources on the lighting market in other
jurisdictions.
392
Watts
EE
defaults are based upon the average available ENERGY STAR product, accessed 06/18/2015. For any lumen range
where there is no ENERGY STAR product currently available, Watts
EE
is based upon the ENERGY STAR minimum luminous
efficacy (55Lm/W for lamps with rated wattages less than 15W and 65 Lm/W for lamps with rated wattages ≥ 15 watts) for the
Filed with the Iowa Utilities Board on September 23, 2020, EEP-2018-0002

Iowa Energy Efficiency Statewide Technical Reference Manual –3.4.1 Compact Fluorescent Lamp - Standard
Vol.3 Nonresidential Measures July 22, 2020 FINAL Page 189 of 410
Lower
Lumen
Range
Upper
Lumen
Range
Inc/Halogen
Watts
EE
CFL
LED
Watts
Base
Delta
Watts
70%
25%
5%
250
309
25
5.1
4.0
19.0
13.9
310
749
29
9.4
6.7
23.0
13.6
750
1,049
43
13.4
10.1
33.9
20.6
1,050
1,489
53
18.9
12.8
42.5
23.5
1,490
2,600
72
24.8
17.4
57.5
32.7
2,601
3,000
150
41.1
43.1
117.4
76.3
3,001
3,999
200
53.8
53.8
156.2
102.3
4,000
6,000
300
65.0
76.9
230.1
165.1
Hours = Average hours of use per year are provided in Lighting Reference Table in Section 3.4.
If unknown, use the Nonresidential Average value.
WHFe = Waste heat factors for energy to account for cooling energy savings from efficient
lighting are provided for each building type in Lighting Reference Table in Section 3.4 - If
unknown, use the Nonresidential Average value
ISR = In Service Rate or the percentage of units that get installed
=100%
393
if application form completed with sign off that equipment is not placed into
storage. If sign off form not completed, assume the following:
Program
Discounted
In Service Rate (ISR)
394
Retail (Time of Sale)
395
95%
Direct Install
396
and Retrofit
97%
Heating Penalty:
If electrically heated building
397
:
Where:
IFkWh = Lighting-HVAC Interation Factor for electric heating impacts; this factor represents the
increased electric space heating requirements due to the reduction of waste heat rejected
by the efficent lighting. Values are provided in the Lighting Reference Table in Section 3.4.
If unknown, use the Nonresidential Average value.
mid-point of the lumen range. See calculation at “cerified-light-bulbs-2015-06-18.xlsx”. These assumptions should be reviewed
regularly to ensure they represent the available product.
393
Illinois evaluation of PY1 through PY3 has not found that fixtures or lamps placed into storage to be a significant enough
issue to warrant including an “In-Service Rate” when commercial customers complete an application form.
394
All Programs except for Direct Install assume that some lamps are not installed in the first year but are later installed in years
2 and 3. To ease implementation, these future installs are discounted using the statewide real discount rate (7.71%), see “Non-
Res Lighting ISR calculation.xlsx” for more information.
395
In service rate for Retail CFLs is based upon review of PY4-6 evaluations from ComEd Illinois commercial lighting program
(BILD).
396
Based upon review of the Illinois PY2 and PY3 ComEd Direct Install program surveys; http://www.ilsag.info/evaluation-
documents.html
397
Results in a negative value because this is an increase in heating consumption due to the efficient lighting.
Filed with the Iowa Utilities Board on September 23, 2020, EEP-2018-0002

Iowa Energy Efficiency Statewide Technical Reference Manual –3.4.1 Compact Fluorescent Lamp - Standard
Vol.3 Nonresidential Measures July 22, 2020 FINAL Page 190 of 410
SUMMER COINCIDENT PEAK DEMAND SAVINGS
Where:
WHFd = Waste heat factor for demand to account for cooling savings from efficient lighting in
cooled buildings is provided in the Lighting Reference Table in Section 3.4. If unknown,
use the Nonresidential Average value.
CF = Summer Peak Coincidence Factor for measure is provided in the Lighting Reference
Table in Section 3.4. If unknown, use the Nonresidential Average value.
NATURAL GAS ENERGY SAVINGS
Heating Penalty if fossil fuel heated building (or if heating fuel is unknown)
398
:
Where:
IFTherms = Lighting-HVAC Integration Factor for gas heating impacts; this factor represents the
increased gas space heating requirements due to the reduction of waste heat rejected by
the efficient lighting. Values are provided in Lighting Reference Table in Section 3.4. If
unknown, use the Nonresidential Average value.
PEAK GAS SAVINGS
For ease of application, savings for this measure is assumed to be evenly spread across the year. The Peak Gas Savings
is therefore assumed to be:
Where:
ΔTherms = Therm impact calculated above
HeatDays = Heat season days per year
= 197
399
WATER IMPACT DESCRIPTIONS AND CALCULATION
N/A
DEEMED O&M COST ADJUSTMENT CALCULATION
The O&M assumptions that should be used in the cost effectiveness calculation are provided below. If unknown
building type, assume Nonresidential Average:
398
Results in a negative value because this is an increase in heating consumption due to the efficient lighting.
399
Number of days where HDD 55 >0.
Filed with the Iowa Utilities Board on September 23, 2020, EEP-2018-0002

Iowa Energy Efficiency Statewide Technical Reference Manual –3.4.1 Compact Fluorescent Lamp - Standard
Vol.3 Nonresidential Measures July 22, 2020 FINAL Page 191 of 410
Building Type
Replacement Period
(years)
400
Replacement Cost
Convenience
0.91
$2.17 for bulbs <2,000 lumens
$3.44 for bulbs ≥2,000 lumens
Education
2.24
Grocery
0.90
Health
1.10
Hospital
0.64
Industrial
1.47
Lodging
1.37
Multifamily
1.37
Office - Large
1.44
Office - Small
1.44
Religious
1.74
Restaurant
0.77
Retail - Large
1.03
Retail - Small
1.14
Warehouse
1.44
Nonresidential Average
1.37
MEASURE CODE: NR-LTG-STCFL-VO1-170101
SUNSET DATE: 1/1/2018
400
Calculated by dividing assumed rated life of baseline bulb by hours of use. Assumed lifetime of EISA qualified Halogen/
Incandescents is 1000 hours. The manufacturers are simply using a regular incandescent lamp with halogen fill gas rather than
Halogen Infrared to meet the standard (as provided by G. Arnold, NEEP and confirmed by N. Horowitz at NRDC). Assumed
lifetime of CFL is 10,000 and of LED is 20,000 hours. Values provided are an average based on 70% incandescent/halogen, 25%
CFL and 5% LED (blended average of 4200 hours).
Filed with the Iowa Utilities Board on September 23, 2020, EEP-2018-0002

Iowa Energy Efficiency Statewide Technical Reference Manual –3.4.2 Compact Fluorescent Lamp - Specialty
Vol.3 Nonresidential Measures July 22, 2020 FINAL Page 192 of 410
3.4.2. Compact Fluorescent Lamp - Specialty
NOTE: THIS MEASURE IS EFFECTIVE UNTIL 12/31/2017. IT SHOULD NOT BE USED BEYOND THAT DATE BUT IS LEFT IN THE
MANUAL FOR REFERENCE PURPOSES.
DESCRIPTION
An ENERGY STAR qualified specialty compact fluorescent bulb is installed in place of an incandescent specialty bulb.
This characterization assumes that the CFL is installed in a commercial location. This is therefore appropriate for
commercially targeted programs, or, if the implementation strategy does not allow for the installation location to
be known (e.g., an upstream retail program), utilities should develop an assumption of the Residential v
Nonresidential split and apply the relevant assumptions to each portion.
The Technical Advisory Committee approved assuming a blended baseline condition of EISA qualified
incandescent/halogen, CFL and LED lamps. This assumption should be reviewed during each update cycle and when
the net to gross impacts for this measure are determined.
This measure was developed to be applicable to the following program types: TOS, RF, DI.
If applied to other program types, the measure savings should be verified.
DEFINITION OF EFFICIENT EQUIPMENT
Energy Star qualified specialty CFL bulb based upon the v1.1 ENERGY STAR specification for lamps
(http://www.energystar.gov/sites/default/files/ENERGY%20STAR%20Lamps%20V1%201_Specification.pdf)https://
www.energystar.gov/sites/default/files/ENERGY%20STAR%20Lamps%20V1%201_Specification.pdf). Note a new
ENERGY STAR specification v2.0 will become effective on 1/2/2017
(https://www.energystar.gov/sites/default/files/ENERGY%20STAR%20Lamps%20V2%20Revised%20Spec.pdfhttps:
//www.energystar.gov/sites/default/files/asset/document/ENERGY%20STAR%20Lamps%20V2%20Revised%20Spe
c.pdf).
DEFINITION OF BASELINE EQUIPMENT
The baseline condition for this measure is assumed to be a blend of 80% EISA qualified halogen or incandescent and
10% CFL and 10% LED
401
. Lamp types includes those exempt of the EISA 2007 standard: three-way, plant light,
daylight bulb, bug light, post light, globes G40 (≤40W equivalent (We)), candelabra base (≤60We), vibration service
bulb, decorative candle with medium or intermediate base (≤40We), shatter resistant, and reflector bulbs and
standard bulbs greater than 2601 lumens, and those non-exempt from EISA 2007: dimmable, globes (less than 5”
diameter and >40We), candle (shapes B, BA, CA >40We), candelabra base lamps (>60We), and intermediate base
lamps (>40We).
DEEMED LIFETIME OF EFFICIENT EQUIPMENT
The expected measure life should be calculated by dividing the rated life of the bulb (10,000 hours
402
) by the run
hours for the building type. For example, using the average Nonresidential assumption of 3065 hours would give 3.3
years.
DEEMED MEASURE COST
Wherever possible, actual incremental costs should be used. If unavailable, assume the following incremental
401
As proposed and discussed by Iowa TRM Oversight Committee and Technical Advisory Committee.
402
As per ENERGY STAR Lamp evaluation specification V1.1, ENERGY STAR bulbs will have a rated life of at least 10,000 hours.
Filed with the Iowa Utilities Board on September 23, 2020, EEP-2018-0002

Iowa Energy Efficiency Statewide Technical Reference Manual –3.4.2 Compact Fluorescent Lamp - Specialty
Vol.3 Nonresidential Measures July 22, 2020 FINAL Page 193 of 410
costs
403
:
Bulb Type
CFL Wattage
CFL
Incandescent
LED
Blended
Baseline
404
Incremental
Cost
Directional
< 20W
$7.84
$6.31
$14.52
$7.28
$0.56
≥20W
$9.31
$45.85
$10.56
-$1.25
Decorative and
Globes
<15W
$7.80
$3.92
$8.09
$4.73
$3.08
≥15W
$8.15
$15.86
$5.54
$2.61
For other bulb types, or unknown, assume the incremental capital cost of $1.81 (blended baseline cost of $6.01 and
efficient cost of $7.82
405
).
For the Direct Install measure, the full CFL cost should be used plus $10 labor
406
. However, actual program delivery
costs should be used if available.
LOADSHAPE
Loadshape NREL01:16 – Nonresidential Lighting (by Building Type)
Algorithm
CALCULATION OF SAVINGS
ELECTRIC ENERGY SAVINGS
Where:
Watts
Base
= Based on lumens of CFL bulb installed and includes blend of incandescent/halogen
407
,
CFL and LED by weightings provided in table below
408
. Note that when an IA net-to-gross
(NTG) factor is determined for this measure, this blended baseline should be replaced
with the Incandescent/Halogen baseline only.
Watts
EE
= Actual wattage of energy efficient specialty bulb purchased - If unknown, assume the
following defaults
409
:
403
Incandescent/halogen and CFL costs are based on “2010-2012 WA017 Ex Ante Measure Cost Study Draft Report”, Itron,
February 28, 2014. LED lamp costs are based on a 2014/2015 VEIC review of a year’s worth of LED sales through VEIC
implemented programs. The retail cost was averaged and then DOE price projection trends (from Department of Energy, 2012;
“Energy Savings Potential of Solid-State Lighting in General Illumination Applications”, Table A.1) used to decrease the cost for a
2017 TRM assumption (see 2015 LED Sales Review.xls). LED costs are falling rapidly and should be reviewed in each update
cycle.
404
Assumes 80% Incandescent/halogen, 10% CFL and 10% LED.
405
Average of lower wattage bins.
406
Assumption based on 15 minutes (including portion of travel time) and $40 per hour.
407
Incandescent/Halogen wattage is based upon the ENERGY STAR specification for lamps
(http://www.energystar.gov/sites/default/files/ENERGY%20STAR%20Lamps%20V1%201_Specification.pdf) and the Energy
Policy and Conservation Act of 2012.
408
Weightings were determined through discussions with the Technical Advisory Committee. These are based upon review of
Itron socket saturation and inventory data, in addition to review of multiple other data sources on the lighting market in other
jurisdictions.
409
Watts
EE
defaults are based upon the average available ENERGY STAR product, accessed 06/18/2015. For any lamp type /
lumen range where there is no ENERGY STAR product currently available, Watts
EE
is based upon the ENERGY STAR minimum
luminous efficacy (Omnidirectional; 55Lm/W for lamps with rated wattages less than 15W and 65 Lm/W for lamps with rated
Filed with the Iowa Utilities Board on September 23, 2020, EEP-2018-0002

Iowa Energy Efficiency Statewide Technical Reference Manual –3.4.2 Compact Fluorescent Lamp - Specialty
Vol.3 Nonresidential Measures July 22, 2020 FINAL Page 194 of 410
EISA exempt bulb types:
Bulb Type
Lower
Lumen
Range
Upper
Lumen
Range
Inc/Halogen
Watts
EE
CFL
LED
Watts
Base
Delta
Watts
CFL
80%
10%
10%
EISA Exempt
3-Way
250
449
25
6.4
6.4
21.3
14.9
450
799
40
11.4
11.4
34.3
22.9
800
1,099
60
13.0
10.0
50.3
37.3
1,100
1,599
75
20.8
13.1
63.4
42.6
1,600
1,999
100
26.0
19.4
84.5
58.6
2,000
2,549
125
32.2
35.0
106.7
74.5
2,550
2,999
150
40.0
42.7
128.3
88.3
Globe
(medium and intermediate
bases less than 750 lumens)
90
179
10
3.0
3.0
8.6
5.6
180
249
15
4.8
4.8
13.0
8.2
250
349
25
6.7
4.1
21.1
14.4
350
749
40
9.9
6.5
33.6
23.7
Decorative
(Shapes B, BA, C, CA, DC, F,
G, medium and intermediate
bases less than 750 lumens)
70
89
10
1.8
1.8
8.4
6.6
90
149
15
2.7
2.7
12.5
9.9
150
299
25
5.0
3.7
20.9
15.9
300
749
40
7.5
5.3
33.3
25.7
Globe
(candelabra bases less than
1050 lumens)
90
179
10
3.0
3.0
8.6
5.6
180
249
15
4.8
4.8
13.0
8.2
250
349
25
6.7
4.1
21.1
14.4
350
499
40
9.4
4.8
33.4
24.0
500
1,049
60
15.5
7.0
50.2
34.8
Decorative
(Shapes B, BA, C, CA, DC, F,
G, candelabra bases less than
1050 lumens)
70
89
10
1.8
1.8
8.4
6.6
90
149
15
2.7
2.7
12.5
9.9
150
299
25
5.0
3.0
20.8
15.8
300
499
40
7.7
4.7
33.2
25.6
500
1,049
60
15.5
6.9
50.2
34.7
Directional Lamps - For Directional R, BR, and ER lamp types
410
:
Bulb Type
Lower
Lumen
Range
Upper
Lumen
Range
Inc/Halogen
Watts
EE
CFL
LED
Watts
Base
Delta
Watts
CFL
80%
10%
10%
Directional
R, ER, BR with medium screw
bases w/ diameter >2.25"
(*see exceptions below)
420
472
40
11.0
7.5
33.9
22.9
473
524
45
12.5
7.9
38.0
25.6
525
714
50
14.9
9.1
42.4
27.5
715
937
65
15.6
12.6
54.8
39.2
938
1,259
75
21.1
16.1
63.7
42.6
1,260
1,399
90
23.0
17.8
76.1
53.1
1,400
1,739
100
31.4
19.2
85.1
53.7
1,740
2,174
120
39.1
25.6
102.5
63.3
2,175
2,624
150
48.0
28.8
127.7
79.7
2,625
2,999
175
56.2
56.2
151.2
95.0
wattages ≥ 15 watts, Directional; 40Lm/W for lamps with rated wattages less than 20Wand 50 Lm/W for lamps with rated
wattages ≥ 20 watts and Decorative; 45Lm/W for lamps with rated wattages less than 15W, 50lm/W for lamps ≥15 and <25W,
60 Lm/W for ≥ 25 watts) for the mid-point of the lumen range. See calculation at “cerified-light-bulbs-2015-06-18.xlsx” . These
assumptions should be reviewed regularly to ensure they represent the available product.
410
From pg 11 of the Energy Star Specification for lamps v1.1.
Filed with the Iowa Utilities Board on September 23, 2020, EEP-2018-0002

Iowa Energy Efficiency Statewide Technical Reference Manual –3.4.2 Compact Fluorescent Lamp - Specialty
Vol.3 Nonresidential Measures July 22, 2020 FINAL Page 195 of 410
Bulb Type
Lower
Lumen
Range
Upper
Lumen
Range
Inc/Halogen
Watts
EE
CFL
LED
Watts
Base
Delta
Watts
CFL
80%
10%
10%
3,000
4,500
200
75.0
75.0
175.0
100.0
*R, BR, and ER with medium
screw bases w/ diameter
≤2.25"
400
449
40
10.6
6.3
33.7
23.1
450
499
45
11.9
6.8
37.9
26.0
500
649
50
14.4
7.3
42.2
27.8
650
1,199
65
18.5
13.3
55.2
36.7
*ER30, BR30, BR40, or ER40
400
449
40
10.6
10.6
34.1
23.5
450
499
45
11.9
11.9
38.4
26.5
500
649
50
14.4
12.0
42.6
28.3
*BR30, BR40, or ER40
650
1,419
65
18.0
12.4
55.0
37.1
*R20
400
449
40
10.6
10.6
34.1
23.5
450
719
45
12.5
7.7
38.0
25.5
*All reflector lamps below
lumen ranges specified
above
200
299
20
6.2
4.0
17.0
10.8
300
399
30
8.7
6.2
25.5
16.8
Directional lamps are exempt from EISA regulations
EISA non-exempt bulb types:
Bulb Type
Lower
Lumen
Range
Upper
Lumen
Range
Inc/Halogen
Watts
EE
CFL
LED
Watts
Base
Delta
Watts
CFL
80%
10%
10%
EISA Non
-
Exempt
Dimmable Twist, Globe (less
than 5" in diameter and > 749
lumens), candle (shapes B, BA,
CA > 749 lumens), Candelabra
Base Lamps (>1049 lumens),
Intermediate Base Lamps (>749
lumens)
250
309
25
5.1
4.1
20.9
15.8
310
749
29
9.5
6.6
24.8
15.3
750
1049
43
13.5
10.1
36.8
23.3
1050
1489
53
18.9
12.8
45.6
26.6
1490
2600
72
24.8
17.4
61.8
37.0
ISR = In Service Rate or the percentage of units rebated that get installed
=100%
411
if application form completed with sign off that equipment is not placed into
storage. If sign off form not completed, assume the following:
Program
Discounted
In Service Rate (ISR)
412
Retail (Time of Sale)
413
95%
Direct Install
414
and Retrofit
97%
Hours = Average hours of use per year are provided in the Lighting Reference Table in Section
411
Illinois evaluation of PY1 through PY3 has not found that fixtures or lamps placed into storage to be a significant enough
issue to warrant including an “In-Service Rate” when commercial customers complete an application form.
412
All Programs except for Direct Install assume that some lamps are not installed in the first year but are later installed in years
2 and 3. To ease implementation, these future installs are discounted using the statewide real discount rate (7.71%); see “Non-
Res Lighting ISR calculation.xlsx” for more information.
413
In service rate for Retail CFLs is based upon review of PY4-6 evaluations from ComEd’s, Illinois commercial lighting program
(BILD).
414
Based upon review of the Illinois PY2 and PY3 ComEd Direct Install program surveys; http://www.ilsag.info/evaluation-
documents.html
Filed with the Iowa Utilities Board on September 23, 2020, EEP-2018-0002

Iowa Energy Efficiency Statewide Technical Reference Manual –3.4.2 Compact Fluorescent Lamp - Specialty
Vol.3 Nonresidential Measures July 22, 2020 FINAL Page 196 of 410
3.4 - If unknown, use the Nonresidential Average value
WHFe = Waste heat factor for energy to account for cooling energy savings from efficient lighting
are provided below for each building type in the Lighting Reference Table in Section 3.4 -
If unknown, use the Nonresidential Average value
Heating Penalty:
If electrically heated building
415
:
)
Where:
IFkWh = Lighting-HVAC Interation Factor for electric heating impacts; this factor represents the
increased electric space heating requirements due to the reduction of waste heat rejected
by the efficent lighting. Values are provided in the Lighting Reference Table in Section 3.4
- If unknown, use the Nonresidential Average value
SUMMER COINCIDENT PEAK DEMAND SAVINGS
Where:
WHFd = Waste heat factor for demand to account for cooling savings from efficient lighting in
cooled buildings is provided in the Lighting Reference Table in Section 3.4 - If unknown,
use the Nonresidential Average value
CF = Summer Peak Coincidence Factor for measure is provided in the Lighting Reference
Table in Section 3.4 - If unknown, use the Nonresidential Average value
NATURAL GAS SAVINGS
Heating Penalty if fossil fuel heated building (or if heating fuel is unknown)
416
:
Where:
IFTherms = Lighting-HVAC Integration Factor for gas heating impacts; this factor represents the
increased gas space heating requirements due to the reduction of waste heat rejected by
the efficient lighting. Values are provided in the Lighting Reference Table in Section 3.4 -
If unknown, use the Nonresidential Average value
PEAK GAS SAVINGS
For ease of application, savings for this measure is assumed to be evenly spread across the year. The Peak Gas Savings
is therefore assumed to be:
Where:
415
Results in a negative value because this is an increase in heating consumption due to the efficient lighting.
416
Results in a negative value because this is an increase in heating consumption due to the efficient lighting.
Filed with the Iowa Utilities Board on September 23, 2020, EEP-2018-0002

Iowa Energy Efficiency Statewide Technical Reference Manual –3.4.2 Compact Fluorescent Lamp - Specialty
Vol.3 Nonresidential Measures July 22, 2020 FINAL Page 197 of 410
ΔTherms = Therm impact calculated above
HeatDays = Heat season days per year
= 197
417
WATER IMPACT DESCRIPTIONS AND CALCULATION
N/A
DEEMED O&M COST ADJUSTMENT CALCULATION
The O&M assumptions that should be used in the cost effectiveness calculation are provided below. If unknown,
building type assume Nonresidential Average:
Building Type
Replacement Period (years)
Directional
418
Decorative/Globe
419
Unknown
420
Replacement Cost
421
Convenience
0.93
0.71
0.82
Directional:
$7.28 for < 20W,
$10.56 for ≥20W
Decorative/Globe:
$4.73 for <15W,
$5.54 for ≥15W
Unknown: $6.01
Education
2.29
1.76
2.02
Grocery
0.92
0.71
0.81
Health
1.13
0.87
1.00
Hospital
0.66
0.51
0.58
Industrial
1.51
1.16
1.33
Lodging
1.40
1.08
1.24
Multifamily
1.40
1.08
1.24
Office - Large
1.47
1.13
1.30
Office - Small
1.47
1.13
1.30
Religious
1.78
1.37
1.58
Restaurant
0.79
0.61
0.70
Retail - Large
1.06
0.81
0.93
Retail - Small
1.16
0.89
1.03
Warehouse
1.47
1.13
1.30
Nonresidential
Average
1.40
1.08
1.24
MEASURE CODE: NR-LTG-SPCFL-VO1-170101
SUNSET DATE: 1/1/2018
417
Number of days where HDD 55 >0.
418
Calculated by dividing assumed rated life of baseline bulb by hours of use. Assumed lifetime of EISA qualified Halogen/
Incandescents is 1000 hours. The manufacturers are simply using a regular incandescent lamp with halogen fill gas rather than
Halogen Infrared to meet the standard (as provided by G. Arnold, NEEP and confirmed by N. Horowitz at NRDC). Assumed
lifetime of CFL is 10,000 and of LED is 25,000 hours. Values provided are an average based on 80% incandescent/halogen, 10%
CFL and 10% LED (blended average of 4300 hours).
419
Assumed rated life of incandescent/halogen is 1000 hours, CFL is 10,000 and decorative LED is 15,000 hours. Values
provided are an average based on 80% incandescent/halogen, 10% CFL and 10% LED (blended average of 3300 hours).
420
Values provided are an average of directional and decorative (blended average of 3800 hours).
421
Incandescen/halogen and CFL costs based on “2010-2012 WA017 Ex Ante Measure Cost Study Draft Report”, Itron, February
28, 2014. LED lamp costs are based on a 2014/2015 VEIC review of a year’s worth of LED sales through VEIC implemented
programs. The retail cost was averaged and then DOE price projection trends (from Department of Energy, 2012; “Energy
Savings Potential of Solid-State Lighting in General Illumination Applications”, Table A.1) used to decrease the cost for a 2017
TRM assumption (see 2015 LED Sales Review.xls). LED costs are falling rapidly and should be reviewed in each update cycle.
Baseline based on 80% Incandescent/halogen, 10% CFL and 10% LED.
Filed with the Iowa Utilities Board on September 23, 2020, EEP-2018-0002

Iowa Energy Efficiency Statewide Technical Reference Manual –3.4.3 LED Lamp Standard
Vol.3 Nonresidential Measures July 22, 2020 FINAL Page 198 of 410
3.4.3. LED Lamp Standard
DESCRIPTION
LEDs lighting systems convert electricity to light and emit more lumens per watt when compared to baseline EISA
incandescent, halogen, or compact fluorescent lamps. In addition, LED’s inherent directionality reduces or eliminates
the need for a reflector to direct light, thereby reducing or eliminating fixture efficiency losses. These factors make
LEDs a highly efficient alternative to standard interior and exterior lighting options.
This specific characterization provides savings assumptions for LED lamps that replace standard screw-in connections
(e.g., A-Type lamp) such as interior/exterior omnidirectional lamp options.
This characterization assumes that the LED is installed in a commercial location. This is therefore appropriate for
commercially targeted programs, or, if the implementation strategy does not allow for the installation location to
be known (e.g., an upstream retail program), utilities should develop an assumption of the Residential vs.
Nonresidential split and apply the relevant assumptions to each portion.
Federal legislation stemming from the Energy Independence and Security Act of 2007 (EISA) requires all general-
purpose light bulbs between 40W and 100W to be approximately 30% more energy efficient than standard
incandescent bulbs. Production of 100W, standard efficacy incandescent lamps ended in 2012, followed by
restrictions on 75W lamps in 2013 and 60W and 40W lamps in 2014. The baseline for this measure has therefore
become bulbs (improved incandescent or halogen) that meet the new standard. Furthermore, the Technical Advisory
Committee approved assuming a blended baseline condition of EISA qualified incandescent/halogen, CFL and LED
lamps. This assumption should be reviewed during each update cycle and when the net to gross impacts for this
measure are determined.
In December 2019, DOE issued a final determination for General Service Incandescent Lamps (GSILs), finding that
the more stringent standards (45 lumen per watt) prescribed in the 2007 EISA regulation to become effective in 2020
(known as the ‘Backstop’ provision) were not economically justified. However, natural growth of LED market share
has and will continue to grow over the lifetime of the measure, and since baseline halogens would need to be
replaced multiple times within the life of the measure, a single mid-life adjustment is calculated that results in an
equivalent net present value of lifetime savings as the forecast decline in annual savings.
This measure was developed to be applicable to the following program types: TOS, RF.
If applied to other program types, the measure savings should be verified.
DEFINITION OF EFFICIENT EQUIPMENT
In order for this characterization to apply, new LED screw-based lamps must be ENERGY STAR qualified based upon
the v2.1 ENERGY STAR specification for lamps
(https://www.energystar.gov/sites/default/files/ENERGY%20STAR%20Lamps%20V2.1%20Final%20Specification_1.
pdf ) or CEE Tier 2 qualified. Specifications are as follows:
Efficiency Level
Lumens / watt
CRI<90
CRI≥90
ENERGY STAR v2.1
80
70
CEE Tier 2
422
95
80
Qualification could also be based or on the Design Light Consortium’s qualified product list.
423
422
Also required to have rated life of 25,000 hours and dimming capability.
423
https://www.designlights.org/QPL
Filed with the Iowa Utilities Board on September 23, 2020, EEP-2018-0002

Iowa Energy Efficiency Statewide Technical Reference Manual –3.4.3 LED Lamp Standard
Vol.3 Nonresidential Measures July 22, 2020 FINAL Page 199 of 410
DEFINITION OF BASELINE EQUIPMENT
The baseline condition for this measure is assumed to be a blend of 43% EISA qualified halogen or incandescent and
1% CFL and 56%LED.
424
The baseline is forecast to continue to shift towards LEDs and therefore a mid-life adjustment
is provided.
DEEMED LIFETIME OF EFFICIENT EQUIPMENT
The lifetime of the product is the lamp life in hours divided by operating hours per year. Depending on operating
conditions (currents and temperatures) and other factors (settings and building use), LED rated life is assumed to
be 20,230.
425
DEEMED MEASURE COST
Wherever possible, actual incremental costs should be used. If unavailable, assume the following incremental
costs:
426
Lamp Type
CRI
Product Type
Cost
Incremental Cost
Standard
A-lamp
<90
Baseline
$2.39
n/a
ESTAR LED
$3.16
$0.77
CEE T2 LED
$3.29
$0.90
>=90
Baseline
$2.68
n/a
ESTAR LED
$3.67
$0.99
CEE T2 LED
$3.75
$1.07
LOADSHAPE
Loadshape NREL01:16 – Nonresidential Lighting (by Building Type)
Algorithm
CALCULATION OF SAVINGS
ELECTRIC ENERGY SAVINGS
Where:
Watts
Base
= Based on lumens of LED bulb installed as and includes blend of incandescent/
halogen,
427
CFL, and LED by weightings provided in table below.
428
Note that when an IA
net-to-gross (NTG) factor is determined for this measure, this blended baseline should be
replaced with the Incandescent/Halogen baseline only. A custom value can be entered if
424
Based on review of CREED LightTracker data and DOE, 2019 ‘Energy Savings Forecast of Solid-State Lighting in General
Illumination Applications’. See ‘Lighting Forecast Workbook.xls’.
425
Average rated life of omnidirectional bulbs on the ENERGY STAR qualified products list as of April, 2020.
426
Lamp costs are based upon WECC review of bulbs purchased through the Alliant program January – April 2017. The baseline
cost reflects the baseline mix. See “2020 LED Measure Cost and O&M Calc.xls” for more information.
427
Incandescent/Halogen wattage is based upon the post first phase of EISA.
428
Weightings based upon review of CREED LightTracker data for Illinois and DOE, 2019 ‘Energy Savings Forecast of Solid-State
Lighting in General Illumination Applications’. See ‘Lighting Forecast Workbook.xls’.
Filed with the Iowa Utilities Board on September 23, 2020, EEP-2018-0002

Iowa Energy Efficiency Statewide Technical Reference Manual –3.4.3 LED Lamp Standard
Vol.3 Nonresidential Measures July 22, 2020 FINAL Page 200 of 410
the configurations in the tables are not representative of the exisitng system.
Watts
EE
= Actual wattage of LED purchased/installed. If unknown, use default provided below:
429
Lower
Lumen
Range
Upper
Lumen
Range
Inc/
Halogen
CFL
430
LED
431
Watts
Base
WattsEff
ESTAR
WattsEff
CEE T2
DeltaWatts
ESTAR
DeltaWatts
CEE T2
43%
1%
56%
CRI
<90
CRI
>=90
CRI
<90
CRI
>=90
CRI
<90*
CRI
>=90
CRI
<90
CRI
>=90
250
309
25
4.7
3.7
12.8
3.5
4.0
2.9
3.5
9.4
8.9
9.9
9.4
310
749
29
8.8
7.1
16.5
6.6
7.6
5.6
6.6
9.9
8.9
10.9
9.9
750
1049
43
15.0
12.0
25.3
11.2
12.9
9.5
11.2
14.1
12.5
15.8
14.1
1050
1489
53
21.2
16.9
32.4
15.9
18.1
13.4
15.9
16.6
14.3
19.1
16.6
1490
2600
72
34.1
27.3
46.5
25.6
29.2
21.5
25.6
20.9
17.3
25.0
20.9
2601
3300
150
49.2
39.3
86.8
36.9
42.2
31.1
36.9
50.0
44.7
55.8
50.0
3301
3999
200
60.8
48.7
113.6
45.6
52.1
38.4
45.6
68.0
61.5
75.2
68.0
4000
6000
300
83.3
66.7
166.8
62.5
71.4
52.6
62.5
104.3
95.4
114.2
104.3
Weighted Average, if unknown
432
27.1
12.4
14.6
*If lumen range is known but Efficiency rating or CRI is unknown assume ESTAR and CRI<90.
Hours = Average hours of use per year as provided by the customer or selected from the Lighting
Reference Table in Section 3.4. If hours or building type are unknown, use the
Nonresidential Average value.
WHFe
= Waste heat factor for energy to account for cooling energy savings from efficient lighting
is selected from the Lighting Reference Table in Section 3.4 for each building type. If
unknown, use the Nonresidential Average value.
ISR = In Service Rate or the percentage of units rebated that get installed
=100% if application form completed with sign off that equipment is not placed into
storage. If sign off form not completed, assume the following:
Program
Discounted
In Service Rate (ISR)
433
Retail (Time of Sale)
434
89%
Direct Install
435
and Retrofit
97%
429
Watts
EE
are calculated using the midpoint of the lumen range and an efficacy of 80 lumens/watt for ESTAR CRI <90,70
lumens/watt for ESTAR CRI>90, 95 lumens/watt for CEE Tier 2 CRI <90,80 lumens/watt for CEE Tier 2 CRI>90,
430
Baseline CFL watts are calculated using the midpoint of the lumen range and an assumed efficacy of 60 lumens/watt.
431
Baseline LED watts are calculated using the midpoint of the lumen range and an assumed efficacy of 75 lumens/watt.
432
Weighted average is based on 2018 and 2019 data provided by MidAmerican and Alliant. Assumes ENERGY STAR CRI<90 for
the efficient wattage.
433
All Programs except for Direct Install assume that some lamps are not installed in the first year but are later installed in
years 2 and 3. To ease implementation, these future installs are discounted using the statewide real discount rate (7.71%). The
second and third year installations rates are from NREL, “Chapter 6: Residential Lighting Evaluation Protocol of the Uniform
Methods Project,” October 2017. See “Non-Res Lighting ISR calculation_2019.xlsx” for more information.
434
The 1
st
year in service rate for Retail LEDs is a weighted average based on PY7 and PY9 evaluations from ComEd’s, Illinois
commercial lighting program (BILD) and PY9 data from Ameren Illinois Instant Incentives program.
435
Consistent with CFL assumption. Based upon review of the Illinois PY2 and PY3 ComEd Direct Install program surveys;
http://www.ilsag.info/evaluation-documents.html
Filed with the Iowa Utilities Board on September 23, 2020, EEP-2018-0002

Iowa Energy Efficiency Statewide Technical Reference Manual –3.4.3 LED Lamp Standard
Vol.3 Nonresidential Measures July 22, 2020 FINAL Page 201 of 410
Mid-Life Baseline Adjustment
During the lifetime of a standard Omnidirectional LED, the baseline incandescent/halogen bulb would need to be
replaced multiple times. In December 2019, DOE issued a final determination for General Service Incandescent
Lamps (GSILs), finding that the more stringent standards (45 lumen per watt) prescribed in the 2007 EISA regulation
to become effective in 2020 (known as the ‘Backstop’ provision) were not economically justified. However, natural
growth of LED market share has and will continue to grow over the lifetime of the measure, and so a single mid-life
adjustment is calculated that results in an equivalent net present value of lifetime savings as the forecast decline in
annual savings. See ‘Lighting Forecast Workbook_2020.xls’ for details.
The calculated mid-life adjustments for 2021 are provided below for each fixture type:
Lamp Category
Year on adjustment
is applied
Adjustment
ENERGY STAR
5
45%
CEE Tier 2
5
51%
Heating Penalty:
If electrically heated building:
436
Where:
IFkWh = Lighting-HVAC Interation Factor for electric heating impacts; this factor represents the
increased electric space heating requirements due to the reduction of waste heat rejected
by the efficent lighting. Values are provided in the Lighting Reference Table in Section 3.4.
If unknown, use the Nonresidential Average value.
SUMMER COINCIDENT PEAK DEMAND SAVINGS
Where:
WHFd = Waste Heat Factor for Demand to account for cooling savings from efficient lighting in
cooled buildings is provided in the Lighting Reference Table in Section 3.4. If unknown,
use the Nonresidential Average value.
CF = Summer Peak Coincidence Factor for measure is provided in the Lighting Reference
Table in Section 3.4. If unknown, use the Nonresidential Average value.
NATURAL GAS ENERGY SAVINGS
Heating Penalty if fossil fuel heated building (or if heating fuel is unknown):
437
Where:
436
Results in a negative value because this is an increase in heating consumption due to the efficient lighting.
437
Results in a negative value because this is an increase in heating consumption due to the efficient lighting.
Filed with the Iowa Utilities Board on September 23, 2020, EEP-2018-0002

Iowa Energy Efficiency Statewide Technical Reference Manual –3.4.3 LED Lamp Standard
Vol.3 Nonresidential Measures July 22, 2020 FINAL Page 202 of 410
IFTherms = Lighting-HVAC Integration Factor for gas heating impacts; this factor represents the
increased gas space heating requirements due to the reduction of waste heat rejected by
the efficient lighting. Values are provided in the Lighting Reference Table in Section 3.4.
If unknown, use the Nonresidential Average value.
PEAK GAS SAVINGS
For ease of application, savings for this measure is assumed to be evenly spread across the year. The Peak Gas Savings
is therefore assumed to be:
Where:
ΔTherms = Therm impact calculated above
HeatDays = Heat season days per year
= 197
438
WATER IMPACT DESCRIPTIONS AND CALCULATION
N/A
DEEMED O&M COST ADJUSTMENT CALCULATION
In order to account for the shift in baseline due to the natural growth of LED over the lifetime of the measure, an
annual levelized baseline replacement cost over the lifetime of the LED bulb is calculated. Bulb replacement costs
assumed in the O&M calculations are provided below:
439
CRI
Product
Type
Cost
<90
Inc/Hal
$1.40
CFL
$1.68
LED
$3.16
>=90
Inc/Hal
$1.40
CFL
$1.95
LED
$3.67
The present value of replacement lamps and annual levelized replacement costs using the statewide real discount
rate of 7.20% are presented below:
440
PV of replacement
costs for period
Levelized annual
replacement cost savings
CRI
Location
2021 Installs
2021 Installs
<90
Non Residential Average
$7.44
$1.07
>=90
Non Residential Average
$7.52
$1.08
MEASURE CODE: NR-LTG-LEDA-V05-210101
438
Number of days where HDD 55 >0.
439
Lamp costs are based upon WECC review of bulbs purchased through the Alliant program January – April 2017 and
equivalent baseline bulbs.
440
See “2020 LED Measure Cost and O&M Calc.xlsx” for more information. The values assume the non-residential average
hours assumption of 3065.
Filed with the Iowa Utilities Board on September 23, 2020, EEP-2018-0002

Iowa Energy Efficiency Statewide Technical Reference Manual –3.4.3 LED Lamp Standard
Vol.3 Nonresidential Measures July 22, 2020 FINAL Page 203 of 410
SUNSET DATE: 1/1/2022
Filed with the Iowa Utilities Board on September 23, 2020, EEP-2018-0002

Iowa Energy Efficiency Statewide Technical Reference Manual –3.4.4 LED Lamp Specialty
Vol.3 Nonresidential Measures July 22, 2020 FINAL Page 204 of 410
3.4.4. LED Lamp Specialty
DESCRIPTION
LEDs lighting systems convert electricity to light and emit more lumens per watt when compared to incandescent,
halogen or compact fluorescent lamps. In addition, LED’s inherent directionality reduces or eliminates the need for
a reflector to direct light, thereby reducing or eliminating fixture efficiency losses. These factors make LEDs a highly
efficient alternative to standard interior and exterior lighting options.
This specific characterization provides savings assumptions for LED Directional, Decorative, and Globe lamps.
This characterization assumes that the LED is installed in a commercial location. This is therefore appropriate for
commercially targeted programs, or, if the implementation strategy does not allow for the installation location to
be known (e.g., an upstream retail program), utilities should develop an assumption of the Residential v
Nonresidential split and apply the relevant assumptions to each portion.
The Technical Advisory Committee approved assuming a blended baseline condition of EISA qualified
incandescent/halogen, CFL and LED lamps. This assumption should be reviewed during each update cycle and when
the net to gross impacts for this measure are determined.
A DOE Final Rule released on 1/19/2017 updated the definition of General Service Lamps (GSL) as provided in the
2009 Energy Independence and Security Act (EISA) such that the lamp types characterized in this measure would
become subject to the backstop provision in EISA, which requires that after January 1, 2020, all lamps meet efficiency
criteria of at least 45 lumens per watt.
On 9/5/2019 DOE repealed the 2017 Final rule, preventing this expansion of the definition of General Service Lamp
to include these lamps. However, natural growth of LED market share has and will continue to grow over the lifetime
of the measure, and since baseline halogens would need to be replaced multiple times within the life of the measure,
a single mid-life adjustment is calculated that results in an equivalent net present value of lifetime savings as the
forecast decline in annual savings.
This measure was developed to be applicable to the following program types: TOS, RF.
If applied to other program types, the measure savings should be verified.
DEFINITION OF EFFICIENT EQUIPMENT
In order for this characterization to apply, new LED lamps must be ENERGY STAR qualified based upon the v2.1
ENERGY STAR specification for lamps
(https://www.energystar.gov/sites/default/files/ENERGY%20STAR%20Lamps%20V2.1%20Final%20Specification_1.
pdf) or CEE Tier 2 qualified. Specifications are as follows:
Efficiency Level
Lamp Type
Lumens / watt
CRI<90
CRI≥90
ENERGY STAR v2.1
Directional
70
61
Decorative / Globe
65
65
CEE Tier 2
441
Directional
85
70
Decorative / Globe
95
80
Qualification could also be based on the Design Light Consortium’s qualified product list.
442
DEFINITION OF BASELINE EQUIPMENT
441
Also required to have dimming capability.
442
https://www.designlights.org/QPL
Filed with the Iowa Utilities Board on September 23, 2020, EEP-2018-0002

Iowa Energy Efficiency Statewide Technical Reference Manual –3.4.4 LED Lamp Specialty
Vol.3 Nonresidential Measures July 22, 2020 FINAL Page 205 of 410
The baseline condition for this measure is assumed to be a blend of 46% EISA qualified halogen or incandescent
and 54% baseline LED for decorative and globe lamps, and 15% EISA qualified halogen or incandescent and 85%
baseline LED for decorative and globe lamps.
443
Lamp types include those exempt of the EISA 2007 standard:
three-way, plant light, daylight bulb, bug light, post light, globes G40 (≤40W equivalent(We)), candelabra base
(≤60We), vibration service bulb, decorative candle with medium or intermediate base (≤40We), shatter resistant,
and reflector bulbs and standard bulbs greater than 2601 lumens, and those non-exempt from EISA 2007:
dimmable, globes (less than 5” diameter and >40We), candle (shapes B, BA, CA >40We), candelabra base lamps
(>60We), and intermediate base lamps (>40We). Note however that all lamps are subject a baseline shift to
account for the natural growth in LEDs over the lifetime of the measure.
DEEMED LIFETIME OF EFFICIENT EQUIPMENT
The rated life for directional bulbs is assumed to be 25,042 hours and for decorative bulbs is 17,129 hours.
444
DEEMED MEASURE COST
Wherever possible, actual incremental costs should be used. If unavailable, assume the following incremental
costs:
445
Bulb Type
CRI
Product Type
Cost
Incremental Cost
Directional
<90
Baseline
$7.38
n/a
ESTAR LED
$7.80
$0.42
CEE T2 LED
$18.96
$11.58
>=90
Baseline
$7.23
n/a
ESTAR LED
$7.63
$0.39
CEE T2 LED
$18.54
$11.31
Decorative
<90
Baseline
$5.43
n/a
ESTAR LED
$7.50
$2.07
CEE T2 LED
$7.83
$2.40
>=90
Baseline
$6.07
n/a
ESTAR LED
$8.69
$2.62
CEE T2 LED
$9.08
$3.00
LOADSHAPE
Loadshape NREL01:16 – Nonresidential Lighting (by Building Type)
443
Based on review of CREED LightTracker data for Illinois and DOE, 2019 ‘Energy Savings Forecast of Solid-State Lighting in
General Illumination Applications’. See ‘Lighting Forecast Workbook.xls’.
444
Average rated life of directional and decorative bulbs on the ENERGY STAR qualified products list as of April, 2020.
445
Lamp costs are based upon WECC review of bulbs purchased through the Alliant program January – April 2017. The baseline
cost reflects the baseline mix. See “2020 LED Measure Cost and O&M Calc.xls” for more information.
Filed with the Iowa Utilities Board on September 23, 2020, EEP-2018-0002

Iowa Energy Efficiency Statewide Technical Reference Manual –3.4.4 LED Lamp Specialty
Vol.3 Nonresidential Measures July 22, 2020 FINAL Page 206 of 410
Algorithm
CALCULATION OF SAVINGS
ELECTRIC ENERGY SAVINGS
Where:
Watts
Base
= Based on lumens of LED bulb installed and includes blend of incandescent/halogen,
446
CFL and LED by weightings provided in table below.
447
Note that when an IA net-to-gross
(NTG) factor is determined for this measure, this blended baseline should be replaced
with the Incandescent/Halogen baseline only.
Watts
EE
= Actual wattage of LED purchased/installed. If unknown, use default provided below.
448
446
Incandescent/Halogen wattage is based upon the ENERGY STAR specification for lamps
(http://www.energystar.gov/sites/default/files/ENERGY%20STAR%20Lamps%20V1%201_Specification.pdf) and the Energy
Policy and Conservation Act of 2012.
447
Weightings based on review of CREED LightTracker data and DOE, 2019 ‘Energy Savings Forecast of Solid-State Lighting in
General Illumination Applications’. See ‘Lighting Forecast Workbook.xls’.
448
Watts
EE
defaults are based upon the ENERGY STAR minimum luminous efficacy for the mid-point of the lumen range. See
calculations in file “2017 Lighting Updates and Baseline Estimates”.
Filed with the Iowa Utilities Board on September 23, 2020, EEP-2018-0002
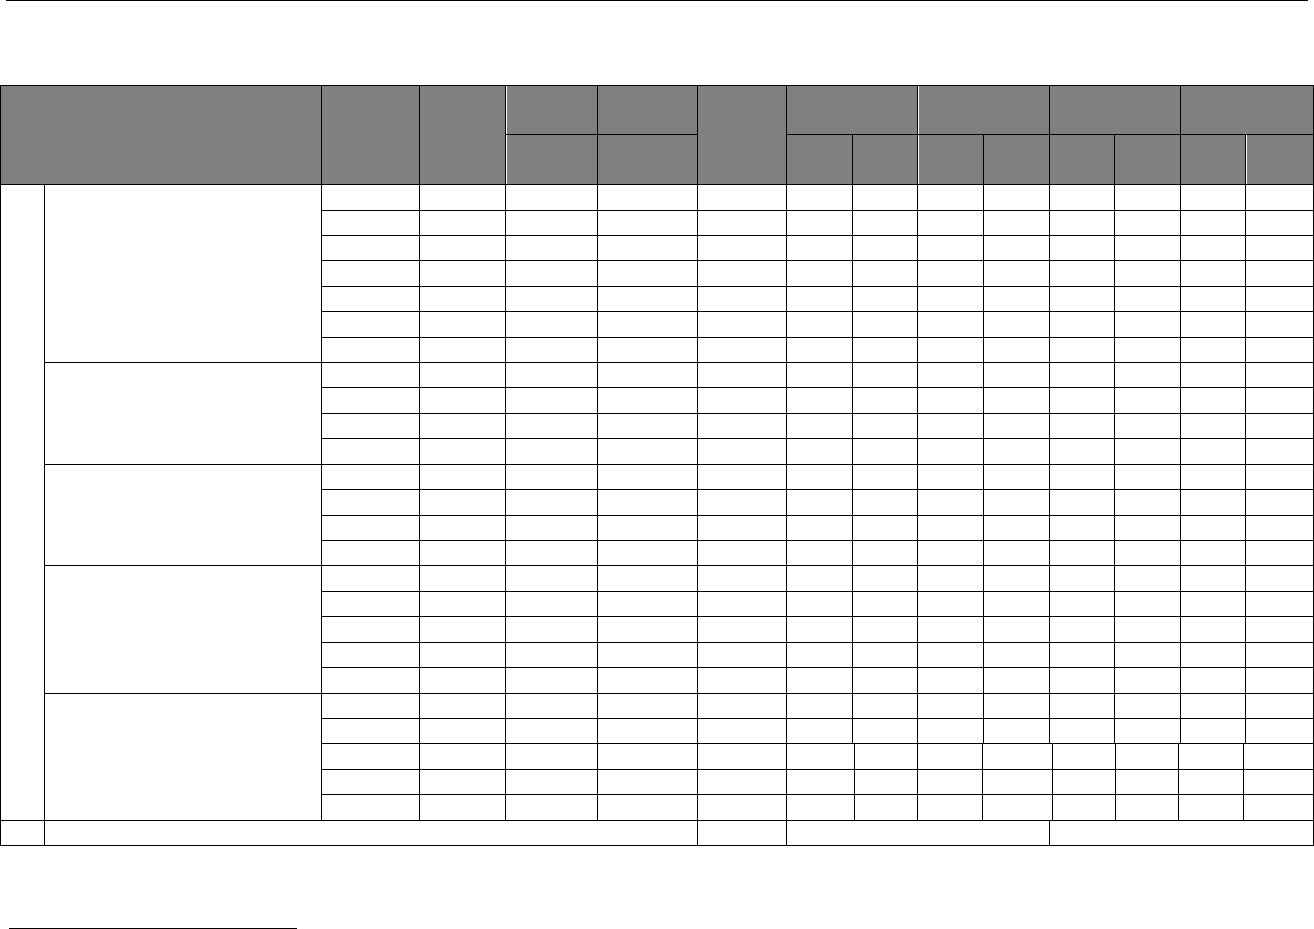
Iowa Energy Efficiency Statewide Technical Reference Manual –3.4.4 LED Lamp Specialty
Vol.3 Nonresidential Measures July 22, 2020 FINAL Page 207 of 410
EISA exempt bulb types:
Bulb Type
Lower
Lumen
Range
Upper
Lumen
Range
Inc/Hal
Watts
EE
Watts
Ba
se
WattsEff
ESTAR
WattsEff CEE
T2
DeltaWatts
ESTAR
DeltaWatts
CEE T2
46%
54%
CRI
<90
CRI
>=90
CRI
<90
CRI
>=90
CRI
<90*
CRI
>=90
CRI
<90
CRI
>=90
EISA E
xempt
3-Way
449
250
449
25
5.0
14.2
4.4
5.0
3.7
4.4
9.8
9.2
10.5
9.8
450
799
40
8.9
23.2
7.8
8.9
6.6
7.8
15.4
14.3
16.7
15.4
800
1,099
60
13.6
35.0
11.9
13.6
10.0
11.9
23.1
21.4
25.0
23.1
1,100
1,599
75
19.3
45.0
16.9
19.3
14.2
16.9
28.1
25.7
30.8
28.1
1,600
1,999
100
25.7
60.0
22.5
25.7
18.9
22.5
37.5
34.2
41.0
37.5
2,000
2,549
125
32.5
75.1
28.4
32.5
23.9
28.4
46.7
42.6
51.2
46.7
2,550
2,999
150
39.6
90.5
34.7
39.6
29.2
34.7
55.8
50.9
61.3
55.8
Globe
(medium and intermediate
base < 750 lumens)
90
179
10
2.4
5.9
2.1
2.1
1.4
1.7
3.9
3.9
4.5
4.2
180
249
15
3.9
9.0
3.3
3.3
2.3
2.7
5.7
5.7
6.8
6.3
250
349
25
5.4
14.5
4.6
4.6
3.2
3.7
9.9
9.9
11.3
10.7
350
749
40
10.0
23.8
8.5
8.5
5.8
6.9
15.4
15.4
18.0
17.0
Decorative
(Shapes B, BA, C, CA, DC, F, G,
medium and intermediate
bases less than 750 lumens)
70
89
10
1.4
5.4
1.2
1.2
0.8
1.0
4.2
4.2
4.6
4.4
90
149
15
2.2
8.1
1.8
1.8
1.3
1.5
6.2
6.2
6.8
6.6
150
299
25
4.1
13.7
3.5
3.5
2.4
2.8
10.3
10.3
11.4
10.9
300
749
40
9.5
23.6
8.1
8.1
5.5
6.6
15.5
15.5
18.1
17.0
Globe
(candelabra bases less than
1050 lumens)
90
179
10
2.4
5.9
2.1
2.1
1.4
1.7
3.9
3.9
4.5
4.2
180
249
15
3.9
9.0
3.3
3.3
2.3
2.7
5.7
5.7
6.8
6.3
250
349
25
5.4
14.5
4.6
4.6
3.2
3.7
9.9
9.9
11.3
10.7
350
499
40
7.7
22.6
6.5
6.5
4.5
5.3
16.1
16.1
18.1
17.3
500
1,049
60
14.1
35.2
11.9
11.9
8.2
9.7
23.3
23.3
27.1
25.6
Decorative
(Shapes B, BA, C, CA, DC, F, G,
candelabra bases less than -
1050 lumens)
70
89
10
1.4
5.4
1.2
1.2
0.8
1.0
4.2
4.2
4.6
4.4
90
149
15
2.2
8.1
1.8
1.8
1.3
1.5
6.2
6.2
6.8
6.6
150
299
25
4.1
13.7
3.5
3.5
2.4
2.8
10.3
10.3
11.4
10.9
300
499
40
7.3
22.4
6.1
6.1
4.2
5.0
16.2
16.2
18.1
17.4
500
1,049
60
14.1
35.2
11.9
11.9
8.2
9.7
23.3
23.3
27.1
25.6
Weighted Average, if unknown
450
27.9
9.4
18.5
*If lumen range is known but Efficiency rating or CRI is unknown assume ESTAR and CRI<90.
449
For 3-way bulbs or fixtures, the product’s median lumens value will be used to determine both LED and baseline wattages.
450
Weighted average is based on 2018 and 2019 data provided by MidAmerican and Alliant. Assumes ENERGY STAR CRI<90 for the efficient wattage.
Filed with the Iowa Utilities Board on September 23, 2020, EEP-2018-0002

Iowa Energy Efficiency Statewide Technical Reference Manual –3.4.4 LED Lamp Specialty
Vol.3 Nonresidential Measures July 22, 2020 FINAL Page 208 of 410
Directional Lamps - For Directional R, BR, and ER lamp types:
451
Bulb Type
Lower
Lumen
Range
Upper
Lumen
Range
Inc/Halogen
Watts
EE
LED
Watts
Base
WattsEff
ESTAR
WattsEff
CEE T2
DeltaWatts
ESTAR
DeltaWatts
CEE T2
15%
85%
CRI
<90
CRI
>=90
CRI
<90
CRI
>=90
CRI <90*
CRI >=90
CRI <90
CRI >=90
Directional
R, ER, BR with
medium screw
bases w/
diameter
>2.25" (*see
exceptions
below)
420
472
40
7.4
12.4
6.4
7.3
5.2
6.4
6.1
5.1
7.2
6.1
473
524
45
8.3
13.9
7.1
8.2
5.9
7.1
6.8
5.8
8.1
6.8
525
714
50
10.3
16.4
8.9
10.2
7.3
8.9
7.6
6.3
9.1
7.6
715
937
65
13.8
21.6
11.8
13.5
9.7
11.8
9.8
8.1
11.9
9.8
938
1,259
75
18.3
27.0
15.7
18.0
12.9
15.7
11.3
9.0
14.1
11.3
1,260
1,399
90
22.2
32.6
19.0
21.8
15.6
19.0
13.6
10.8
16.9
13.6
1,400
1,739
100
26.2
37.5
22.4
25.7
18.5
22.4
15.1
11.8
19.0
15.1
1,740
2,174
120
32.6
46.0
28.0
32.1
23.0
28.0
18.1
13.9
23.0
18.1
2,175
2,624
150
40.0
56.9
34.3
39.3
28.2
34.3
22.6
17.5
28.6
22.6
2,625
2,999
175
46.9
66.5
40.2
46.1
33.1
40.2
26.4
20.4
33.4
26.4
3,000
4,500
200
62.5
83.6
53.6
61.5
44.1
53.6
30.0
22.1
39.5
30.0
*R, BR, and ER
with medium
screw bases
w/ diameter
≤2.25"
400
449
40
7.1
12.1
6.1
7.0
5.0
6.1
6.1
5.2
7.1
6.1
450
499
45
7.9
13.6
6.8
7.8
5.6
6.8
6.8
5.8
8.0
6.8
500
649
50
9.6
15.8
8.2
9.4
6.8
8.2
7.6
6.4
9.0
7.6
650
1,199
65
15.4
23.0
13.2
15.2
10.9
13.2
9.8
7.9
12.1
9.8
*ER30, BR30,
BR40, or ER40
400
449
40
7.1
12.1
6.1
7.0
5.0
6.1
6.1
5.2
7.1
6.1
450
499
45
7.9
13.6
6.8
7.8
5.6
6.8
6.8
5.8
8.0
6.8
500
649
50
9.6
15.8
8.2
9.4
6.8
8.2
7.6
6.4
9.0
7.6
*BR30, BR40,
or ER40
650
1,419
65
17.2
24.6
14.8
17.0
12.2
14.8
9.8
7.6
12.4
9.8
*R20
400
449
40
7.1
12.1
6.1
7.0
5.0
6.1
6.1
5.2
7.1
6.1
450
719
45
9.7
15.2
8.4
9.6
6.9
8.4
6.8
5.6
8.3
6.8
*All reflector
lamps below
lumen ranges
specified
above
200
299
20
4.2
12.4
3.6
4.1
2.9
3.6
3.0
2.5
3.7
3.0
300
399
30
5.8
13.9
5.0
5.7
4.1
5.0
4.5
3.8
5.4
4.5
Weighted Average, if unknown
452
21.4
12.2
9.3
451
From pg. 13 of the Energy Star Specification for lamps v2.1.
452
Weighted average is based on 2018 and 2019 data provided by MidAmerican and Alliant. Assumes ENERGY STAR CRI<90 for the efficient wattage.
Filed with the Iowa Utilities Board on September 23, 2020, EEP-2018-0002

Iowa Energy Efficiency Statewide Technical Reference Manual –3.4.4 LED Lamp Specialty
Vol.3 Nonresidential Measures July 22, 2020 FINAL Page 209 of 410
*If lumen range is known but Efficiency rating or CRI is unknown assume ESTAR and CRI<90. Directional lamps are exempt from first phase of
EISA regulations.
EISA non-exempt bulb types:
Bulb Type
Lower
Lumen
Range
Upper
Lumen
Range
Inc/ Hal
Watts
EE
LED
Watt
s
Base
WattsEff
ESTAR
WattsEff
CEE T2
DeltaWatts
ESTAR
DeltaWatts
CEE T2
53%
47%
CRI
<90
CRI
>=90
CRI
<90
CRI
>=90
CRI
<90*
CRI
>=90
CRI
<90
CRI >=90
EISA Non
-Exempt
Dimmable Twist, Globe (<5" in
diameter and > 749 lumens),
candle (shapes B, BA, CA > 749
lumens), Candelabra Base
Lamps (>1049 lumens),
Intermediate Base Lamps (>749
lumens)
250
309
25
5.1
15.7
3.5
4.0
2.9
3.5
12.2
11.7
12.8
12.2
310
749
29
9.6
20.0
6.6
7.6
5.6
6.6
13.3
12.4
14.4
13.3
750
1049
43
16.4
30.6
11.2
12.9
9.5
11.2
19.3
17.7
21.1
19.3
1050
1489
53
23.1
39.0
15.9
18.1
13.4
15.9
23.2
20.9
25.7
23.2
1490
2600
72
37.2
55.7
25.6
29.2
21.5
25.6
30.2
26.5
34.2
30.2
Weighted Average, if unknown
453
30.7
12.4
18.2
*If lumen range is known but Efficiency rating or CRI is unknown assume ESTAR and CRI<90.
453
Weighted average is based on 2018 and 2019 data provided by MidAmerican and Alliant. Assumes ENERGY STAR CRI<90 for the efficient wattage.
Filed with the Iowa Utilities Board on September 23, 2020, EEP-2018-0002

Iowa Energy Efficiency Statewide Technical Reference Manual –3.4.4 LED Lamp Specialty
Vol.3 Nonresidential Measures July 22, 2020 FINAL Page 210 of 410
Hours = Average hours of use per year as provided by the customer or selected from the Lighting
Reference Table in Section 3.4. If hours or building type are unknown, use the
Nonresidential Average value.
WHFe
= Waste heat factor for energy to account for cooling energy savings from efficient lighting
is selected from the Lighting Reference Table in Section 3.4. for each building type. If
unknown, use the Nonresidential Average value.
ISR = In Service Rate or the percentage of units rebated that get installed.
=100% if application form completed with sign off that equipment is not placed into
storage. If sign off form not completed, assume the following:
Program
Discounted
In Service Rate (ISR)
454
Retail (Time of Sale)
455
89%
Direct Install
456
and Retrofit
97%
Heating Penalty:
If electrically heated building:
457
Where:
IFkWh = Lighting-HVAC Interation Factor for electric heating impacts; this factor represents the
increased electric space heating requirements due to the reduction of waste heat rejected
by the efficent lighting. Values are provided in the Lighting Reference Table in Section 3.4.
If unknown, use the Nonresidential Average value.
Mid-Life Baseline Adjustment
During the lifetime of an LED, the baseline incandescent/halogen bulb would need to be replaced multiple times.
The market share of LED will continue to grow over the lifetime of the measure, and since baseline halogens would
need to be replaced multiple times within the life of the measure, a single mid-life adjustment is calculated that
results in an equivalent net present value of lifetime savings as the forecast decline in annual savings. See ‘Lighting
Forecast Workbook_2020.xls’ for details.
The calculated mid-life adjustments for 2021 are provided below for each fixture type:
Lamp Category
Efficiency Level
Year on adjustment
is applied
Adjustment
Decorative and Globe lamps
ENERGY STAR
5
57%
CEE Tier 2
5
63%
Directional lamps
ENERGY STAR
5
62%
CEE Tier 2
5
69%
454
All Programs except for Direct Install assume that some lamps are not installed in the first year but are later installed in years
2 and 3. To ease implementation, these future installs are discounted using the statewide real discount rate (7.71%). The
second and third year installations rates are from NREL, “Chapter 6: Residential Lighting Evaluation Protocol of the Uniform
Methods Project,” October 2017. See “Non-Res Lighting ISR calculation_2018.xlsx” for more information.
455
The 1
st
year in service rate for Retail LEDs is a weighted average based on PY7 and PY9 evaluations from ComEd’s, Illinois
commercial lighting program (BILD) and PY9 data from Ameren Illinois Instant Incentives program.
456
Consistent with CFL assumption. Based upon review of the Illinois PY2 and PY3 ComEd Direct Install program surveys;
http://www.ilsag.info/evaluation-documents.html
457
Results in a negative value because this is an increase in heating consumption due to the efficient lighting.
Filed with the Iowa Utilities Board on September 23, 2020, EEP-2018-0002

Iowa Energy Efficiency Statewide Technical Reference Manual –3.4.4 LED Lamp Specialty
Vol.3 Nonresidential Measures July 22, 2020 FINAL Page 211 of 410
SUMMER COINCIDENT PEAK DEMAND SAVINGS
Where:
WHFd = Waste Heat Factor for Demand to account for cooling savings from efficient lighting in
cooled buildings is provided in the Lighting Reference Table in Section 3.4. If unknown,
use the Nonresidential Average value.
CF = Summer Peak Coincidence Factor for measure is provided in the Lighting Reference
Table in Section 3.4. If unknown, use the Nonresidential Average value.
NATURAL GAS ENERGY SAVINGS
Heating Penalty if fossil fuel heated building (or if heating fuel is unknown):
458
Where:
IFTherms = Lighting-HVAC Integration Factor for gas heating impacts; this factor represents the
increased gas space heating requirements due to the reduction of waste heat rejected by
the efficient lighting. Values are provided in the Lighting Reference Table in Section 3.4.
If unknown, use the Nonresidential Average value.
PEAK GAS SAVINGS
For ease of application, savings for this measure are assumed to be evenly spread across the year. The Peak Gas
Savings is therefore assumed to be:
Where:
ΔTherms = Therm impact calculated above
HeatDays = Heat season days per year
= 197
459
WATER IMPACT DESCRIPTIONS AND CALCULATION
N/A
DEEMED O&M COST ADJUSTMENT CALCULATION
In order to account for the shift in baseline due to the natural growth of LED over the lifetime of the measure, an
annual levelized baseline replacement cost over the lifetime of the LED bulb is calculated. Bulb replacement costs
assumed in the O&M calculations are provided below.
460
458
Results in a negative value because this is an increase in heating consumption due to the efficient lighting.
459
Number of days where HDD 55 >0.
460
Lamp costs are based upon WECC review of bulbs purchased through the Alliant program January – April 2017 and
equivalent baseline bulbs.
Filed with the Iowa Utilities Board on September 23, 2020, EEP-2018-0002

Iowa Energy Efficiency Statewide Technical Reference Manual –3.4.4 LED Lamp Specialty
Vol.3 Nonresidential Measures July 22, 2020 FINAL Page 212 of 410
Lamp
Type
CRI
Product
Type
Cost
Directional
<90
Inc/Hal
$5.00
LED
$7.80
>=90
Inc/Hal
$5.00
LED
$7.63
Decorative
<90
Inc/Hal
$3.00
LED
$7.50
>=90
Inc/Hal
$3.00
LED
$8.69
The present value of replacement lamps and annual levelized replacement costs using the statewide real discount
rate of 7.20% are presented below:
461
PV of replacement
costs for period
Levelized annual
replacement cost
savings
Lamp Type
CRI
Location
2021 Installs
2021 Installs
Directional
<90
Nonresidential
average
$13.92
$2.00
>=90
Nonresidential
average
$13.91
$2.00
Decorative
<90
Nonresidential
average
$17.41
$2.50
>=90
Nonresidential
average
$17.56
$2.52
MEASURE CODE: NR-LTG-LEDS-V05-210101
SUNSET DATE: 1/1/2022
461
See “2020 LED Measure Cost and O&M Calc.xlsx” for more information. The values assume the non-residential average
hours assumption of 3065.
Filed with the Iowa Utilities Board on September 23, 2020, EEP-2018-0002

Iowa Energy Efficiency Statewide Technical Reference Manual –3.4.5 LED Fixtures
Vol.3 Nonresidential Measures July 22, 2020 FINAL Page 213 of 410
3.4.5. LED Fixtures
DESCRIPTION
The installation of Light-Emitting Diode (LED) lighting systems have comparable luminosity to incandescent bulbs
and equivalent fluorescent lamps at significantly less wattage, lower heat, and with significantly longer lifetimes.
This measure provides savings assumptions for a variety of efficient lighting fixtures including internal and external
LED fixtures, recess (troffer), canopy, and pole fixtures, as well as refrigerator and display case lighting.
This measure was developed to be applicable to the following program types: TOS, RF.
If applied to other program types, the measure savings should be verified.
DEFINITION OF EFFICIENT EQUIPMENT
In order for this characterization to apply, all LED fixtures must fall within the lumen ranges listed in the tables and
be ENERGY STAR labeled or on the Design Light Consortium qualifying product list.
462
All LED fixtures that fall outside
the lumen ranges listed in the tables would have to be processed custom. Delamping projects, i.e., those achieving
an overall decrease in luminosity, MUST NOT use default, tabulated baseline power assumptions, since default
values assume luminosity is maintained. For such projects, actual baseline power must be used in savings
calculations.
DEFINITION OF BASELINE EQUIPMENT
For TOS and RF installations, the baselines efficiency case is project specific and is determined using actual fixture
types and counts from the existing space. The existing fluorescent fixture end connectors and ballasts must be
completely removed to qualify.
Where the installation technology is not known, the assumed baselines condition for an outdoor pole/arm, wall-
mounted, garage/canopy fixture and high-bay luminaire with a high intensity discharge light source is a metal halide
fixture. Deemed fixture wattages are provided in reference tables at the end of this characterization.
DEEMED LIFETIME OF EFFICIENT EQUIPMENT
The estimated measure life of LED Fixtures is 13 years.
463
DEEMED MEASURE COST
Actual incremental costs should be used if available. For default values, refer to the reference tables below.
LOADSHAPE
Loadshape NREL01:16 – Nonresidential Lighting (by Building Type)
Algorithm
CALCULATION OF SAVINGS
ELECTRIC ENERGY SAVINGS
Where:
462
DesignLights Consortium Qualified Products List http://www.designlights.org/qpl
463
GDS Associates, Inc. (2007). Measure Life Report: Residential and Commercial/Industrial Lighting and HVAC Measures.
Filed with the Iowa Utilities Board on September 23, 2020, EEP-2018-0002

Iowa Energy Efficiency Statewide Technical Reference Manual –3.4.5 LED Fixtures
Vol.3 Nonresidential Measures July 22, 2020 FINAL Page 214 of 410
Watts
Base
= Input wattage of the existing or baseline system. Reference the “LED New and Baseline
Assumptions” table for default values when baseline is unknown.
Watts
EE
= Actual wattage of LED fixture purchased / installed. If unknown, use default provided in
“LED New and Baseline Assumptions”.
Hours = Average annual lighting hours of use as provided by the customer or selected from the
Lighting Reference Table in Section 3.4. by building type. If hours or building type are
unknown, use the Nonresidential Average value.
WHFe = Waste heat factor for energy to account for cooling energy savings from efficient lighting
is selected from the Lighting Reference Table in Section 3.4 for each building type. If
building is un-cooled, the value is 1.0.
ISR = In Service Rate is assumed to be 95% for Time of Sale and 100% for Retrofit.
464
Heating Penalty:
If electrically heated building:
Where:
IFkWh = Lighting-HVAC Interation Factor for electric heating impacts;
465
this factor represents
the increased electric space heating requirements due to the reduction of waste heat
rejected by the efficent lighting. Values are provided in the Lighting Reference Table in
Section 3.4. If unknown, use the Nonresidential Average value.
Mid-life Adjustment:
A mid-life savings adjustment should be applied to any measure with a blended Standard T8 : T12 baseline. The
adjustment should occur in 2022 to account for the baseline lamp replacement assumption changing from a blended
82/18 Standard T8/T12
466
to 100% Standard T8 by 2022.
467
The savings adjustment is calculated as follows, and is
provided in the Reference Table section:
Where:
WattsT8Base = Input wattage of the existing system based on 100% T8 fixture; see reference
table below.
WattsBlendedT8/T12 = Input wattage of the existing system based on 82% T8 / 18% T12; see reference
table below.
SUMMER COINCIDENT PEAK DEMAND SAVINGS
464
Negotiated value during Iowa TRM Technical Advisory Committee call, 08/25/2015.
465
Negative value because this is an increase in heating consumption due to the efficient lighting.
466
Blend of T8 to T12 is based upon Dunsky and Opinion Dynamics Baseline Study results, 2017.
467
As of July 1, 2010, a Federal mandate states that the magnetic ballasts used in many T12 fixtures can no longer be produced
for commercial and industrial applications. However there have been many loopholes that have meant T12 lamps continue to
hold a significant market share. It is expected that new mandates will close the loophole, although the timing of such updates is
unknown. T12 lamps have an average life of 20,000 hours and if we assume they are operated on average for 4500 hours
annually, this would mean a lamp would have to be replaced every 4.5 years. We therefore assume that by 2024 all
replacement lamps are Standard T8s. Therefore while the more likely scenario would be a gradual shift of the 82/18 weighted
baseline to T8s over the timeframe, to simplify this assumption, a single mid-life adjustment in 2022 is assumed.
Filed with the Iowa Utilities Board on September 23, 2020, EEP-2018-0002

Iowa Energy Efficiency Statewide Technical Reference Manual –3.4.5 LED Fixtures
Vol.3 Nonresidential Measures July 22, 2020 FINAL Page 215 of 410
Where:
WHFd = Waste Heat Factor for Demand to account for cooling savings from efficient lighting in
cooled buildings is selected from the Lighting Reference Table in Section 3.4. for each
building type. If the building is not cooled, WHFd is 1.
CF = Summer Peak Coincidence Factor for measure is selected from the Lighting Reference
Table in Section 3.4. for each building type. If the building type is unknown, use the
Nonresidential Average value.
NATURAL GAS ENERGY SAVINGS
Heating Penalty if fossil fuel heated building (or if heating fuel is unknown):
Where:
IFTherms = Lighting-HVAC Integration Factor for gas heating impacts;
468
this factor represents the
increased gas space heating requirements due to the reduction of waste heat rejected by
the efficient lighting. Values are provided in the Lighting Reference Table in Section 3.4.
If unknown, use the Nonresidential Average value.
PEAK GAS SAVINGS
For ease of application, savings for this measure is assumed to be evenly spread across the year. The Peak Gas Savings
is therefore assumed to be:
Where:
ΔTherms = Therm impact calculated above
HeatDays = Heat season days per year
= 197
469
WATER IMPACT DESCRIPTIONS AND CALCULATION
N/A
DEEMED O&M COST ADJUSTMENT CALCULATION
See Reference Tables below for default assumptions.
REFERENCE TABLES
470
468
Negative value because this is an increase in heating consumption due to the efficient lighting.
469
Number of days where HDD 55 >0.
470
Watt, lumen, and costs data assumptions for efficient measures are based upon Design Light Consortium Qualifying Product
Lists alongside past Efficiency Vermont projects and PGE refrigerated case study. Watt, lumen, lamp life, and ballast factor
assumptions for baseline fixtures are based upon manufacturer specification sheets. Baseline cost data comes from lighting
Filed with the Iowa Utilities Board on September 23, 2020, EEP-2018-0002

Iowa Energy Efficiency Statewide Technical Reference Manual –3.4.5 LED Fixtures
Vol.3 Nonresidential Measures July 22, 2020 FINAL Page 216 of 410
LED
Category
EE Measure
Baseline
Incremental
Cost
Mid-life
Savings
Adjustment
(2022)
Description
Watts
EE
Description
Watts
BASE
Base
Cost
LED
Downlight
Fixtures
LED Recessed, Surface,
Pendant Downlights
17.6
40% CFL 26W Pin Based &
60% PAR30/38
54.3
$15
$27
N/A
LED
Interior
Directional
LED Track Lighting
12.2
10% CMH PAR38 & 90%
Halogen PAR38
60.4
$25
$59
N/A
LED Wall-Wash Fixtures
8.3
40% CFL 42W Pin Base &
60% Halogen PAR38
17.7
$25
$59
N/A
LED Display
Case
LED Display Case Light
Fixture
7.1 / ft
50% 2’T5 Linear & 50% 50W
Halogen
36.2 / ft
$10/ft
$11/ft
N/A
LED Undercabinet Shelf-
Mounted Task Light
Fixtures
7.1 / ft
50% 2’T5 Linear & 50% 50W
Halogen
36.2 / ft
$10/ft
$11/ft
N/A
LED Refrigerated Case
Light, Horizontal or Vertical
7.6 / ft
5’T8
15.2 / ft
$10/ft
$11/ft
N/A
LED Freezer Case Light,
Horizontal or Vertical
7.7 / ft
6’T12HO
18.7 / ft
$10/ft
$11/ft
N/A
LED Linear
Replaceme
nt Lamps
T8 LED Replacement Lamp
(TLED), < 1200 lumens
8.9
F17T8 Standard Lamp - 2
foot
15.0
$5.00
$12.75
N/A
T8 LED Replacement Lamp
(TLED), 1200-2400 lumens
15.8
F32T8 Standard Lamp - 4
foot
28.2
$3.00
$15
N/A
T8 LED Replacement Lamp
(TLED), 2401-4000 lumens
22.9
F32T8/HO Standard Lamp - 4
foot
42
$11.00
$13.25
N/A
LED
Troffers
LED 2x2 Recessed Light
Fixture, 2000-3500 lumens
25.4
18:82; 2-Lamp 34w T12 (BF <
0.85) :2-Lamp 32w T8 (BF <
0.89)
57.9
$50
$53
97%
LED 2x2 Recessed Light
Fixture, 3501-5000 lumens
36.7
18:82; 3-Lamp 34w T12 (BF
<0.88) :3-Lamp 32w T8 (BF <
0.88)
88.7
$55
$69
92%
LED 2x4 Recessed Light
Fixture, 3000-4500 lumens
33.3
18:82; 2-Lamp 34w T12 (BF <
0.85) :2-Lamp 32w T8 (BF <
0.89)
57.9
$50
$55
96%
LED 2x4 Recessed Light
Fixture, 4501-6000 lumens
44.8
18:82; 3-Lamp 34w T12 (BF
<0.88) :3-Lamp 32w T8 (BF <
0.88)
88.7
$55
$76
90%
LED 2x4 Recessed Light
Fixture, 6001-7500 lumens
57.2
18:82;4-Lamp 34w T12 (BF <
0.88): 4-Lamp 32w T8 (BF <
0.88)
118.3
$60
$104
91%
LED 1x4 Recessed Light
Fixture, 1500-3000 lumens
21.8
18:82; 1-Lamp 34w T12 (BF
<0.88) : 1-Lamp 32w T8 (BF
<0.91)
29.5
$50
$22
96%
LED 1x4 Recessed Light
Fixture, 3001-4500 lumens
33.7
18:82; 2-Lamp 34w T12 (BF <
0.85) :2-Lamp 32w T8 (BF <
0.89)
57.9
$55
$75
96%
LED 1x4 Recessed Light
Fixture, 4501-6000 lumens
43.3
18:82; 3-Lamp 34w T12 (BF
<0.88) :3-Lamp 32w T8 (BF <
88.7
$60
$83
91%
suppliers, past Efficiency Vermont projects, and professional judgment. See “LED Lighting Systems TRM Reference Tables 2017
Iowa.xlsx" for more information and specific product links.
Filed with the Iowa Utilities Board on September 23, 2020, EEP-2018-0002

Iowa Energy Efficiency Statewide Technical Reference Manual –3.4.5 LED Fixtures
Vol.3 Nonresidential Measures July 22, 2020 FINAL Page 217 of 410
LED
Category
EE Measure
Baseline
Incremental
Cost
Mid-life
Savings
Adjustment
(2022)
Description
Watts
EE
Description
Watts
BASE
Base
Cost
0.88)
LED Linear
Ambient
Fixtures
LED Surface & Suspended
Linear Fixture, ≤ 3000
lumens
19.5
18:82; 1-Lamp 34w T12 (BF
<0.88) : 1-Lamp 32w T8 (BF
<0.91)
29.5
$50
$10
97%
LED Surface & Suspended
Linear Fixture, 3001-4500
lumens
32.1
18:82; 2-Lamp 34w T12 (BF <
0.85) :2-Lamp 32w T8 (BF <
0.89)
57.9
$55
$52
96%
LED Surface & Suspended
Linear Fixture, 4501-6000
lumens
43.5
18:82; 3-Lamp 34w T12 (BF
<0.88) :3-Lamp 32w T8 (BF <
0.88)
88.7
$60
$78
91%
LED Surface & Suspended
Linear Fixture, 6001-7500
lumens
56.3
T5HO 2L-F54T5HO - 4'
120.0
$65
$131
N/A
LED Surface & Suspended
Linear Fixture, >7500
lumens
82.8
T5HO 3L-F54T5HO - 4'
180.0
$70
$173
N/A
LED High &
Low Bay
Fixtures
LED Low-Bay or High-Bay
Fixtures, ≤ 10,000 lumens
61.6
3-Lamp T8HO Low-Bay
157.0
$75
$44
N/A
LED High-Bay Fixtures,
10,001-15,000 lumens
99.5
4-Lamp T8HO High-Bay
196.0
$100
$137
N/A
LED High-Bay Fixtures,
15,001-20,000 lumens
140.2
6-Lamp T8HO High-Bay
294.0
$125
$202
N/A
LED High-Bay Fixtures, >
20,000 lumens
193.8
8-Lamp T8HO High-Bay
392.0
$150
$264
N/A
LED
Agricultural
Interior
Fixtures
LED Ag Interior Fixtures, ≤
2,000 lumens
12.9
25% 73 Watt EISA Inc, 75%
1L T8
42.0
$20
$18
N/A
LED Ag Interior Fixtures,
2,001-4,000 lumens
29.7
25% 146 Watt EISA Inc, 75%
2L T8
81.0
$40
$48
N/A
LED Ag Interior Fixtures,
4,001-6,000 lumens
45.1
25% 217 Watt EISA Inc, 75%
3L T8
121.0
$60
$57
N/A
LED Ag Interior Fixtures,
6,001-8,000 lumens
59.7
25% 292 Watt EISA Inc, 75%
4L T8
159.0
$80
$88
N/A
LED Ag Interior Fixtures,
8,001-12,000 lumens
84.9
200W Pulse Start Metal
Halide
227.3
$120
$168
N/A
LED Ag Interior Fixtures,
12,001-16,000 lumens
113.9
320W Pulse Start Metal
Halide
363.6
$160
$151
N/A
LED Ag Interior Fixtures,
16,001-20,000 lumens
143.7
350W Pulse Start Metal
Halide
397.7
$200
$205
N/A
LED Ag Interior Fixtures, >
20,000 lumens
193.8
(2) 320W Pulse Start Metal
Halide
727.3
$240
$356
N/A
LED
Exterior
Fixtures
LED Exterior Fixtures, ≤
5,000 lumens
34.1
100W Metal Halide
113.6
$60
$80
N/A
LED Exterior Fixtures,
5,001-10,000 lumens
67.2
175W Pulse Start Metal
Halide
198.9
$90
$248
N/A
LED Exterior Fixtures,
10,001-15,000 lumens
108.8
250W Pulse Start Metal
Halide
284.1
$120
$566
N/A
LED Exterior Fixtures,
>15,000 lumens
183.9
400W Pulse Start Metal
Halide
454.5
$150
$946
N/A
Filed with the Iowa Utilities Board on September 23, 2020, EEP-2018-0002

Iowa Energy Efficiency Statewide Technical Reference Manual –3.4.5 LED Fixtures
Vol.3 Nonresidential Measures July 22, 2020 FINAL Page 218 of 410
EE Measure
Baseline
LED Category
EE Measure Description
Lamp
Life
(hrs)
Total
Lamp
Replace
Cost
LED
Driver
Life
(hrs)
Total LED
Driver
Replace
Cost
Lamp
Life
(hrs)
Total
Lamp
Replace
Cost
Ballast
Life
(hrs)
Total
Ballast
Replace
Cost
LED
Downlight
Fixtures
LED Recessed, Surface,
Pendant Downlights
50,000
$30.75
70,000
$47.50
2,500
$8.86
40,000
$14.40
LED Interior
Directional
LED Track Lighting
50,000
$39.00
70,000
$47.50
2,500
$12.71
40,000
$11.00
LED Wall-Wash Fixtures
50,000
$39.00
70,000
$47.50
2,500
$9.17
40,000
$27.00
LED Display
Case
LED Display Case Light
Fixture
50,000
$9.75/ft
70,000
$11.88/ft
2,500
$6.70
40,000
$5.63
LED Undercabinet Shelf-
Mounted Task Light
Fixtures
50,000
$9.75/ft
70,000
$11.88/ft
2,500
$6.70
40,000
$5.63
LED Refrigerated Case
Light, Horizontal or
Vertical
50,000
$8.63/ft
70,000
$9.50/ft
15,000
$1.13
40,000
$8.00
LED Freezer Case Light,
Horizontal or Vertical
50,000
$7.88/ft
70,000
$7.92/ft
12,000
$0.94
40,000
$6.67
LED Linear
Replacement
Lamps
T8 LED Replacement
Lamp (TLED), < 1200
lumens
50,000
$8.57
70,000
$13.67
24,000
$6.17
40,000
$11.96
T8 LED Replacement
Lamp (TLED), 1200-2400
lumens
50,000
$8.57
70,000
$13.67
24,000
$6.17
40,000
$11.96
T8 LED Replacement
Lamp (TLED), 2401-4000
lumens
50,000
$5.76
70,000
$13.67
24,000
$6.17
40,000
$11.96
LED Troffers
LED 2x2 Recessed Light
Fixture, 2000-3500
lumens
50,000
$78.07
70,000
$40.00
24,000
$26.33
40,000
$35.00
LED 2x2 Recessed Light
Fixture, 3501-5000
lumens
50,000
$89.23
70,000
$40.00
24,000
$39.50
40,000
$35.00
LED 2x4 Recessed Light
Fixture, 3000-4500
lumens
50,000
$96.10
70,000
$40.00
24,000
$12.33
40,000
$35.00
LED 2x4 Recessed Light
Fixture, 4501-6000
lumens
50,000
$114.37
70,000
$40.00
24,000
$18.50
40,000
$35.00
LED 2x4 Recessed Light
Fixture, 6001-7500
lumens
50,000
$137.43
70,000
$40.00
24,000
$24.67
40,000
$35.00
LED 1x4 Recessed Light
Fixture, 1500-3000
lumens
50,000
$65.43
70,000
$40.00
24,000
$6.17
40,000
$35.00
LED 1x4 Recessed Light
Fixture, 3001-4500
lumens
50,000
$100.44
70,000
$40.00
24,000
$12.33
40,000
$35.00
Filed with the Iowa Utilities Board on September 23, 2020, EEP-2018-0002

Iowa Energy Efficiency Statewide Technical Reference Manual –3.4.5 LED Fixtures
Vol.3 Nonresidential Measures July 22, 2020 FINAL Page 219 of 410
EE Measure
Baseline
LED Category
EE Measure Description
Lamp
Life
(hrs)
Total
Lamp
Replace
Cost
LED
Driver
Life
(hrs)
Total LED
Driver
Replace
Cost
Lamp
Life
(hrs)
Total
Lamp
Replace
Cost
Ballast
Life
(hrs)
Total
Ballast
Replace
Cost
LED 1x4 Recessed Light
Fixture, 4501-6000
lumens
50,000
$108.28
70,000
$40.00
24,000
$18.50
40,000
$35.00
LED Linear
Ambient
Fixtures
LED Surface & Suspended
Linear Fixture, ≤ 3000
lumens
50,000
$62.21
70,000
$40.00
24,000
$6.17
40,000
$35.00
LED Surface & Suspended
Linear Fixture, 3001-4500
lumens
50,000
$93.22
70,000
$40.00
24,000
$12.33
40,000
$35.00
LED Surface & Suspended
Linear Fixture, 4501-6000
lumens
50,000
$114.06
70,000
$40.00
24,000
$18.50
40,000
$35.00
LED Surface & Suspended
Linear Fixture, 6001-7500
lumens
50,000
$152.32
70,000
$40.00
30,000
$26.33
40,000
$60.00
LED Surface & Suspended
Linear Fixture, >7500
lumens
50,000
$183.78
70,000
$40.00
30,000
$39.50
40,000
$60.00
LED High &
Low Bay
Fixtures
LED Low-Bay or High-Bay
Fixtures, ≤ 10,000 lumens
50,000
$112.13
70,000
$62.50
18,000
$64.50
40,000
$92.50
LED High-Bay Fixtures,
10,001-15,000 lumens
50,000
$186.93
70,000
$62.50
18,000
$86.00
40,000
$92.50
LED High-Bay Fixtures,
15,001-20,000 lumens
50,000
$243.06
70,000
$62.50
18,000
$129.00
40,000
$117.50
LED High-Bay Fixtures,
>20,000 lumens
50,000
$297.87
70,000
$62.50
18,000
$172.00
40,000
$142.50
LED
Agricultural
Interior
Fixtures
LED Ag Interior Fixtures, ≤
2,000 lumens
50,000
$41.20
70,000
$40.00
1,000
$1.23
40,000
$26.25
LED Ag Interior Fixtures,
2,001-4,000 lumens
50,000
$65.97
70,000
$40.00
1,000
$1.43
40,000
$26.25
LED Ag Interior Fixtures,
4,001-6,000 lumens
50,000
$80.08
70,000
$40.00
1,000
$1.62
40,000
$26.25
LED Ag Interior Fixtures,
6,001-8,000 lumens
50,000
$105.54
70,000
$40.00
1,000
$1.81
40,000
$26.25
LED Ag Interior Fixtures,
8,001-12,000 lumens
50,000
$179.81
70,000
$62.50
15,000
$63.00
40,000
$112.50
LED Ag Interior Fixtures,
12,001-16,000 lumens
50,000
$190.86
70,000
$62.50
15,000
$68.00
40,000
$122.50
LED Ag Interior Fixtures,
16,001-20,000 lumens
50,000
$237.71
70,000
$62.50
15,000
$73.00
40,000
$132.50
LED Ag Interior Fixtures, >
20,000 lumens
50,000
$331.73
70,000
$62.50
15,000
$136.00
40,000
$202.50
LED Exterior
Fixtures
LED Exterior Fixtures, ≤
5,000 lumens
50,000
$73.80
70,000
$62.50
15,000
$58.00
40,000
$102.50
LED Exterior Fixtures,
5,001-10,000 lumens
50,000
$124.89
70,000
$62.50
15,000
$63.00
40,000
$112.50
LED Exterior Fixtures,
50,000
$214.95
70,000
$62.50
15,000
$68.00
40,000
$122.50
Filed with the Iowa Utilities Board on September 23, 2020, EEP-2018-0002

Iowa Energy Efficiency Statewide Technical Reference Manual –3.4.5 LED Fixtures
Vol.3 Nonresidential Measures July 22, 2020 FINAL Page 220 of 410
EE Measure
Baseline
LED Category
EE Measure Description
Lamp
Life
(hrs)
Total
Lamp
Replace
Cost
LED
Driver
Life
(hrs)
Total LED
Driver
Replace
Cost
Lamp
Life
(hrs)
Total
Lamp
Replace
Cost
Ballast
Life
(hrs)
Total
Ballast
Replace
Cost
10,001-15,000 lumens
LED Exterior Fixtures, >
15,000 lumens
50,000
$321.06
70,000
$62.50
15,000
$73.00
40,000
$132.50
MEASURE CODE: NR-LTG-LDFX-V04-200101
SUNSET DATE: 1/1/2022
Filed with the Iowa Utilities Board on September 23, 2020, EEP-2018-0002

Iowa Energy Efficiency Statewide Technical Reference Manual –3.4.6 T5 HO Fixtures and Lamp/Ballast Systems
Vol.3 Nonresidential Measures July 22, 2020 FINAL Page 221 of 410
3.4.6. T5 HO Fixtures and Lamp/Ballast Systems
DESCRIPTION
T5 HO lamp/ballast systems have greater lumens per watt than a typical T8 system. The smaller lamp diameter of
the T5HO also increases optical control efficiency, and allows for more precise control and directional distribution
of lighting. These characteristics make it easier to design light fixtures that can produce equal or greater light than
standard T8 or T12 systems, while using fewer watts. In addition, when lighting designers specify T5 HO
lamps/ballasts, they can use fewer luminaries per project, especially for large commercial projects, thus increasing
energy savings further.
471
The main markets served by T5 HO fixtures and lamps include retrofit in the commercial and nonresidential sector,
specifically industrial, warehouse, and grocery facilities with higher ceiling heights that require maximum light
output.
This measure was developed to be applicable to the following program types: TOS, RF.
If applied to other program types, the measure savings should be verified.
DEFINITION OF EFFICIENT EQUIPMENT
The definition of the efficient equipment is T5 HO high-bay (>15ft mounting height) fixtures with 3, 4, 6, or 8-lamp
configurations.
DEFINITION OF BASELINE EQUIPMENT
The definition of baseline equipment varies based on number of lamps in a fixture and is defined in the baseline
reference table at the end of this characterization.
DEEMED LIFETIME OF EFFICIENT EQUIPMENT
The deemed lifetime of the efficient equipment fixture is 15 years.
472
DEEMED MEASURE COST
The deemed measure cost is found in reference table at the end of this characterization.
LOADSHAPE
Loadshape NREL01:16 – Nonresidential Lighting (by Building Type)
Algorithm
CALCULATION OF SAVINGS
ELECTRIC ENERGY SAVINGS
Where:
Watts
Base
= Input wattage of the baseline system is dependant on new fixture configuration and
471
Lighting Research Center. T5 Fluorescent Systems.
http://www.lrc.rpi.edu/programs/nlpip/lightingAnswers/lat5/abstract.asp
472
Focus on Energy Evaluation “Business Programs: Measure Life Study” Final Report, August 9, 2009 prepared by PA
Consulting Group.
Filed with the Iowa Utilities Board on September 23, 2020, EEP-2018-0002

Iowa Energy Efficiency Statewide Technical Reference Manual –3.4.6 T5 HO Fixtures and Lamp/Ballast Systems
Vol.3 Nonresidential Measures July 22, 2020 FINAL Page 222 of 410
found in the ‘T5HO Efficient and Baseline Wattage and Cost Assumptions’ reference table
below.
Watts
EE
= Input wattage depends on new fixture configuration (number of lamps) and ballast
factor and number of fixtures. Value can be selected from the ‘T5HO Efficient and Baseline
Wattage and Cost Assumptions’ reference table below.
Hours = Average annual lighting hours of use as provided by the customer or selected from the
Lighting Reference Table in Section 3.4 as annual operating hours, by building type. If
hours or building type are unknown, use the Nonresidential Average value.
WHF
e
= Waste heat factor for energy to account for cooling energy savings from efficient lighting
is selected from the Lighting Reference Table in Section 3.4 for each building type. If
building is un-cooled, the value is 1.0.
ISR = In Service Rate or the percentage of units rebated that get installed.
=100% if application form completed with sign off that equipment is not placed into
storage. If sign off form not completed, assume 98%.
473
Heating Penalty:
If electrically heated building:
474
Where:
IFkWh = Lighting-HVAC Interation Factor for electric heating impacts; this factor represents the
increased electric space heating requirements due to the reduction of waste heat rejected
by the efficent lighting. Values are provided in the Lighting Reference Table in Section 3.4.
If unknown, use the Nonresidential Average value.
SUMMER COINCIDENT DEMAND SAVINGS
Where:
WHFd = Waste Heat Factor for Demand to account for cooling savings from efficient lighting in
cooled buildings is selected from the Lighting Reference Table in Section 3.4 for each
building type. If the building is not cooled, WHFd is 1.
CF = Summer Peak Coincidence Factor for measure is selected from the Lighting Reference
Table in Section 3.4 for each building type. If the building type is unknown, use the
Nonresidential Average value.
NATURAL GAS ENERGY SAVINGS
Heating Penalty if fossil fuel heated building (or if heating fuel is unknown):
Where:
473
Based upon review of PY5-6 evaluations from ComEd, IL commercial lighting program (BILD)
474
Negative value because this is an increase in heating consumption due to the efficient lighting.
Filed with the Iowa Utilities Board on September 23, 2020, EEP-2018-0002

Iowa Energy Efficiency Statewide Technical Reference Manual –3.4.6 T5 HO Fixtures and Lamp/Ballast Systems
Vol.3 Nonresidential Measures July 22, 2020 FINAL Page 223 of 410
IFTherms = Lighting-HVAC Integration Factor for gas heating impacts; this factor represents the
increased gas space heating requirements due to the reduction of waste heat rejected by
the efficient lighting. Values are provided in the Lighting Reference Table in Section
3.4.
475
If unknown, use the Nonresidential Average value.
PEAK GAS SAVINGS
For ease of application, savings for this measure is assumed to be evenly spread across the year. The Peak Gas Savings
is therefore assumed to be:
Where:
ΔTherms = Therm impact calculated above
HeatDays = Heat season days per year
= 197
476
WATER IMPACT DESCRIPTIONS AND CALCULATION
N/A
DEEMED O&M COST ADJUSTMENT CALCULATION
See reference tables for different cost assumptions for lamps and ballasts. When available, actual costs and hours
of use should be used.
REFERENCE TABLES
T5HO Efficient and Baseline Wattage And Cost Assumptions
477
EE Measure Description
WattsEE
Baseline Description
WattsBASE
Incremental Cost
3-Lamp T5 High-Bay
176
200 Watt Pulse Start Metal-Halide
227
$100.00
4-Lamp T5 High-Bay
235
320 Watt Pulse Start Metal-Halide
364
$100.00
6-Lamp T5 High-Bay
352
400 Watt Pulse Start Metal-Halide
455
$100.00
8-Lamp T5 High-Bay
470
750 Watt Pulse Start Metal-Halide
825
$100.00
T5 HO Component Costs and Lifetimes
478
EE Measure
Baseline
EE Measure
Description
Lamp
Life (hrs)
Total Lamp
Replacement
Cost
Ballast
Life
(hrs)
Total Ballast
Replacement
Cost
Lamp
Life (hrs)
Total Lamp
Replacement
Cost
Ballast
Life
(hrs)
Total Ballast
Replacement
Cost
3-Lamp T5 High-Bay
30,000
$63.00
70,000
$87.50
15,000
$63.00
40,000
$107.50
4-Lamp T5 High-Bay
30,000
$84.00
70,000
$87.50
20,000
$68.00
40,000
$117.50
6-Lamp T5 High-Bay
30,000
$126.00
70,000
$112.50
20,000
$73.00
40,000
$127.50
8-Lamp T5 High-Bay
30,000
$168.00
70,000
$137.50
20,000
$78.00
40,000
$137.50
475
Negative value because this is an increase in heating consumption due to the efficient lighting.
476
Number of days where HDD 55 >0.
477
Reference Table adapted from Efficiency Vermont TRM, T5 Measure Savings Algorithms and Cost Assumptions, October,
2014. Refer to “Updated-T5HO-adjusted deemed costs.baselines-7-30-15.xlsx” for more information.
478
Costs include labor cost – see “Updated-T5HO-adjusted deemed costs.baselines-7-30-15.xlsx” for more information.
Filed with the Iowa Utilities Board on September 23, 2020, EEP-2018-0002

Iowa Energy Efficiency Statewide Technical Reference Manual –3.4.6 T5 HO Fixtures and Lamp/Ballast Systems
Vol.3 Nonresidential Measures July 22, 2020 FINAL Page 224 of 410
MEASURE CODE: NR-LTG-T5HO-V02-200101
SUNSET DATE: 1/1/2024
Filed with the Iowa Utilities Board on September 23, 2020, EEP-2018-0002

Iowa Energy Efficiency Statewide Technical Reference Manual –3.4.7 High Performance and Reduced Wattage T8
Fixtures and Lamps
Vol.3 Nonresidential Measures July 22, 2020 FINAL Page 225 of 410
3.4.7. High Performance and Reduced Wattage T8 Fixtures and Lamps
NOTE: THIS MEASURE IS EFFECTIVE UNTIL 12/31/2017. IT SHOULD NOT BE USED BEYOND THAT DATE BUT IS LEFT IN THE
MANUAL FOR REFERENCE PURPOSES.
DESCRIPTION
This measure applies to “High Performance T8” (HPT8) lamp/ballast systems that have higher lumens per watt than
standard T8 or T12 systems and produce equal or greater light levels than standard T8 lamps while using fewer watts,
as well as “Reduced Wattage T8 lamps” or RWT8 lamps. The characterization applies to the installation of new
equipment on existing lighting systems with efficiencies that exceed that of the equipment that would have been
installed following standard market practices, as well as opportunities to relamp/reballast.
If the implementation strategy does not allow for the installation location to be known, the utility will deem a split
between Commercial and Residential use.
Whenever possible, site-specific costs and hours of use should be used for savings calculations. Default new and
baseline assumptions have been provided in the reference tables alongside default component costs and lifetimes
for Operating and Maintenance Calculations.
This measure was developed to be applicable to the following program types: TOS, RF.
If applied to other program types, the measure savings should be verified.
DEFINITION OF EFFICIENT EQUIPMENT
The efficient conditions for TOS and RF applications are a qualifying HP or RWT8 fixture with a ballast factor ˂ 0.79
and lamp/ballast combinations listed on the CEE website under qualifying HP T8 products
479
and qualifying RWT8
products
480
.
DEFINITION OF BASELINE EQUIPMENT
For Time of Sale: The baseline condition will vary depending on the characterization of the fixture installed (e.g., the
number of lamps). For default purposes, the baseline is assumed to be a 50:50 split of T8 system/T12 systems
481
.
This assumption should be reviewed annually to ensure it still reflects an appropriate baseline assumption.
For Retrofit: The baseline condition is assumed to be the existing lighting fixture.
DEEMED LIFETIME OF EFFICIENT EQUIPMENT
The deemed lifetime of efficient equipment is capped at 15 years
482
.
DEEMED MEASURE COST
The deemed measure cost is found in reference table at the end of this characterization.
LOADSHAPE
Loadshape NREL01:16 – Nonresidential Lighting (by Building Type)
479
http://library.cee1.org/content/cee-high-performance-t8-specification
480
http://library.cee1.org/content/reduced-wattage-t8-specification
481
Based on lighting expert knowledge of the market prevalence of T12s given the 2010 Federal mandate banning T12
production.
482
Measure Life Report, Residential and Commercial/Industrial Lighting and HVAC Measures, GDS Associates, June 2007.
Filed with the Iowa Utilities Board on September 23, 2020, EEP-2018-0002

Iowa Energy Efficiency Statewide Technical Reference Manual –3.4.7 High Performance and Reduced Wattage T8
Fixtures and Lamps
Vol.3 Nonresidential Measures July 22, 2020 FINAL Page 226 of 410
Algorithm
CALCULATION OF SAVINGS
ELECTRIC ENERGY SAVINGS
Where:
Watts
Base
= Input wattage of the existing system which depends on the baseline fixture
configuration (number and type of lamp). Value can be selected from the reference table
at the end of the characterization.
Watts
EE
= New Input wattage of EE fixture, which depends on new fixture configuration. Value
can be selected from the appropriate reference table at the end of the characterization,
or a custom value can be used.
Hours = Average annual lighting hours of use as provided by the customer or selected from the
Lighting Reference Table in Section 3.4 by building type. If hours or building type are
unknown, use the Nonresidential Average value.
WHF
e
= Waste heat factor for energy to account for cooling energy savings from efficient lighting
is selected from the Reference Table in Section x for each building type. If building is un-
cooled, the value is 1.0.
ISR = In Service Rate is assumed to be 100%
Heating Penalty:
If electrically heated building:
Where:
IFkWh = Lighting-HVAC Interation Factor for electric heating impacts; this factor represents the
increased electric space heating requirements due to the reduction of waste heat rejected
by the efficent lighting. Values are provided in the Lighting Reference Table in Section 3.4.
If unknown, use the Nonresidential Average value.
Mid-life Adjustment:
A mid-life savings adjustment should be applied in 2020 to account for the baseline lamp replacement assumption
changing from a blended 50/50 Standard T8/T12 to 100% Standard T8 by 2020
483
. The savings adjustment is
calculated as follows, and is provided in the HP/RW T8 Reference Table below:
Where:
483
As of July 1, 2010, a Federal mandate states that the magnetic ballasts used in many T12 fixtures can no longer be produced
for commercial and industrial applications. However, there have been many loopholes that have meant T12 lamps continue to
hold a significant market share. It is expected that new mandates will close the loophole within the next few years. T12 lamps
have an average life of 20,000 hours and if we assume they are operated on average for 4500 hours annually, this would mean
a lamp would have to be replaced every 4.5 years. We therefore assume that by 2020 all replacement lamps are Standard T8s.
Therefore, while the more likely scenario would be a gradual shift of the 50/50 weighted baseline to T8s over the timeframe, to
simplify this assumption, a single mid-life adjustment in 2020 is assumed.
Filed with the Iowa Utilities Board on September 23, 2020, EEP-2018-0002

Iowa Energy Efficiency Statewide Technical Reference Manual –3.4.7 High Performance and Reduced Wattage T8
Fixtures and Lamps
Vol.3 Nonresidential Measures July 22, 2020 FINAL Page 227 of 410
WattsT8Base = Input wattage of the existing system based on 100% T8 fixture; see reference
table below.
WattsBlendedT8/T12 = Input wattage of the existing system based on 50% T8 / 50% T12; see reference
table below.
SUMMER COINCIDENT DEMAND SAVINGS
Where:
WHF
d
= Waste Heat Factor for Demand to account for cooling savings from efficient lighting in
cooled buildings is selected from the Lighting Reference Table in Section 3.4 for each
building type. If the building is not cooled, WHFd is 1.
CF = Summer Peak Coincidence Factor for measure is selected from the Lighting Reference
Table in Section 3.4 for each building type. If the building type is unknown, use the
Nonresidential Average value.
NATURAL GAS ENERGY SAVINGS
Heating Penalty if fossil fuel heated building (or if heating fuel is unknown):
Where:
IFTherms = Lighting-HVAC Integration Factor for gas heating impacts
484
; this factor represents the
increased gas space heating requirements due to the reduction of waste heat rejected by
the efficient lighting. Values are provided in the Lighting Reference Table in Section 3.4.
If unknown, use the Nonresidential Average value.
PEAK GAS SAVINGS
For ease of application, savings for this measure is assumed to be evenly spread across the year. The Peak Gas Savings
is therefore assumed to be:
Where:
ΔTherms = Therm impact calculated above
HeatDays = Heat season days per year
= 197
485
WATER IMPACT DESCRIPTIONS AND CALCULATION
N/A
DEEMED O&M COST ADJUSTMENT CALCULATION
484
Negative value because this is an increase in heating consumption due to the efficient lighting.
485
Number of days where HDD 55 >0.
Filed with the Iowa Utilities Board on September 23, 2020, EEP-2018-0002

Iowa Energy Efficiency Statewide Technical Reference Manual –3.4.7 High Performance and Reduced Wattage T8
Fixtures and Lamps
Vol.3 Nonresidential Measures July 22, 2020 FINAL Page 228 of 410
Actual operation and maintenance costs will vary by specific equipment installed/replaced. See reference table
below.
REFERENCE TABLES
486
EE Measure Description
Watts
EE
Baseline Description
T12/T8Wat
ts
BASE
T8
Watts
BASE
Incremental
Cost
Mid-life Savings
Adjustment
(2020)
1-Lamp 32w HPT8 (BF < 0.79)
24
50:50 T12:Standard T8
30.1
29
$15.00
84%
2-Lamp 32w HPT8 (BF < 0.77)
48
50:50 T12:Standard T8
59.5
57
$17.50
78%
3-Lamp 32w HPT8 (BF < 0.76)
71
50:50 T12:Standard T8
96.2
84
$20.00
53%
4-Lamp 32w HPT8 (BF < 0.78)
98
50:50 T12:Standard T8
128.3
113
$22.50
48%
6-Lamp 32w HPT8 (BF < 0.76)
142
50:50 T12:Standard T8
192.5
169
$40.00
53%
1-Lamp 28w RWT8 (BF < 0.76)
21
50:50 T12:Standard T8
30.1
29
$15.00
89%
2-Lamp 28w RWT8 (BF < 0.76)
43
50:50 T12:Standard T8
59.5
57
$17.50
85%
3-Lamp 28w RWT8 (BF < 0.77)
63
50:50 T12:Standard T8
96.2
84
$20.00
65%
4-Lamp 28w RWT8 (BF < 0.79)
88
50:50 T12:Standard T8
128.3
113
$22.50
61%
6-Lamp 28w RWT8 (BF < 0.77)
126
50:50 T12:Standard T8
192.5
169
$40.00
65%
EE Measure
Baseline
EE Measure Description
Lamp
Qty
Lamp
Life
(hrs)
Total Lamp
Replacement
Cost
Ballast
Life
(hrs)
Total Ballast
Replacement
Cost
T12/T8
Lamp
Life
(hrs)
487
Total Lamp
Replacement
Cost
Ballast
Life
(hrs)
Total Ballast
Replacement
Cost
1-Lamp 32w HPT8 (BF < 0.79)
1
24,000
$8.17
70,000
$52.50
22000
$5.67
55,000
$35.00
2-Lamp 32w HPT8 (BF < 0.77)
2
24,000
$16.34
70,000
$52.50
22000
$11.33
55,000
$35.00
3-Lamp 32w HPT8 (BF < 0.76)
3
24,000
$24.51
70,000
$52.50
22000
$17.00
55,000
$35.00
4-Lamp 32w HPT8 (BF < 0.78)
4
24,000
$32.68
70,000
$52.50
22000
$22.67
55,000
$35.00
6-Lamp 32w HPT8 (BF < 0.76)
6
24,000
$49.02
70,000
$105.00
22000
$34.00
55,000
$35.00
1-Lamp 28w RWT8 (BF < 0.76)
1
18,000
$8.17
70,000
$52.50
22000
$5.67
55,000
$35.00
2-Lamp 28w RWT8 (BF < 0.76)
2
18,000
$16.34
70,000
$52.50
22000
$11.33
55,000
$35.00
3-Lamp 28w RWT8 (BF < 0.77)
3
18,000
$24.51
70,000
$52.50
22000
$17.00
55,000
$35.00
4-Lamp 28w RWT8 (BF < 0.79)
4
18,000
$32.68
70,000
$52.50
22000
$22.67
55,000
$35.00
6-Lamp 28w RWT8 (BF < 0.77)
6
18,000
$49.02
70,000
$105.00
22000
$34.00
55,000
$35.00
MEASURE CODE: NR-LTG-HPT8-V01-170101
SUNSET DATE: 1/1/2019
486
Watt, lumen, lamp life, and ballast factor assumptions for efficient measures are based upon Consortium for Energy
Efficiency (CEE) Commercial Lighting Qualifying Product Lists. Watt, lumen, lamp life, and ballast factor assumptions for baseline
fixtures are based upon manufacturer specification sheets. Baseline and efficient measure cost data comes from lighting
suppliers, past Efficiency Vermont projects, and professional judgment. See "Updated-HPT8 TRM Reference Tables7-30-15.xlsx"
for more information and specific product links. Currently, 25WT8 are not considered under this measure as their lower light
trade off and limitations on temperature and dimming have caused most distributers/contractors to use 28W almost
exclusively in other markets.
487
50:50 T8/T12 baseline lamp life based on assumed lamp life of 20,000 hrs for T12 and 24,000 hrs for T8.
Filed with the Iowa Utilities Board on September 23, 2020, EEP-2018-0002

Iowa Energy Efficiency Statewide Technical Reference Manual –3.4.8 Metal Halide
Vol.3 Nonresidential Measures July 22, 2020 FINAL Page 229 of 410
3.4.8. Metal Halide
NOTE: THIS MEASURE IS EFFECTIVE UNTIL 12/31/2017. IT SHOULD NOT BE USED BEYOND THAT DATE BUT IS LEFT IN THE
MANUAL FOR REFERENCE PURPOSES.
DESCRIPTION
This measure addresses the installation of high efficiency pulse start metal halide fixtures and lamps in place of a
standard metal halide. Pulse start metal halide luminaires produce more lumens per watt and have an improved
lumen maintenance compared to standard probe start technology. Similarly the high efficiency pulse start metal
halide ballast lasts longer than a standard system due to their cooler operating temperatures.
488
This measure was developed to be applicable for Retrofit (RF) program.
DEFINITION OF EFFICIENT EQUIPMENT
The efficient condition is an EISA-compliant pulse start metal halide lamp and ballasts for luminaires. Under 2009
federal rulings metal halide ballasts in low-watt options (150W-500W fixtures) must be pulse start and have a
minimum ballast efficiency of 88%.
489
Amendments made in 2014 will require more stringent energy conservations
standards with compliance required by February 10, 2017
490
.
DEFINITION OF BASELINE EQUIPMENT
The baseline condition is the existing bulb and fixture. If unknown assume, High Intensity Discharge (HID) Metal
Halide lighting with probe start fixture and a standard ≤ 400 Watt lamp.
DEEMED LIFETIME OF EFFICIENT EQUIPMENT
The measure life is assumed to be 15 years
491
.
DEEMED MEASURE COST
Where actual costs are unknown, the incremental capital cost is assumed to be $267
492
LOADSHAPE
488
Building a Brighter Future: Your Guide to EISA-Compliant Ballast and Lamp Solutions from Philips Lighting:
http://1000bulbs.com/pdf/advance%20eisa%20brochure.pdf
489
Under EISA rulings metal halide ballasts in low-watt options must be pulse start and have a minimum ballast efficiency of
88%. This ruling virtually eliminates the manufacture of probe start (ceramic) fixtures but some exemptions exist including
significantly the 150w wet location fixtures (as rated per NEC 2002, section 410.4 (A)). These will be replaced by 150W.
Department of Energy – 10 CFR Part 431 – Energy Conservation Program: Energy Conservation Standards for Metal Halide Lamp
Fixtures; Final Rule 7746 Federal Register / Vol. 79, No. 27 / Monday, February 10, 2014 / Rules and Regulations
https://www.federalregister.gov/articles/2014/02/10/2014-02356/energy-conservation-program-energy-conservation-
standards-for-metal-halide-lamp-fixtures#h-9
490
The revised 2014 efficiency standards for metal halides require that luminaires produced on or after February 10th, 2017
must not contain a probe-start metal halide ballast. Exceptions to this ruling include, metal halide luminaires with a regulated-
lag ballast, that utilize an electronic ballasts which operates at 480V and those which utilize a high-frequency (≥1000Hz)
electronic ballast. Department of Energy – 10 CFR Part 431 – Energy Conservation Program: Energy Conservation Standards for
Metal Halide Lamp Fixtures; Final Rule 7746 Federal Register / Vol. 79, No. 27 / Monday, February 10, 2014 / Rules and
Regulations https://www.federalregister.gov/articles/2014/02/10/2014-02356/energy-conservation-program-energy-
conservation-standards-for-metal-halide-lamp-fixtures#h-9
491
GDS Associates, Measure Life Report, Residential and Commercial/Industrial Lighting and HVAC Measures, June 2007,
http://library.cee1.org/sites/default/files/library/8842/CEE_Eval_MeasureLifeStudyLights&HVACGDS_1Jun2007.pdf
492
Assuming cost of lamp and fixture combined per Itron, Inc. 2010-2012 WO017 Ex Ante Measure Cost Study – Final Report
(Deemed Measures), May 27, 2014.
Filed with the Iowa Utilities Board on September 23, 2020, EEP-2018-0002

Iowa Energy Efficiency Statewide Technical Reference Manual –3.4.8 Metal Halide
Vol.3 Nonresidential Measures July 22, 2020 FINAL Page 230 of 410
Loadshape NREL01:16 – Nonresidential Lighting (by Building Type)
Algorithm
CALCULATION OF SAVINGS
ELECTRIC ENERGY SAVINGS
Where:
Watts
Base
= Input wattage of the existing system which depends on the baseline fixture
configuration (number and type of lamp). Value can be selected from the reference table
at the end of the characterization or a custom value can be used.
Watts
EE
= New Input wattage of EE fixture, which depends on new fixture configuration. Value
can be selected from the appropriate reference table at the end of the characterization,
or a custom value can be used.
Hours = Average annual lighting hours of use as provided by the customer or selected from the
Lighting Reference Table in Section 3.4 by building type. If hours or building type are
unknown, use the Nonresidential Average value.
WHF
e
= Waste heat factor for energy to account for cooling energy savings from efficient lighting
is selected from the Lighting Reference Table in Section 3.4 for each building type. If
building is un-cooled, the value is 1.0.
ISR = In Service Rate or percentage of units rebated that get installed is assumed to be 97%
493
Heating Penalty:
If electrically heated building:
Where:
IFkWh = Lighting-HVAC Interation Factor for electric heating impacts; this factor represents the
increased electric space heating requirements due to the reduction of waste heat rejected
by the efficent lighting. Values are provided in the Lighting Reference Table in Section 3.4.
If unknown, use the Nonresidential Average value.
SUMMER COINCIDENT DEMAND SAVINGS
Where:
WHF
d
= Waste Heat Factor for Demand to account for cooling savings from efficient lighting in
cooled buildings is selected from the Lighting Reference Table in Section 3.4 for each
building type. If the building is not cooled, WHFd is 1.
CF = Summer Peak Coincidence Factor for measure is selected from the Lighting Reference
Table in Section 3.4 for each building type. If the building type is unknown, use the
493
Itron, Verification of Reported Energy and Peak Savings from the EmPOWER Maryland Energy Efficiency Programs, April 21,
2011; IA specific value should be determined with subsequent evaluations.
Filed with the Iowa Utilities Board on September 23, 2020, EEP-2018-0002

Iowa Energy Efficiency Statewide Technical Reference Manual –3.4.8 Metal Halide
Vol.3 Nonresidential Measures July 22, 2020 FINAL Page 231 of 410
Nonresidential Average value.
NATURAL GAS ENERGY SAVINGS
Heating Penalty if fossil fuel heated building (or if heating fuel is unknown):
Where:
IFTherms = Lighting-HVAC Integration Factor for gas heating impacts
494
; this factor represents the
increased gas space heating requirements due to the reduction of waste heat rejected by
the efficient lighting. Values are provided in the Lighting Reference Table in Section 3.4.
If unknown, use the Nonresidential Average value.
PEAK GAS SAVINGS
For ease of application, savings for this measure is assumed to be evenly spread across the year. The Peak Gas Savings
is therefore assumed to be:
Where:
ΔTherms = Therm impact calculated above
HeatDays = Heat season days per year
= 197
495
WATER IMPACT DESCRIPTIONS AND CALCULATION
N/A
DEEMED O&M COST ADJUSTMENT CALCULATION
Actual operation and maintenance costs will vary by specific equipment installed/replaced. See reference table
below.
REFERENCE TABLES
496
Lamp Watt
EE
Efficient
Fixture Ballast
Efficient
System Lumen
System
Watt
EE
Lamp Watt
Base
Baselines
Ballast
497
System
Watts
Base
Baseline
System
Lumen
Pulse Start MH
150W
Pulse Start-
CWA Ballast
10500
185
Probe Start
MH 175W
standard C&C
210
9100
Pulse Start MH
175W
Pulse Start-
CWA Ballast
11200
208
Probe Start
MH 175W
standard C&C
210
9100
Pulse Start MH
200W
Pulse Start-
CWA Ballast
16800
232
Probe Start
MH250W
standard C&C
295
13500
494
Negative value because this is an increase in heating consumption due to the efficient lighting.
495
Number of days where HDD 55 >0.
496
Per lamp/ballast
497
Standard Magnetic Core and Coil ballast systems are common for Metal Halide lamp wattages 175-400. See Panasonic
“Metal Halide: Probe Start vs. Pulse Start”
Filed with the Iowa Utilities Board on September 23, 2020, EEP-2018-0002

Iowa Energy Efficiency Statewide Technical Reference Manual –3.4.8 Metal Halide
Vol.3 Nonresidential Measures July 22, 2020 FINAL Page 232 of 410
Lamp Watt
EE
Efficient
Fixture Ballast
Efficient
System Lumen
System
Watt
EE
Lamp Watt
Base
Baselines
Ballast
497
System
Watts
Base
Baseline
System
Lumen
Pulse Start MH
250W
Pulse Start-
CWA Ballast
16625
290
Probe Start
MH250W
standard C&C
295
13500
Pulse Start MH
320W
Pulse Start-
CWA Ballast
21000
368
Probe Start
MH400W
standard C&C
458
24000
Pulse Start
MH350W
Pulse Start-
CWA Ballast
25200
400
Probe Start
MH400W
standard C&C
458
24000
Pulse Start MH
400W
Pulse Start-
CWA Ballast
29820
452
Probe Start
MH400W
standard C&C
458
24000
MEASURE CODE: NR-LTG-PSMH-V02-180101
SUNSET DATE: 1/1/2019
Filed with the Iowa Utilities Board on September 23, 2020, EEP-2018-0002

Iowa Energy Efficiency Statewide Technical Reference Manual –3.4.9 Commercial LED Exit Sign
Vol.3 Nonresidential Measures July 22, 2020 FINAL Page 233 of 410
3.4.9. Commercial LED Exit Sign
This measure characterizes the savings associated with installing a Light Emitting Diode (LED) exit sign in place of a
fluorescent/compact fluorescent (CFL) exit sign in a Commercial building. LED exit signs use a lower wattage of power
(≤ 5 Watts) and have a significantly longer life compared to standard signs that can use up to 40 watts.
498
This in
addition to reduced maintenance needs, and characteristic low-temperature light quality makes LED exit signs a
superior option compared to other exit sign technologies available today.
This measure was developed to be applicable to the following program types: Retrofit (RF), and Direct Install (DI).
DEFINITION OF EFFICIENT EQUIPMENT
The efficient equipment is assumed to be an exit sign illuminated by LEDs with an input power demand of 5 watts or
less per face.
499
DEFINITION OF BASELINE EQUIPMENT
The baseline is the existing fluorescent/compact fluorescent (CFL) exit sign.
DEEMED LIFETIME OF EFFICIENT EQUIPMENT
The measure life is assumed to be 13 years.
500
DEEMED MEASURE COST
The actual material and labor costs should be used if available. If actual costs are unavailable, assume a total installed
cost of at $32.50.
501
LOADSHAPE
Loadshape E01 – Flat
Algorithm
CALCULATION OF SAVINGS
ELECTRIC ENERGY SAVINGS
502
Where:
Watts
Base
= Actual wattage if known, if unknown assume the following:
498
ENERGY STAR “Save Energy, Money and Prevent Pollution with LED Exit Signs”
499
ENERGY STAR “Program Requirements for Exit Signs – Eligibility Criteria” Version.3. While the EPA suspended the ENERGY
STAR Exit Sign specification effective May 1, 2008, Federal requirements specify minimum efficiency standards for electrically-
powered, single-faced exit signs with integral lighting sources that are equivalent to ENERGY STAR levels for input power
demand of 5 watts or less per face.
500
GDA Associates Inc. “Measure Life Report: Residential and Commercial/Industrial Lighting and HVAC Measures”, June 2007.
501
Price includes new exit sign/fixture and installation. LED exit cost cost/unit is $22.50 from the NYSERDA Deemed Savings
Database and assuming IA labor cost of 15 minutes @ $40/hr.
502
There is no ISR calculation. Exit signs and emergency lighting are required by federal regulations to be installed and
functional in all public buildings as outlined by the U.S. Occupational Safety and Health Standards (USOSHA 1993).
Filed with the Iowa Utilities Board on September 23, 2020, EEP-2018-0002

Iowa Energy Efficiency Statewide Technical Reference Manual –3.4.9 Commercial LED Exit Sign
Vol.3 Nonresidential Measures July 22, 2020 FINAL Page 234 of 410
Watts
EE
= Actual wattage if known, if unknown assume singled sided 2W and dual sided 4W
505
Hours = Annual operating hours
= 8766
WHF
e
= Waste heat factor for energy to account for cooling energy savings from efficient lighting
are provided for each building type in the Lighting Reference Table 3.4. If unknown, use
the Nonresidential Average value.
HEATING PENALTY
If electrically heated building:
506
Where:
IFkWh = Lighting-HVAC Interation Factor for electric heating impacts; this factor represents the
increased electric space heating requirements due to the reduction of waste heat rejected
by the efficent lighting. Values are provided in the Lighting Reference Table in Section 3.4.
If unknown, use the Nonresidential average value.
SUMMER COINCIDENT PEAK DEMAND SAVINGS
503
Federal Standards effectively ended the manufacturing of incandescent exit signs in 2006 and therefore in unknow
instances it should be assumed existing exit signs use CFL lamps since the lifetime of any remaining incandescent exit signs
would to have expired per the 13 year measure assigned to this measure.
504
Average CFL single sided (5W, 7W, 9W) from Appendix B 2013-14 Table of Standard Fixture Wattages. Available at:
http://www.aesc-inc.com/download/spc/2013SPCDocs/PGE/App%20B%20Standard%20Fixture%20Watts.pdf
505
Average Exit LED watts are assumed as a 2W as listed in Appendix B 2013-14 Table of Standard Fixture Wattages. Available
at: http://www.aesc-inc.com/download/spc/2013SPCDocs/PGE/App%20B%20Standard%20Fixture%20Watts.pdf
505
Average LED single sided (2W) from Appendix B 2013-14 Table of Standard Fixture Wattages. Available at: http://www.aesc-
inc.com/download/spc/2013SPCDocs/PGE/App%20B%20Standard%20Fixture%20Watts.pdf
506
Results in a negative value because this is an increase in heating consumption due to the efficient lighting.
Program Type
Baseline Type
Watts
Base
Retrofit/Direct Install
503
CFL (dual sided)
14W
504
CFL (single sided)
7W
For example, for a 4W, dual sided LED exit sign replacing a CFL lamp in electrically heated building with cooling:
ΔkWh = ((14 – 4) /1000) * 8,766 * 1.13
= 99.1 kWh
For example, for a 4W, dual sided LED exit sign replacing a CFL lamp in electrically heated building with cooling:
ΔkWhheatingpenalty = ((14 – 4) /1000) * 8,766 * (-0.43)
= -37.7 kWh
Filed with the Iowa Utilities Board on September 23, 2020, EEP-2018-0002

Iowa Energy Efficiency Statewide Technical Reference Manual –3.4.9 Commercial LED Exit Sign
Vol.3 Nonresidential Measures July 22, 2020 FINAL Page 235 of 410
Where:
WHF
d
= Waste heat factor for demand to account for cooling savings from efficient lighting in
cooled buildings is provided in the Lighting Reference Table in Section 3.4. If unknown,
use the Nonresidential average value.
CF = Summer Peak Coincidence Factor for this measure
= 1.0
507
NATURAL GAS ENERGY SAVINGS
Heating Penalty if fossil fuel heated buiding (or if heating is unknown):
508
Where:
IFTherms = Lighting-HVAC Integration Factor for gas heating impacts; this factor represents the
increased gas space heating requirements due to the reduction of waste heat rejected by
the efficient lighting. Values are provided in the Lighting Reference Table in Section 3.4.
If unknown, use the Nonresidential average value.
PEAK GAS SAVINGS
For ease of application, savings for this measure is assumed to be evenly spread across the year. The Peak Gas Savings
is therefore assumed to be:
Where:
ΔTherms = Therm impact calculated above
HeatDays = Heat season days per year
= 197
509
507
Assuming continuous operation of an LED exit sign, the Summer Peak Coincidence Factor is assumed to equal 1.0.
508
Results in a negative value because this is an increase in heating consumption due to the efficient lighting.
509
Number of days where HDD 55 >0.
For example, for a 4W, dual sided LED exit sign replacing a CFL lamp in electrically heated building with cooling:
ΔkW = ((14 – 4) /1000) * 1.42 * 1.0
= 0.0142 kW
For example, for a 4W, dual sided LED exit sign replacing a CFL lamp in a fossil fuel heated building:
ΔTherms = ((14 – 4) /1000) * 8,766 * (-0.018)
= -1.5779 therms
For example, for a 4W, dual sided LED exit sign replacing a CFL lamp in a fossil fuel heated building:
ΔPeakTherms = -1.5779/197
= -0.0080 therms
Filed with the Iowa Utilities Board on September 23, 2020, EEP-2018-0002

Iowa Energy Efficiency Statewide Technical Reference Manual –3.4.9 Commercial LED Exit Sign
Vol.3 Nonresidential Measures July 22, 2020 FINAL Page 236 of 410
WATER IMPACT DESCRIPTIONS AND CALCULATION
N/A
DEEMED O&M COST ADJUSTMENT CALCULATION
The annual O&M Cost Adjustment savings should be calculated using the following component costs and lifetimes.
Program Type
Component
Baseline Measure
Cost
Life (yrs)
Retrofit/Direct Install
CFL lamp
$13.00
510
0.57 years
511
MEASURE CODE: NR-LTG-EXIT-V04-200101
SUNSET DATE: 1/1/2024
510
Consistent with assumption as listed by the U.S. Department of Energy, ENERGY STARY Life Cycle Cost Exit-Sign Calculator
available at https://www.energystar.gov/index.cfm?c=exit_signs.pr_exit_signs for estimated labor cost of $10 (assuming
$40/hour and a task time of 15 minutes). Replacement of a CFL bulb is assumed to be $3 as noted by regional IA program
details (IPL Business Assessment).
511
ENERGY STAR “Save Energy, Money and Prevent Pollution with LED Exit Signs” specifies that CFL bulbs for Exit Signs typically
have an average rated life of 5000-6000 hours. Given 24/7 run time assume Exit Light replacement requirements as
5,500/8760.
Filed with the Iowa Utilities Board on September 23, 2020, EEP-2018-0002

Iowa Energy Efficiency Statewide Technical Reference Manual –3.4.10 LED Street Lighting
Vol.3 Nonresidential Measures July 22, 2020 FINAL Page 237 of 410
3.4.10. LED Street Lighting
This measure characterizes the savings associated with LED street lighting conversions where a Light Emitting Diode
(LED) fixture replaces a Metal Halide, High Pressure Sodium or Mercury Vapor outdoor lighting system. LED street
lights provide considerable benefits compared to HID lights including:
• Improved nighttime visibility and safety through better color rendering, more uniform light distribution and
elimination of dark areas between poles.
• Reduced direct and reflected uplight which are the primary causes of urban sky glow.
• 40-80% energy savings (dependent on incumbent lighting source).
• 50-75% street lighting maintenance savings.
512
This measure includes LED fixture housings including cobrahead and post-top and is applicable only where utility
tariffs support LED street lighting conversions.
This measure was developed to be applicable for a one-to-one Retrofit (RF) opportunity only.
513
DEFINITION OF EFFICIENT EQUIPMENT
The efficient equipment must be an LED fixture that meets the United Illuminating Rate Schedule, alongside all other
luminary performance requirements based on site characteristics
514
and all local, state, and federal codes.
DEFINITION OF BASELINE EQUIPMENT
The baseline equipment is the existing system – a Metal Halide, High Pressure Sodium or Mercury Vapor outdoor
lamp, ballast and fixture.
DEEMED LIFETIME OF EFFICIENT EQUIPMENT
The measure life is assumed to be 20 years.
515
DEEMED MEASURE COST
516
Actual measure installation cost should be used (including material and labor).
517
Use actual costs of LED unit when
512
See NEEP “LED Street Lighting Assessment and Strategies for the Northeast and Mid-Atlantic”, January 2015, and the
Municipal Solid State Street Lighting Consortium for more information
http://www1.eere.energy.gov/buildings/ssl/consortium.html
513
Many light fixtures were placed in service 20-50 years ago and may no longer service their intended purpose. It is important
to conduct a comprehensive assessment of lighting needs with a lighting professional when considering a LED street lighting
project. LED street lighting can result in removal of lighting all together as LED lights provide better CRI and lighting levels than
existing HID lighting types. While this measure only characterizes a one-to-one replacement value it is recommended that this
measure be updated following an IA assessment to see where LED street lighting has resulted in the removal of street lighting to
ensure additional savings calculations are captured. Recommend using Street and Parking Facility Lighting Retrofit Financial
Analysis Tool developed by DOE Municipal Solid-State Street Lighting Consortium and the Federal Energy Management Program.
514
See DOE Municipal Solid-State Street Lighting Consortium “Model specifications for LED roadway luminaires v.2.0”
http://energy.gov/eere/ssl/downloads/model-specification-led-roadway-luminaires-v20
515
It is widely assumed that LEDs used in street lighting available today may still be producing over 80% of their initial light after
100,000 hours. See the DOE Municipal Solid-State Street Lighting Consortium for more information.
http://www1.eere.energy.gov/buildings/ssl/consortium.html
516
NEEP DOE LED Street Lighting Assessment and Strategies for the Northeast and Mid-Atlantic" - based upon their reference of
Reuters. “Cree Introduces the Industry’s First $99 LED Street Light as a Direct Replacement for Residential Street Lights,” (August
2013).
517
Labor should include the removal of the old fixture and installation of the new fixture. IA DOT prevailing wage should be
assumed.
Filed with the Iowa Utilities Board on September 23, 2020, EEP-2018-0002

Iowa Energy Efficiency Statewide Technical Reference Manual –3.4.10 LED Street Lighting
Vol.3 Nonresidential Measures July 22, 2020 FINAL Page 238 of 410
know. If unknown use the default values/luminaire provided below:
Light output
Low (<50W)
Med (50W-100W)
High (>100W)
Fixture Type
min
max
min
max
min
max
Decorative/Post Top
$350.00
$615.00
$550.00
$950.00
$750.00
$1,450.00
Cobrahead
$99.00
$225.00
$179.00
$451.00
$310.00
$720.00
LOADSHAPE
Loadshape NREL017 – Nonresidential Street Lighting
Algorithm
CALCULATION OF SAVINGS
ELECTRIC ENERGY SAVINGS
518
Where:
Watts
Base
= Actual wattage if known, if unknown assume the following nominal wattage based on
technology.
Metal Halide = 250W
519
Mercury Vapor = 175W
520
High Pressure Sodium = 170W
521
SUMMER COINCIDENT PEAK DEMAND SAVINGS
522
CF = Summer Peak Coincidence Factor for this measure
=0%
NATURAL GAS ENERGY SAVINGS
N/A
PEAK GAS SAVINGS
518
There is no ISR calculation. Savings are per unit.
519
Based on averaging Metal Halide information provided in IA custom LED street lighting installations with MH baseline and
NEEP Street Lighting Assessment (100, 175, 250, 400W)
520
Based on averaging Mercury Vapor information provided in IA custom LED street lighting installations and NEEP Street
Lighting Assessment (175W)
521
Based on averaging High Pressure Sodium information provided in IA custom LED street lighting installations and NEEP
Street Lighting Assessment (50, 70, 100, 150250, 400).
522
On-peak savings for street lighting occur mostly in the winter. Only off-peak demand savings occur during the summer
months.
Filed with the Iowa Utilities Board on September 23, 2020, EEP-2018-0002

Iowa Energy Efficiency Statewide Technical Reference Manual –3.4.10 LED Street Lighting
Vol.3 Nonresidential Measures July 22, 2020 FINAL Page 239 of 410
N/A
WATER IMPACT DESCRIPTIONS AND CALCULATION
N/A
DEEMED O&M COST ADJUSTMENT CALCULATION
O&M costs are estimated at $50/LED luminaire annually.
523
MEASURE CODE: NR-LTG-STLT-V01-190101
SUNSET DATE: 1/1/2024
523
Based upon NEEPs report and quantitative analysis of LED street light conversions in the Northeast and Mid-Atlantic region.
municipal luminaires evaluated by “LED Street Lighting Assessment and Strategies for the Northeast and Mid-Atlantic”, January
2015.
Filed with the Iowa Utilities Board on September 23, 2020, EEP-2018-0002

Iowa Energy Efficiency Statewide Technical Reference Manual –3.4.11 LED Traffic and Pedestrian Signals
Vol.3 Nonresidential Measures July 22, 2020 FINAL Page 240 of 410
3.4.11. LED Traffic and Pedestrian Signals
DESCRIPTION
Light emitting diodes (LED) traffic and pedestrian signals are an efficient and effective alternative to traditional
incandescent signals due to their low power consumption, performance in cooler temperatures and very long life.
LED traffic signal lamps typically use 80 to 90 percent less energy than the incandescent lamps that they replace and
the longer life expectancies of LED traffic signal lamps can reduce maintenance costs over incandescent technology
by approximately 75 percent, making the payback of a retrofit project as short as one to three years.
524
This measure was developed to be applicable to the Retrofit (RF) program.
DEFINITION OF EFFICIENT EQUIPMENT
The Energy Policy Act of 2005 requires all LED traffic signal fixtures to meet the minimum performance requirements
as listed by the ENERGY STAR Traffic Signal Specification that include arrow and pedestrian signal modules.
525
DEFINITION OF BASELINE EQUIPMENT
The baseline condition is the existing incandescent traffic signal lighting technology. See reference tables below for
baseline efficiencies and assumptions.
DEEMED LIFETIME OF EFFICIENT EQUIPMENT
The assumed lifetime of an LED traffic signal is 100,000 hours (manufacturer’s estimate), capped at 10 years.
526
The
life in years is calculated by dividing 100,000 hrs by the annual operating hours for the particular signal type.
DEEMED MEASURE COST
Actual measure installation cost should be used (including material and labor).
LOADSHAPE
Loadshape NREL18 - Traffic Signal - Red Balls, always changing or flashing
Loadshape NREL19 - Traffic Signal - Red Balls, changing day, off night
Loadshape NREL20 - Traffic Signal - Green Balls, always changing
Loadshape NREL21 - Traffic Signal - Green Balls, changing day, off night
Loadshape NREL22 - Traffic Signal - Red Arrows
Loadshape NREL23 - Traffic Signal - Green Arrows
Loadshape NREL24 - Traffic Signal - Flashing Yellows
Loadshape NREL25 - Traffic Signal - “Hand” Don’t Walk Signal
Loadshape NREL26 - Traffic Signal - “Man” Walk Signal
Loadshape NREL27 - Traffic Signal - Bi-Modal Walk/Don’t Walk
524
See LED Traffic Light FAQs http://www.appropedia.org/LED_traffic_light_FAQ
525
ENERGY STAR Program Requirements for Traffic Signals: Eligibility Criteria. See:
https://www.energystar.gov/ia/partners/product_specs/eligibility/traffic_elig.pdf and https://www.ite.org/technical-
resources/topics/standards/
526
Goldberg et al, State of Wisconsin Public Service Commission of Wisconsin, Focus on Energy Evaluation, Business Programs:
Measure Life Study, KEMA, August 25, 2009
Filed with the Iowa Utilities Board on September 23, 2020, EEP-2018-0002

Iowa Energy Efficiency Statewide Technical Reference Manual –3.4.11 LED Traffic and Pedestrian Signals
Vol.3 Nonresidential Measures July 22, 2020 FINAL Page 241 of 410
Algorithm
CALCULATION OF SAVINGS
ELECTRIC ENERGY SAVINGS
Where:
=The connected load of the baseline equipment
= see reference tables below “Table ‘Traffic Signals Technology Equivalencies’
=The connected load of the baseline equipment
= see reference tables below “Table ‘Traffic Signals Technology Equivalencies’
= annual operating hours of the lamp
= see reference tables below “Table ‘Traffic Signals Technology Equivalencies’
COINCIDENT PEAK DEMAND SAVINGS
Where:
= Peak coincidence factor for measure
The peak coincidence factor (CF) for this measure is dependent on lamp type as outlined below:
Lamp Type
CF
527
Red Round, always changing or flashing
0.55
Red Arrows
0.90
Green Arrows
0.10
Yellow Arrows
0.03
Green Round, always changing or flashing
0.43
Flashing Yellow
0.50
Yellow Round, always changing
0.02
“Hand” Don’t Walk Signal
0.75
“Man” Walk Signal
0.21
NATURAL GAS ENERGY SAVINGS
N/A
PEAK GAS SAVINGS
N/A
WATER IMPACT DESCRIPTIONS AND CALCULATION
527
ACEEE, (1998) A Market Transformation Opportunity Assessment for LED Traffic Signals, https://aceee.org/research-
report/a983
Filed with the Iowa Utilities Board on September 23, 2020, EEP-2018-0002

Iowa Energy Efficiency Statewide Technical Reference Manual –3.4.11 LED Traffic and Pedestrian Signals
Vol.3 Nonresidential Measures July 22, 2020 FINAL Page 242 of 410
N/A
REFERENCE TABLES
528
Traffic Signals Technology Equivalencies
529
Flashing Signal
Fixture Size
and Color
Efficient
Lamps
Baseline
Lamps
HOURS
Watts
EE
Watts
Base
Energy
Savings
(in kWh)
Round Signals
8” Red
LED
Incandescent
4820
7
69
299
Round Signals
12” Red
LED
Incandescent
4820
6
150
694
Round Signals
8” Yellow
LED
Incandescent
175
10
69
10
Round Signals
12” Yellow
LED
Incandescent
175
13
150
24
Round Signals
8” Green
LED
Incandescent
3675
9
69
221
Round Signals
12” Green
LED
Incandescent
3675
12
150
507
Flashing Signal
8” Red
LED
Incandescent
4380
7
69
272
Flashing Signal
12” Red
LED
Incandescent
4380
6
150
631
Flashing Signal
8” Yellow
LED
Incandescent
4380
10
69
258
Flashing Signal
12” Yellow
LED
Incandescent
4380
13
150
600
Turn Arrows
8” Yellow
LED
Incandescent
701
7
116
76
Turn Arrows
12” Yellow
LED
Incandescent
701
9
116
75
Turn Arrows
8” Green
LED
Incandescent
940
7
116
102
Turn Arrows
12” Green
LED
Incandescent
940
7
116
102
Pedestrian Sign
12” Hand/Man
LED
Incandescent
8760
8
116
946
MEASURE CODE: NR-LTG-LDTP-VO1-190101
SUNSET DATE: 1/1/2024
528
Reference table uses specific models and manufacturers specification to determine WattsEE and WattsBase. These are
recorded as having the predominant market share per Missouri Department of Transportation “Life Expectancy Evaluation and
Development of a Replacement Schedule for LED Traffic Signals”, March 2011.
529
See “LED Traffic and Pedestrian Signal-Tables.xlsx”. Note it is advised that the incremental cost data be updated with IA
specific data where available in this table.
Filed with the Iowa Utilities Board on September 23, 2020, EEP-2018-0002

Iowa Energy Efficiency Statewide Technical Reference Manual –3.4.12 Lighting Controls
Vol.3 Nonresidential Measures July 22, 2020 FINAL Page 243 of 410
3.4.12. Lighting Controls
DESCRIPTION
Occupancy sensors are devices that reduce lighting levels by turning lights on or off in response to the presence (or
absence) of people in a defined area. Associated energy savings depends on the building type, location area covered,
type of lighting and activity, and occupancy pattern.
Daylight sensor lighting controls are devices that reduce lumen output levels in response to the amount of daylight
available in an area. Such systems save energy by either shutting off lights completely or dimming when there is
adequate natural light available.
This measure relates to the installation of interior occupancy sensors, daylighting or integrated controls on an
existing lighting system (not replacement). Lighting control types covered by this measure include switch-mounted,
remote-mounted, and fixture-mounted. Daylight sensors covered by this measure include “on or off”, stepped
dimming systems, such as dual ballast (high/low HID
530
or inboard/outboard), and continuous dimming systems
based on light levels from available daylight. It does not cover automatic photo sensors, time clocks, and energy
management systems. All sensors must be hard wired and control interior lighting.
This measure was developed to be applicable to the following program types: TOS, RF. If applied to other program
types, the measure savings should be verified.
DEFINITION OF EFFICIENT EQUIPMENT
It is assumed that this measure characterization applies to only those lighting controls that regulate a minimum
average wattage greater than 45W per control for switch, fixture and remote mounted occupancy sensors, and 20W
for integrated sensors. If applicable, it must be accompanied by a daylight harvesting ballast system that meets
current CEE specifications at full light output.
531
This measure includes both hard-wired and wireless controls.
DEFINITION OF BASELINE EQUIPMENT
The baseline efficiency case assumes lighting fixtures with neither occupancy controls nor daylight control sensor.
Also, lighting is operated at normal powers levels and controlled with a manual switch.
Note that in new construction or in areas receiving major rehab (additions, alterations renovations, or repairs),
occupancy sensors are required by IECC 2012 (section C405.2.2.2) to be installed in the following locations;
classrooms, conference/meeting rooms, employee lunch and break rooms, private offices, restrooms, storage rooms
and janitorial closets, and other spaces 300 ft
2
or less enclosed by floor to ceiling height partitions. Savings should
therefore not be claimed for occupancy sensors installed in these instances.
DEEMED LIFETIME OF EFFICIENT EQUIPMENT
The expected measure life for all lighting controls is assumed to be 8 years.
532
DEEMED MEASURE COST
When available, the actual cost of the measure shall be used. When not available, the following default values are
provided:
530
Uniformed Methods Project: Methods for Determining Energy Efficiency Savings for Specific Measures: Chapter 3:
Commercial and Industrial Lighting Controls Evaluation Protocol, NREL, April 2013. Such HID fixtures typically have only one
lamp that can be operated at two different output levels by a two stage ballast; this differs from stepped dimming systems that
dim by controlling lamps powered by a single ballast.
531
Visit http://library.cee1.org/content/commercial-lighting-qualifying-products-lists
532
See file “DEER2014-EUL-table-update_2014-02-05.xlsx” or http://www.deeresources.com/
Filed with the Iowa Utilities Board on September 23, 2020, EEP-2018-0002

Iowa Energy Efficiency Statewide Technical Reference Manual –3.4.12 Lighting Controls
Vol.3 Nonresidential Measures July 22, 2020 FINAL Page 244 of 410
Lighting Control Type
Cost
533
Switch-Mounted (Wall) Occupancy Sensor
$54
Fixture-Mounted Occupancy Sensor
$67
Remote-Mounted (Ceiling) Occupancy Sensor
$105
Fixture-Mounted Daylight Sensor
$50
Remote-Mounted Daylight Sensor
$65
Integrated Occupancy Sensor
$40
Integrated Dual Occupancy & Daylight Sensor
$50
Fixture-Mounted Dual Occupancy & Daylight Sensor
$100
Remote-Mounted Dual Occupancy & Daylight Sensor
$125
LOADSHAPE
Loadshape NREL01:16 – Nonresidential Lighting (by Building Type)
Algorithm
CALCULATION OF SAVINGS
ELECTRIC ENERGY SAVINGS
534
Where:
kW
Controlled
= Total lighting load connected to the control in kilowatts. The total connected load per control
should be collected from the customer, or use the default values presented below. Savings is an
average per control or fixture.
Lighting Control Type
Default kW
controlled
535
Switch (Wall) Mounted Occupancy Sensor
0.254
Fixture-Mounted Occupancy Sensor
0.264
Remote (Ceiling) Mounted Occupancy Sensor
0.413
Fixture-Mounted Daylight Sensor
0.095
Remote-Mounted Daylight Sensor
0.239
Integrated Occupancy Sensor for LED Interior Fixtures < 10,000 Lumens
0.031
Integrated Occupancy Sensor for LED Interior Fixtures ≥ 10,000 Lumens
0.118
Integrated Dual Occupancy & Daylight Sensor for LED Interior Fixtures < 10,000 Lumens
0.031
Integrated Dual Occupancy & Daylight Sensor for LED Interior Fixtures ≥ 10,000 Lumens
0.118
Fixture-Mounted Dual Occupancy & Daylight Sensor for LED Interior Fixtures
< 10,000 Lumens
0.031
Fixture-Mounted Dual Occupancy & Daylight Sensor for LED Interior Fixtures
≥ 10,000 Lumens
0.118
Remote-Mounted Dual Occupancy & Daylight Sensor
0.239
533
Based on averaging typical prices quoted by online vendors. See 'Lighting Control Analysis_2020.xlxs'; “Cost” Sheet for more
information.
534
It is assumed an ISR of 100%
535
Occupancy Sensor controlled kw is based on Alliant Data from program years 2018-2019. Removed 2 outlying data points as
well as the Agricultural sector. See 'Lighting Control Analysis_2020.xlxs'; "Wattage_Alliant Data" sheet for details on
calculations. For the raw data, please see file 'Alliant Data_Occ Sensors and Daylighting Controls 2018-2019.xlsx'. Integrated
Dual and Daylight Sensors controlled kw is based on Efficiency Vermont data from program year 2017 for lighting controls. See
'Lighting Control Analysis_2020.xls'; " Wattage_EVT Data" sheet for details on calculations.
Filed with the Iowa Utilities Board on September 23, 2020, EEP-2018-0002

Iowa Energy Efficiency Statewide Technical Reference Manual –3.4.12 Lighting Controls
Vol.3 Nonresidential Measures July 22, 2020 FINAL Page 245 of 410
Hours = The total annual operating hours of lighting for each type of building before lighting controls.
This number should be collected from the customer. If no data is available, the deemed average
number of operating hours, by building type, should be used, as provided by Lighting Reference
Table in Section 3.4. If buidling type is unknown, use the Nonresidential Average value.
ESF = Energy Savings factor (represents the percentage reduction to the operating Hours from the
non-controlled baseline lighting system). Determined on a site-specific basis or using a default
energy saving factor of 28% for Daylighting Sensor Control Types and 24% for Occupancy Sensor
controls. For Dual Sensors, assume 24% if the additional daylighting savings is not verified, and
38% when daylighting savings is verified.
536
WHF
e
= Waste heat factor for energy to account for
cooling energy savings from more efficient lighting is provided in the Lighting Reference Table
in Section 3.4.
Heating Penalty:
If electrically heated building:
537
Where:
IFkWh = Lighting-HVAC Interation Factor for electric heating impacts; this factor represents the
increased electric space heating requirements due to the reduction of waste heat rejected by
the efficent lighting. Values are provided in the Lighting Reference Table 3.4.
SUMMER COINCIDENT PEAK DEMAND SAVINGS
Where:
WHF
d
= Waste Heat Factor for Demand to account for cooling savings from efficient lighting in
cooled buildings is provided in the Lighting Reference Table in Section 3.4
CFbaseline = Baseline Summer Peak Coincidence Factor for the lighting system without Occupancy
Sensors installed is selected from the Lighting Reference Table in Section 3.4 for each
building type. If the building type is unknown, use the Nonresidential Average value.
CF
LC
= Summer Peak Coincidence Factor the lighting system with Lighting Controls installed is
0.15 regardless of building type.
538
536
A Meta-Analysis of Energy Savings from Lighting Controls in Commercial Buildings. Lawrence Berkeley National Laboratory,
Page & Associates Inc. September 2011. Fig 7. Actual Installation values, pg 16.
537
Negative value because this is an increase in heating consumption due to the efficient lighting.
538
RLW Analytics, Coincidence Factor Study Residential and Commercial Industrial Lighting Measures, Table i -13, pg X. Spring
2007. Please note this study looks at Occupancy Sensors, however daylighting controls coincidence factor will be comparable.
For example, for a Switch (Wall) Mounted Occupancy Sensor:
ΔkWh = 0.254 * 3,065 * 0.24 * 1.06
= 198.1 kWh
For a switch (wall) mounted occupancy sensor installed in a building with electric resistance heating, the electric
heating penalty is:
ΔkWhheatingpenalty = 0.254 * 3,065 * 0.24 * (-0.24)
= -44.8 kWh
Filed with the Iowa Utilities Board on September 23, 2020, EEP-2018-0002

Iowa Energy Efficiency Statewide Technical Reference Manual –3.4.12 Lighting Controls
Vol.3 Nonresidential Measures July 22, 2020 FINAL Page 246 of 410
NATURAL GAS ENERGY SAVINGS
If gas heated building (or unknown):
Where:
IFTherms = Lighting-HVAC Integration Factor for gas heating impacts; this factor represents the
increased gas space heating requirements due to the reduction of waste heat rejected by
the efficient lighting and is provided in the Lighting Reference Table in Section 3.4 by
building type.
PEAK GAS SAVINGS
For ease of application, savings for this measure is assumed to be evenly spread across the year. The Peak Gas Savings
is therefore assumed to be:
Where:
ΔTherms = Therm impact calculated above
Heatdays = Heat season days per year
= 197
539
WATER IMPACT DESCRIPTIONS AND CALCULATION
N/A
DEEMED O&M COST ADJUSTMENT CALCULATION
N/A
MEASURE CODE: NR-LTG-LICO-V01-210101
SUNSET DATE: 1/1/2023
539
Number of days where HDD 55 >0.
For example, for a Switch (Wall) Mounted Occupancy Sensor:
ΔkW = 0.254 * 1.28 * (0.6907 – 0.15)
= 0.1758 kW
For example, for a Fixture-Mounted Daylight Sensor installed in a gas heated building:
ΔTherms = 0.095 * 3,065 * 0.28 * (-0.01)
= -0.82 Therms
For example, for a Switch (Wall) Mounted Occupancy Sensor installed in a gas heated building:
ΔPeakTherms = -1.87/197
= -0.0095 Therms
Filed with the Iowa Utilities Board on September 23, 2020, EEP-2018-0002

Iowa Energy Efficiency Statewide Technical Reference Manual –3.4.13 Daylighting Control
Vol.3 Nonresidential Measures July 22, 2020 FINAL Page 247 of 410
3.4.13. Daylighting Control
Measure consolidated with 3.4.12 in version 5.0.
Filed with the Iowa Utilities Board on September 23, 2020, EEP-2018-0002

Iowa Energy Efficiency Statewide Technical Reference Manual –3.4.14 Multi-Level Lighting Switch
Vol.3 Nonresidential Measures July 22, 2020 FINAL Page 248 of 410
3.4.14. Multi-Level Lighting Switch
DESCRIPTION
Multi-level switching allows some of the electric lighting in a space to be switched off while maintaining a reasonably
uniform distribution of light suitable for work. Multi-level switching typically use two or more separate light circuits
each of which is controlled by a different switch. These circuits can be arranged in one of three ways:
1) Switching alternate lamps in each luminaire
2) Switching alternate luminaires
3) Switching alternate rows of luminaires
Multi-level switching is used in addition to the usual separation of lighting circuits into different functional areas and
saves energy by allowing lamps to remain off when sufficient daylight is present, and by offering occupants the ability
to have lower light levels for work. Additional energy can be saved by combining multi-level switching with
occupancy sensors or photo-sensor controls.
Multi-level switching is required in the Commercial new construction building energy code (IECC 2012).
540
As such
this measure can only relate to the installation of new multi-level lighting switches on an existing lighting system.
This measure was developed to be applicable to Retrofit (RF) opportunities only.
DEFINITION OF EFFICIENT EQUIPMENT
In order for this characterization to apply, the efficient system is assumed to be a lighting system controlled by multi-
level lighting controls.
DEFINITION OF BASELINE EQUIPMENT
The baseline equipment is assumed to be an uncontrolled lighting system where all lights in a given area are on the
same circuit or all circuits come on at the same time.
DEEMED LIFETIME OF EFFICIENT EQUIPMENT
The expected measure life for all lighting controls is assumed to be 10 years.
541
DEEMED MEASURE COST
When available, the actual cost of the measure shall be used. When not available, the incremental capital cost for
this measure is assumed to be $274.
542
LOADSHAPE
Loadshape NREL01:16 – Nonresidential Lighting (by Building Type)
Algorithm
CALCULATION OF SAVINGS
ELECTRIC ENERGY SAVINGS
543
540
ASHRAE 90.1-2010, IECC 2012 Lutron “Code Compliance, Commercial Application Guide”.
541
GDS Associates, Measure Life Report “Residential and Commercial/Industrial Lighting and HVAC Measures June, 2007
542
Cost of high/low control for 320W PSMH, per fixture controlled. Goldberg et al, State of Wisconsin Public Service
Commission of Wisconsin, Focus on Energy Evaluation, Business Programs: Incremental Cost Study, KEMA, October 28, 2009.
543
Assume ISR is 100%.
Filed with the Iowa Utilities Board on September 23, 2020, EEP-2018-0002

Iowa Energy Efficiency Statewide Technical Reference Manual –3.4.14 Multi-Level Lighting Switch
Vol.3 Nonresidential Measures July 22, 2020 FINAL Page 249 of 410
Where:
KW
Controlled
= Total lighting load connected to the control in kilowatts. The total connected load
should be collected from the customer
= Actual.
Hours = The total annual operating hours of lighting for each type of building before occupancy
sensors. This number should be collected from the customer. If no data is available the
deemed average number of operating hours by building type should be used as provided
in Lighting Reference Table in Section 3.4. If unknown building type, use the
Nonresidential Average value.
ESF = Energy Savings factor (represents the percentage reduction to the operating Hours
from the non-controlled baseline lighting system). Use the default value of 31%.
544
WHF
e
= Waste heat factor for energy to account for cooling energy savings from more efficient
lighting is provided in the Lighting Reference Table in Section 3.4.
HEATING PENALTY
If electrically heated building:
545
Where:
IFkWh = Lighting-HVAC Interation Factor for electric heating impacts; this factor represents the
increased electric space heating requirements due to the reduction of waste heat rejected
by the efficent lighting. Values are provided in the Lighting Reference Table in Section 3.4.
If unknown, use the Nonresidential Average value.
SUMMER COINCIDENT PEAK DEMAND SAVINGS
544
Lawrence Berkeley National Laboratory. A Meta-Analysis of Energy Savings from Lighting Controls in Commercial Buildings.
Page & Associates Inc. 2011
http://eetd.lbl.gov/publications/meta-analysis-energy-savings-lighting-controls-commercial-buildings.
LBNL’s meta study of energy savings from lighting controls in commercial buildings bases its savings analysis on over 240 actual
field installation. The report found that savings are over-represented and do not filter for external factors such as building
orientation, location, use, weather, blinds, commissioning, changes in behavior after controls set etc. As such their value of 31%
represented the best conservative estimate of “personal tuning” energy saving factor –that includes dimmers, bi-level and wire-
less on-off switches, computer-based controls, pre-set scene selection—achieved across various building and space type, lamp
and luminaire technology available in the field today.
545
Negative value because this is an increase in heating consumption due to the efficient lighting.
For example, for multi-level lighting switches controlling a 0.200 kW connected load:
ΔkWh = 0.200 * 3,065 * 0.31 * 1.06
= 201.4 kWh
For multi-level lighting switches controlling a 0.200 kW connected load and installed in a building with electric
resistance heating, the electric heating penalty is:
ΔkWhheatingpenalty = 0.200 * 3,065 * 0.31 * (-0.24)
= -45.6 kWh
Filed with the Iowa Utilities Board on September 23, 2020, EEP-2018-0002

Iowa Energy Efficiency Statewide Technical Reference Manual –3.4.14 Multi-Level Lighting Switch
Vol.3 Nonresidential Measures July 22, 2020 FINAL Page 250 of 410
Where:
WHF
d
= Waste Heat Factor for Demand to account for cooling savings from efficient lighting in
cooled buildings is provided in the Lighting Reference Table 3.4.
CF = Summer Peak Coincidence Factor for the Multi-Level Lighting Switch installed is
assumed to be consistent with the lighting loadshapes.
546
See Lighting Reference Table in
Section 3.4 for each building type. If the building type is unknown, use the Nonresidential
Average value.
NATURAL GAS ENERGY SAVINGS
If gas heated building (or unknown):
Where:
IFTherms = Lighting-HVAC Integration Factor for gas heating impacts; this factor represents the
increased gas space heating requirements due to the reduction of waste heat rejected by
the efficient lighting and provided in the Reference Table in Section 3.4 by building type.
PEAK GAS SAVINGS
For ease of application, savings for this measure is assumed to be evenly spread across the year. The Peak Gas Savings
is therefore assumed to be:
Where:
ΔTherms = Therm impact calculated above
HeatDays = Heat season days per year
= 197
547
546
By applying the ESF and the same coincidence factor for general lighting savings we are in essence assuming that the savings
from multi-level switching are as likely during peak periods as any other time. In the absence of better information this seems
like a reasonable assumption and if anything may be on the conservative side since you might expect the peak periods to be
generally sunnier and therefore more likely to have lower light levels. It is also consistent with the control type reducing the
wattage lighting load, the same as the general lighting measures.
547
Number of days where HDD 55 >0.
For example, for multi-level lighting switches controlling a 0.200 kW connected load:
ΔkW = 0.200 * 0.31 * 1.28 * 0.6907
= 0.0548 kW
For example, for multi-level lighting switches controlling a 0.200 kW connected load and installed in a gas heated
building:
ΔTherms = 0.200 * 3,065 * 0.31 * (-0.01)
= -1.9 therms
Filed with the Iowa Utilities Board on September 23, 2020, EEP-2018-0002

Iowa Energy Efficiency Statewide Technical Reference Manual –3.4.14 Multi-Level Lighting Switch
Vol.3 Nonresidential Measures July 22, 2020 FINAL Page 251 of 410
WATER IMPACT DESCRIPTIONS AND CALCULATION
N/A
DEEMED O&M COST ADJUSTMENT CALCULATION
N/A
MEASURE CODE: NR-LTG-MLLS-V03-200101
SUNSET DATE: 1/1/2021*
* This measure is overdue for a reliability review due to no utility currently offering the measure. If a utility plans to
start using this measure again, it should be reviewed accordingly.
For example, for multi-level lighting switches controlling a 0.200 kW connected load and installed in a gas heated
building:
ΔPeakTherms = -1.9/197
= -0.0096 therms
Filed with the Iowa Utilities Board on September 23, 2020, EEP-2018-0002

Iowa Energy Efficiency Statewide Technical Reference Manual –3.5.1 Variable Frequency Drives for Process
Vol.3 Nonresidential Measures July 22, 2020 FINAL Page 252 of 410
3.5. Miscellaneous
3.5.1. Variable Frequency Drives for Process
DESCRIPTION
This measure applies to variable frequency drives (VFDs) installed on fans and centrifugal pump motors in process
applications. This characterization does not apply to positive displacement pumps. The VFD will modulate the speed
of the motor when it does not need to run at full load. Theoretically, since the power of the motor is proportional to
the cube of the speed for these types of applications, significant energy savings will result.
This measure was developed to be applicable to the following program types: TOS, RF.
If applied to other program types, the measure savings should be verified.
DEFINITION OF EFFICIENT EQUIPMENT
The VFD is applied to a motor 1-100 HP that does not have a VFD. The application must have a variable load, and
installation is to include the necessary controls as determined by a qualified engineer. Savings are based on
application of VFDs to a range of baseline load conditions including no control, inlet guide vanes, and outlet guide
vanes.
DEFINITION OF BASELINE EQUIPMENT
The time of sale baseline is a new motor installed without a VFD or other methods of control. The retrofit baseline
is an existing motor operating as is. Retrofit baselines may or may not include guide vanes, throttling valves, or
other methods of control. This information shall be collected from the customer.
Installations of new equipment with VFDs that are required by IECC 2012 as adopted by the State of Iowa are not
eligible to claim savings.
548
DEEMED LIFETIME OF EFFICIENT EQUIPMENT
The expected measure life for HVAC application is 15 years.
549
DEEMED MEASURE COST
For retrofits, actual customer-provided costs will be used when available.
For time of sale, actual costs may be used if associated baseline costs can also be estimated for the application. If
actual costs are unknown, default incremental VFD costs are listed below for 1-100 HP motors.
550
HP
Cost
1-9 HP
$2,177
10-19 HP
$3,123
20-29 HP
$4,280
30-39 HP
$5,023
548
IECC provisions for existing buildings are as follows: “Additions, alterations, renovations or repairs to an existing building,
building system or portion thereof shall conform to the provisions of this code as they relate to new construction without
requiring the unaltered portion(s) of the existing building or building system to comply with this Code”.
549
“NEEP Incremental Cost Study – Phase II Final Report, Navigant, 2013.”
550
Incremental costs are sourced from the “NEEP Incremental Cost Study – Phase II Final Report, Navigant, 2013” and adjusted
to account for regional labor cost differences between the Mid-Atlantic region and the state of Iowa. The Bureau of Labor
Statistics, Occupational Employment Statistics, State Occupational Employment and Wage Estimates from May 2018 were
leveraged in order to identify prevailing wage differences between the location of the original study and the state of Iowa.
Filed with the Iowa Utilities Board on September 23, 2020, EEP-2018-0002
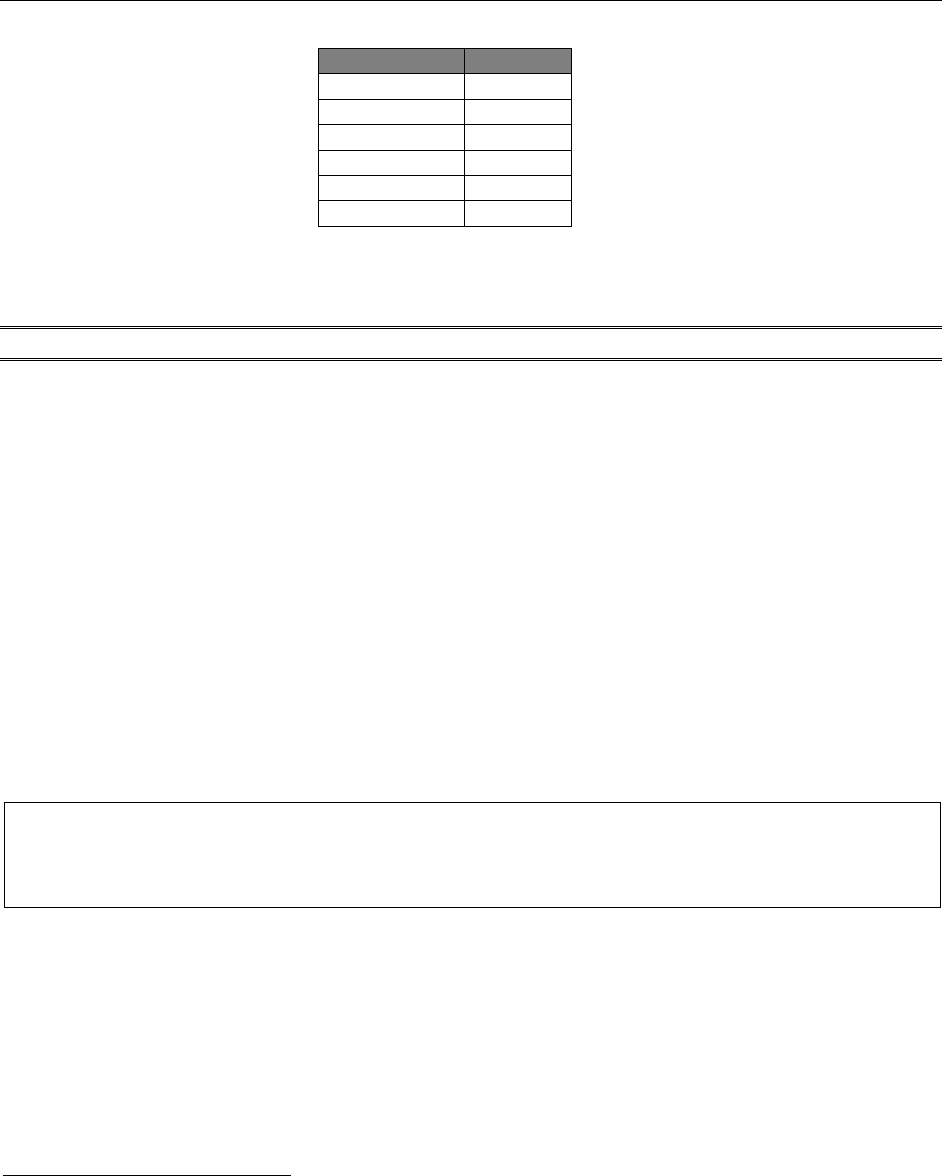
Iowa Energy Efficiency Statewide Technical Reference Manual –3.5.1 Variable Frequency Drives for Process
Vol.3 Nonresidential Measures July 22, 2020 FINAL Page 253 of 410
HP
Cost
40-49 HP
$5,766
50-59 HP
$6,591
60-69 HP
$7,550
70-79 HP
$8,173
80-89 HP
$8,796
90-100 HP
$9,576
LOADSHAPE
Custom Loadshape
Algorithm
CALCULATION OF ENERGY SAVINGS
ELECTRIC ENERGY SAVINGS
Where:
HP = Nominal horsepower of controlled motor
= Actual
HOURS = Annual operating hours of motor
= Actual
ESF = Energy Savings Factor
551
= 0.19 kWh/hp for process fans
= 0.26 kWh/hp for process centrifugal pumps
SUMMER COINCIDENT PEAK DEMAND SAVINGS
552
Where:
HP = Nominal horsepower of controlled motor
DSF = Summer Coincident Peak Demand Savings Factor
553
= 0.16 kW/hp for process fans
551
Energy savings factors derived from analysis of 16 MEC custom VFD projects. See ‘Custom Process VFD Savings Factor_2019-
04-03.xlsx’.
552
Coincident demand savings for variable frequency drives for process pumps and motors are based on claimed coincident
peak demand savings from 14 MEC custom projects. If a process in which the installed VFD is known to occur off peak,
coincident demand savings will be zero and should be accounted for that appropriately.
553
Demand savings factors derived from analysis of 14 MEC custom VFD projects. See ‘Custom Process VFD Savings
Factor_2019-04-03.xlsx’
For example, a 50-horsepower VFD operating for 2386 hours annually driving a process fan would save:
ΔkWh = 50 * 2386 * 0.19
= 22,667 kWh
Filed with the Iowa Utilities Board on September 23, 2020, EEP-2018-0002

Iowa Energy Efficiency Statewide Technical Reference Manual –3.5.1 Variable Frequency Drives for Process
Vol.3 Nonresidential Measures July 22, 2020 FINAL Page 254 of 410
= 0.26 kW/hp for process centrifugal pumps
NATURAL GAS SAVINGS
N/A
PEAK GAS SAVINGS
N/A
WATER IMPACT DESCRIPTIONS AND CALCULATION
N/A
DEEMED O&M COST ADJUSTMENT CALCULATION
N/A
MEASURE CODE: NR-MSC-VFDP-V03-200101
SUNSET DATE: 1/1/2023
Filed with the Iowa Utilities Board on September 23, 2020, EEP-2018-0002

Iowa Energy Efficiency Statewide Technical Reference Manual –3.5.2 Clothes Washer
Vol.3 Nonresidential Measures July 22, 2020 FINAL Page 255 of 410
3.5.2. Clothes Washer
DESCRIPTION
This measure relates to the installation of a commercial grade clothes washer meeting the ENERGY STAR minimum
qualifications. Note it is assumed the DHW and dryer fuels of the installations are known.
This measure was developed to be applicable to the following program types: TOS, NC.
If applied to other program types, the measure savings should be verified.
DEFINITION OF EFFICIENT EQUIPMENT
The Commercial grade Clothes washer must meet the ENERGY STAR minimum qualifications (provided in the table
below), as required by the program.
DEFINITION OF BASELINE EQUIPMENT
The baseline condition is a commercial grade clothes washer meeting the minimum federal baseline as of January
2018.
554
Efficiency Level
Top loading
Front Loading
Baseline
Federal Standard
≥1.35 MEF
J2
,
≤8.8 IWF
≥2.00 MEF
J2
,
≤4.1 IWF
Efficient
ENERGY STAR
≥2.2 MEF
J2
, ≤4.0 IWF
The Modified Energy Factor (MEF
J2
) includes unit operation, water heating, and drying energy use, with the higher
the value the more efficient the unit; "The quotient of the capacity of the clothes container, divided by the total
clothes washer energy consumption per cycle, with such energy consumption expressed as the sum of the machine
electrical energy consumption, the hot water energy consumption, and the energy required for removal of the
remaining moisture in the wash load.”
The Integrated Water Factor (IWF) indicates the total water consumption of the unit, with the lower the value the
less water required; “The quotient of the total weighted per-cycle water consumption for all wash cycles, divided by
the capacity of the clothes washer.”
555
DEEMED LIFETIME OF EFFICIENT EQUIPMENT
The expected measure life is assumed to be 11 years.
556
DEEMED MEASURE COST
The incremental cost is assumed to be $190.
557
LOADSHAPE
Loadshape RE14 - Residential Clothes Washer
558
Loadshape G01 - Flat (gas)
554
See Federal Standard 10 CFR 431.156.
555
Definitions provided on the Energy star website.
556
Appliance Magazine, January 2011 as referenced in ENERGY STAR Commercial Clothes Washer Calculator.
557
Based on Industry Data 2015 as referenced in ENERGY STAR Commercial Clothes Washer Calculator.
558
The Residential Clothes Washer loadshape is considered a reasonable proxy for commercial applications – in the absence of
any other empirical basis.
Filed with the Iowa Utilities Board on September 23, 2020, EEP-2018-0002

Iowa Energy Efficiency Statewide Technical Reference Manual –3.5.2 Clothes Washer
Vol.3 Nonresidential Measures July 22, 2020 FINAL Page 256 of 410
Algorithm
CALCULATION OF SAVINGS
ELECTRIC ENERGY SAVINGS
Where:
Capacity = Clothes Washer capacity (cubic feet)
= Actual, if capacity is unknown, assume 3.3 cubic feet
559
MEFbase = Modified Energy Factor of baseline unit
Efficiency Level
MEFbase
Top loading
Front Loading
Weighted
Average
560
Federal Standard
1.35
2.0
1.5
MEFeff = Modified Energy Factor of efficient unit
= Actual, if unknown, assume average values provided below.
Efficiency Level
MEFeff
Top loading
Front Loading
Weighted
Average
ENERGY STAR
2.2
Ncycles = Number of Cycles per year
= 2190
561
%CW = Percentage of total energy consumption for Clothes Washer operation (different for
baseline and efficient unit – see table below)
%DHW = Percentage of total energy consumption used for water heating (different for
baseline and efficient unit – see table below)
559
Based on the average clothes washer volume of all units that pass the Federal Standard on the CEC database of commercial
Clothes Washer products (accessed on 04/27/2018).
560
Weighted average MEF of Federal Standard rating for Front Loading and Top Loading units. Baseline weighting is based
upon the relative top v front loading percentage of available non-ENERGY STAR commercial product in the CEC database
(accessed 04/27/2018) and ENERGY STAR weighting is based on eligible products as of 04/27/2018. The relative weightings are
as follows, see more information in “Commercial Clothes Washer Analysis_v2.xlsx”:
Efficiency Level
Front
Top
Baseline
28%
72%
ENERGY STAR
100%
0%
561
Based on DOE Technical Support Document, 2009; Chapter 8 Life-Cycle Cost and Payback Period Analysis, p 8-15.
Filed with the Iowa Utilities Board on September 23, 2020, EEP-2018-0002
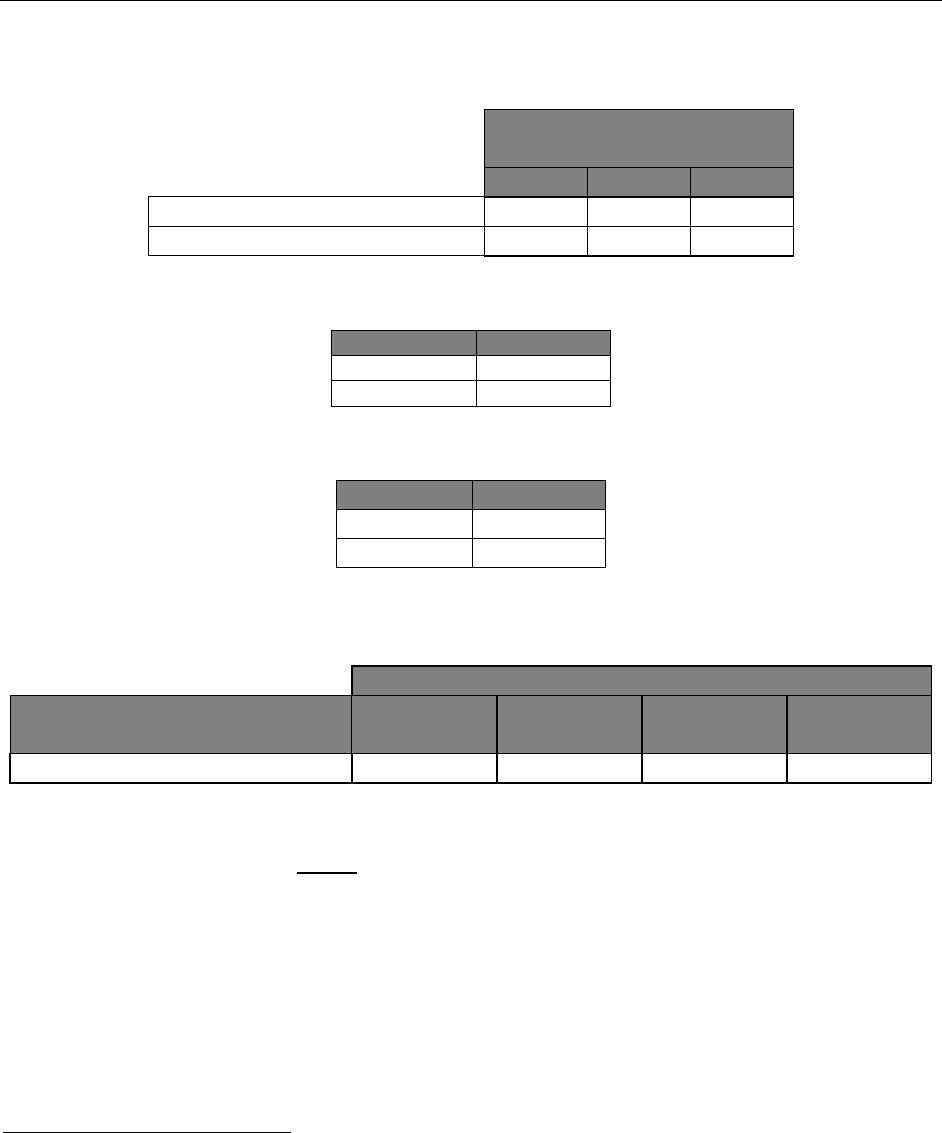
Iowa Energy Efficiency Statewide Technical Reference Manual –3.5.2 Clothes Washer
Vol.3 Nonresidential Measures July 22, 2020 FINAL Page 257 of 410
%Dryer = Percentage of total energy consumption for dryer operation (different for baseline and
efficient unit – see table below)
Percentage of Total Energy
Consumption
562
%CW
%DHW
%Dryer
Federal Standard
7.0%
28.1%
64.9%
ENERGY STAR
3.9%
15.5%
80.6%
%Electric
DHW
= Percentage of DHW savings assumed to be electric
DHW fuel
%Electric
DHW
Electric
100%
Natural Gas
0%
%Electric
Dryer
= Percentage of dryer savings assumed to be electric
Dryer fuel
%Electric
Dryer
Electric
100%
Natural Gas
0%
Using the default assumptions provided above, the prescriptive savings for each configuration are presented
below:
563
ΔkWH
Efficiency Level
Electric DHW
Electric Dryer
Gas DHW
Electric Dryer
Electric DHW
Gas Dryer
Gas DHW
Gas Dryer
ENERGY STAR
1,421.9
610.9
1,013.8
202.8
SUMMER COINCIDENT PEAK DEMAND SAVINGS
Where:
ΔkWh = Energy Savings as calculated above
Hours = Assumed Run hours of Clothes Washer
= 1643 hours
564
CF = Summer Peak Coincidence Factor for measure
562
The percentage of total energy consumption that is used for the machine, heating the hot water, or by the dryer is different
depending on the efficiency of the unit. Values are based on a data provided in the ENERGY STAR Calculator for Commercial
Clothes Washers as provided in the IPL Non-Residential Prescriptive Program workbook (no longer available online).
563
Note that the baseline savings is based on the weighted average baseline MEF (as opposed to assuming Front baseline for
Front efficient unit and Top baseline for Top efficient unit). The reasoning is that the support of the program of more efficient
units (which are predominately front loading) will result in some participants switching from planned purchase of a top loader
to a front loader.
564
Assuming an average load runs for an estimated 45 minutes.
Filed with the Iowa Utilities Board on September 23, 2020, EEP-2018-0002

Iowa Energy Efficiency Statewide Technical Reference Manual –3.5.2 Clothes Washer
Vol.3 Nonresidential Measures July 22, 2020 FINAL Page 258 of 410
= 0.5
565
Using the default assumptions provided above, the prescriptive savings for each configuration are presented below:
ΔkW
Efficiency Level
Electric DHW
Electric Dryer
Gas DHW
Electric Dryer
Electric DHW
Gas Dryer
Gas DHW
Gas Dryer
ENERGY STAR
0.325
0.139
0.231
0.046
NATURAL GAS SAVINGS
Where:
%Gas
DHW
= Percentage of DHW savings assumed to be Natural Gas
DHW fuel
%Gas
DHW
Electric
0%
Natural Gas
100%
R_eff = Recovery efficiency factor
= 1.26
566
%Gas
Dryer
= Percentage of dryer savings assumed to be Natural Gas
Dryer fuel
%Gas
Dryer
Electric
0%
Natural Gas
100%
Therm_convert = Conversion factor from kWh to Therm
= 0.03412
Other factors as defined above.
Using the default assumptions provided above, the prescriptive savings for each configuration are presented below:
ΔTherms
Efficiency Level
Electric DHW
Electric Dryer
Gas DHW
Electric Dryer
Electric DHW
Gas Dryer
Gas DHW
Gas Dryer
ENERGY STAR
0.0
34.9
13.9
48.8
565
In the absence of any commercial specific data, this is estimated at 50%.
566
To account for the different efficiency of electric and Natural Gas hot water heaters (gas water heater: recovery efficiencies
ranging from 0.74 to 0.85 (0.78 used), and electric water heater with 0.98 recovery efficiency
(http://www.energystar.gov/ia/partners/bldrs_lenders_raters/downloads/Waste_Water_Heat_Recovery_Guidelines.pdf ).
Therefore a factor of 0.98/0.78 (1.26) is applied.
Filed with the Iowa Utilities Board on September 23, 2020, EEP-2018-0002

Iowa Energy Efficiency Statewide Technical Reference Manual –3.5.2 Clothes Washer
Vol.3 Nonresidential Measures July 22, 2020 FINAL Page 259 of 410
PEAK GAS SAVINGS
Savings for this measure is assumed to be evenly spread across the year. The Peak Gas Savings is therefore assumed
to be:
Where:
ΔTherms = Therm impact calculated above
365 = Days per year
Using the default assumptions provided above, the prescriptive savings for each configuration are presented below:
ΔPeakTherms
Efficiency Level
Electric DHW
Electric Dryer
Gas DHW
Electric Dryer
Electric DHW
Gas Dryer
Gas DHW
Gas Dryer
ENERGY STAR
0.0000
0.096
0.038
0.134
WATER IMPACT DESCRIPTIONS AND CALCULATION
∆
Where:
IWFbase = Water Factor of baseline clothes washer
Efficiency Level
IWFbase
Top loading
Front Loading
Weighted
Average
567
Federal Standard
8.8
4.1
7.5
IWFeff = Water Factor of efficient clothes washer
= Actual - If unknown assume average values provided below
Using the default assumptions provided above, the prescriptive water savings for each efficiency level are presented
below:
IWF
∆Water
(gallons per
year)
Efficiency Level
Top
Loaders
Front
Loaders
Weighted
Average
Weighted
Average
Federal Standard
8.8
4.1
7.5
n/a
ENERGY STAR
4.0
21,393
567
Weighted average MEF of Federal Standard rating for Front Loading and Top Loading units. Baseline weighting is based
upon the relative top v front loading percentage of available non-ENERGY STAR commercial product in the CEC database
(accessed 04/27/2018) and ENERGY STAR weighting is based on eligible products as of 04/27/2018. The relative weightings are
as follows, see more information in “Commercial Clothes Washer Analysis_v2.xlsx”:
Efficiency Level
Front
Top
Baseline
28%
72%
ENERGY STAR
100%
0%
Filed with the Iowa Utilities Board on September 23, 2020, EEP-2018-0002

Iowa Energy Efficiency Statewide Technical Reference Manual –3.5.2 Clothes Washer
Vol.3 Nonresidential Measures July 22, 2020 FINAL Page 260 of 410
DEEMED O&M COST ADJUSTMENT CALCULATION
N/A
MEASURE CODE: NR-MSC-CLWA-V02-190101
SUNSET DATE: 1/1/2022*
* This measure has a pending code and standard change; however, no utility currently offers the measure. Once the
new standard becomes effective the measure will become inactive unless a utility plans to start offering the measure
again.
Filed with the Iowa Utilities Board on September 23, 2020, EEP-2018-0002

Iowa Energy Efficiency Statewide Technical Reference Manual –3.5.3 Motors
Vol.3 Nonresidential Measures July 22, 2020 FINAL Page 261 of 410
3.5.3. Motors
DESCRIPTION
Electric motor systems consume large amounts of electrical energy and can provide an opportunity for significant
energy savings. Energy consumption represents more than 97% of the total motor operating costs over the motors
lifetime, and when replacing a working motor or a near-failure motor the energy efficiency of electrical motors can
be improved by 20-30% on average, resulting in significant energy and cost savings.
568
This measure applies to one-for-one replacement of old failed/near failure 1-350 horsepower
569
constant speed and
uniformly loaded motors with new energy efficiency motors of the same rated horsepower that exceed NEMA
Premium Efficiency levels.
This measure characterizes HVAC fan or pumping motors and was developed to be applicable to the following
program types: Time of Sale (TOS)
DEFINITION OF EFFICIENT EQUIPMENT
The new motor efficiency must meet program standards which exceed NEMA Premium Efficiency as listed and
recognized by CEE to meet their criteria for energy efficiency and be compliant with DOE’s amended energy
conservation standards effective June 1, 2016.
DEFINITION OF BASELINE EQUIPMENT
The baseline is a motor meeting Federal minimum efficiency requirements.
DEEMED LIFETIME OF EFFICIENT EQUIPMENT
The expected measure life is assumed to be 16 years.
570
DEEMED MEASURE COST
Actual costs may be used if associated baseline costs can also be estimated for the application. If actual costs are
unknown, incremental costs, regardless of motor type are based on nominal horsepower per the following
relationship:
571
For motors up to and equal to 300 horsepower: Cost = $37.98 * (HP rating) + $433.78
For motors larger than 300 horsepower: Cost = $142.48 * (HP rating) - $31,601.70
LOADSHAPE
Loadshape NRE03 – Non-Residential Industrial Motor
568
Premium efficiency standards and sound motor management strategies as outlined by the Motor Decisions MatterSM
(MDM) lead to reduced energy costs and increase productivity. See reference file “Motor Planning Kit.”
569
For 1-200 horsepower general purpose motors 1200 rpm, 1800 rpm, 3600 rpm, IESA is equivalent to NEMA Premium®. For
200-350 horsepower general purpose motors 1200 rpm, 1800 rpm, 3600 rpm, federal requirements are equivalent to NEMAL
Premium specifications. See NEMA MG1-2011 Table 12-12 for more information http://www.nema.org.
570
Goldberg et al, State of Wisconsin Public Service Commission of Wisconsin, Focus on Energy Evaluation, Business Programs:
Measure Life Study, KEMA, August 25, 2009.
571
Based on the dataset provided in Appendix C of the Minnesota TRM.
Filed with the Iowa Utilities Board on September 23, 2020, EEP-2018-0002

Iowa Energy Efficiency Statewide Technical Reference Manual –3.5.3 Motors
Vol.3 Nonresidential Measures July 22, 2020 FINAL Page 262 of 410
Algorithm
CALCULATION OF SAVINGS
ELECTRIC ENERGY SAVINGS
572
Where:
= Conversion factor for HP to kWh
= Nominal horsepower of controlled motor
= Actual
= Load Factor; Motor Load at Fan/Pump Design CFM (Default = 75%)
573
= Federal baseline nominal/nameplate motor efficiency as shown in tables below for
Open Drip Proof (ODP) and Totally Enclosed Fan Cooled (TEFC), based on motor design
type.
Nominal Full-Load Efficiencies of NEMA Design A, NEMA Design B and IEC Design N Motors (Excluding Fire Pump
Electric Motors) at 60 Hz:
Motor
horsepower/standard
kilowatt equivalent
Nominal full-load efficiency (%)
2 Pole
4 Pole
6 Pole
8 Pole
Enclosed
Open
Enclosed
Open
Enclosed
Open
Enclosed
Open
1/.75
77
77
85.5
85.5
82.5
82.5
75.5
75.5
1.5/1.1
84
84
86.5
86.5
87.5
86.5
78.5
77
2/1.5
85.5
85.5
86.5
86.5
88.5
87.5
84
86.5
3/2.2
86.5
85.5
89.5
89.5
89.5
88.5
85.5
87.5
5/3.7
88.5
86.5
89.5
89.5
89.5
89.5
86.5
88.5
7.5/5.5
89.5
88.5
91.7
91
91
90.2
86.5
89.5
10/7.5
90.2
89.5
91.7
91.7
91
91.7
89.5
90.2
15/11
91
90.2
92.4
93
91.7
91.7
89.5
90.2
20/15
91
91
93
93
91.7
92.4
90.2
91
25/18.5
91.7
91.7
93.6
93.6
93
93
90.2
91
30/22
91.7
91.7
93.6
94.1
93
93.6
91.7
91.7
40/30
92.4
92.4
94.1
94.1
94.1
94.1
91.7
91.7
50/37
93
93
94.5
94.5
94.1
94.1
92.4
92.4
60/45
93.6
93.6
95
95
94.5
94.5
92.4
93
75/55
93.6
93.6
95.4
95
94.5
94.5
93.6
94.1
100/75
94.1
93.6
95.4
95.4
95
95
93.6
94.1
572
Prevailing energy Savings Methodology for motor measures as highlighted by SEEAction Scoping Study to Evaluate Feasibility
of national Databases for EM&V Documents and Measure Savings, June 2011.
573
Basic load measurements should be collected as motors do not run at the same load factor. Motor efficiency curves typically
result in motors being most efficient at approximately 75% of the rated load. The default value is therefore assumed to be 0.75.
Determining Electric Motor Load and Efficiency, US DOE Motor Challenge, a program of the US Department of Energy,
www1.eere.energy.gov/industry/bestpractices/pdfs/10097517.pdf.
Filed with the Iowa Utilities Board on September 23, 2020, EEP-2018-0002

Iowa Energy Efficiency Statewide Technical Reference Manual –3.5.3 Motors
Vol.3 Nonresidential Measures July 22, 2020 FINAL Page 263 of 410
Motor
horsepower/standard
kilowatt equivalent
Nominal full-load efficiency (%)
2 Pole
4 Pole
6 Pole
8 Pole
Enclosed
Open
Enclosed
Open
Enclosed
Open
Enclosed
Open
125/90
95
94.1
95.4
95.4
95
95
94.1
94.1
150/110
95
94.1
95.8
95.8
95.8
95.4
94.1
94.1
200/150
95.4
95
96.2
95.8
95.8
95.4
94.5
94.1
250/186
95.8
95
96.2
95.8
95.8
95.8
95
95
300/224
95.8
95.4
96.2
95.8
95.8
95.8
350/261
95.8
95.4
96.2
95.8
95.8
95.8
400/298
95.8
95.8
96.2
95.8
450/336
95.8
96.2
96.2
96.2
500/373
95.8
96.2
96.2
96.2
Nominal Full-Load Efficiencies of NEMA Design C and IEC Design H Motors at 60 Hz:
Motor
horsepower/standard
kilowatt equivalent
Nominal full-load efficiency (%)
4 Pole
6 Pole
8 Pole
Enclosed
Open
Enclosed
Open
Enclosed
Open
1/.75
85.5
85.5
82.5
82.5
75.5
75.5
1.5/1.1
86.5
86.5
87.5
86.5
78.5
77
2/1.5
86.5
86.5
88.5
87.5
84
86.5
3/2.2
89.5
89.5
89.5
88.5
85.5
87.5
5/3.7
89.5
89.5
89.5
89.5
86.5
88.5
7.5/5.5
91.7
91
91
90.2
86.5
89.5
10/7.5
91.7
91.7
91
91.7
89.5
90.2
15/11
92.4
93
91.7
91.7
89.5
90.2
20/15
93
93
91.7
92.4
90.2
91
25/18.5
93.6
93.6
93
93
90.2
91
30/22
93.6
94.1
93
93.6
91.7
91.7
40/30
94.1
94.1
94.1
94.1
91.7
91.7
50/37
94.5
94.5
94.1
94.1
92.4
92.4
60/45
95
95
94.5
94.5
92.4
93
75/55
95.4
95
94.5
94.5
93.6
94.1
100/75
95.4
95.4
95
95
93.6
94.1
125/90
95.4
95.4
95
95
94.1
94.1
150/110
95.8
95.8
95.8
95.4
94.1
94.1
200/150
96.2
95.8
95.8
95.4
94.5
94.1
=Efficient motor nominal/nameplate motor efficiency
= Actual
Hours = Hours for HVAC motors are found in table below:
574
Building Type
Hot Water Pump
m Motor Hours
Chilled Water Pump
Motor Hours
Fan Motor Run
Hours
Convenience*
3628
2690
4630
574
All values taken from IA VFD Fan and pump measure including building type to ensure consistency across IA TRM. Building
types denoted with an asterisk indicate values were referenced from the ComEd TRM June 1, 2010 page 139. As we gather
more information on prevalent types of participating motors, VEIC will add additional columns
Filed with the Iowa Utilities Board on September 23, 2020, EEP-2018-0002

Iowa Energy Efficiency Statewide Technical Reference Manual –3.5.3 Motors
Vol.3 Nonresidential Measures July 22, 2020 FINAL Page 264 of 410
Building Type
Hot Water Pump
m Motor Hours
Chilled Water Pump
Motor Hours
Fan Motor Run
Hours
Education
6367
2796
3544
Grocery
6499
2725
8743
Health
8720
4770
3478
Hospital
8289
8760
4570
Industrial*
3977
3080
2850
Lodging
5500
7909
3909
Multifamily
5382
5084
8760
Office - Large
5316
4596
2662
Office - Small
1952
2138
7667
Religious*
4763
2223
2412
Restaurant
3027
2719
7300
Retail – Large*
4218
2405
4065
Retail - Small
3029
2266
7410
Warehouse*
4100
1788
2920
Nonresidential (average)
3659
2182
4978
For all non HVAC applications, hour of use are found below:
575
Unit HP Range
Mean Annual HOU
1-5
2,745
6-20
3,391
21-50
4,067
51-100
5,329
101-200
5,200
201-350
6,132
SUMMER COINCIDENT PEAK DEMAND SAVINGS
Where:
= 79.3%
576
All other variables provided above.
575
United States Industrial Electric Motor Systems Mark Opportunities Assessment (p. 66), December 2012:
http://www1.eere.energy.gov/manufacturing/tech_assistance/pdfs/mtrmkt.pdf
576
Industrial Motor CF in IA_Electric Loadshapes – Working Draft.xls
For example, a 5-horsepower, enclosed, 4-pole, design type A motor on a chilled water pump with a load factor
of 0.8 and an efficiency of 90.5% in a hospital would save:
ΔkWh = 0.746 * 5 * (0.8/.895 – 0.8/0.905) * 8760
= 322.7 kWh
Filed with the Iowa Utilities Board on September 23, 2020, EEP-2018-0002

Iowa Energy Efficiency Statewide Technical Reference Manual –3.5.3 Motors
Vol.3 Nonresidential Measures July 22, 2020 FINAL Page 265 of 410
NATURAL GAS ENERGY SAVINGS
There are no expected fossil fuel impacts for this measure.
577
PEAK GAS SAVINGS
N/A
WATER IMPACT DESCRIPTIONS AND CALCULATION
N/A
DEEMED O&M COST ADJUSTMENT CALCULATION
N/A
MEASURE CODE: NR-MCS-MOTR-V03-200101
SUNSET DATE: 1/1/2022
577
Consider updating measure to include heating and cooling savings in future revisions.
For example, a 5-horsepower, enclosed, 4-pole, design type A motor on a chilled water pump with a load factor
of 0.8 and an efficiency of 90.5% in a hospital would save:
ΔkW = 0.746 * 5 * (0.8/.895 – 0.8/0.905) * 0.793
= 0.029 kW
Filed with the Iowa Utilities Board on September 23, 2020, EEP-2018-0002

Iowa Energy Efficiency Statewide Technical Reference Manual –3.5.4 Forklift Battery Charger
Vol.3 Nonresidential Measures July 22, 2020 FINAL Page 266 of 410
3.5.4. Forklift Battery Charger
DESCRIPTION
This measure applies to industrial high frequency battery chargers, used for industrial equipment such as fork lifts,
replacing existing SCR (silicon controlled rectifier) or ferroresonant charging technology. High frequency battery
chargers have a greater system efficiency.
This measure was developed to be applicable to the following program types: TOS, NC. If applied to other program
types, the measure savings should be verified.
DEFINITION OF EFFICIENT EQUIPMENT
High frequency battery charger systems with minimum Power Conversion Efficiency of 90% and a minimum 8-hour
shift operation five days per week.
DEFINITION OF BASELINE EQUIPMENT
SCR or ferroresonant battery charger systems with minimum 8-hour shift operation five days per week.
DEEMED LIFETIME OF EFFICIENT EQUIPMENT
15 years
578
DEEMED MEASURE COST
The deemed incremental measure cost is $400.
579
LOADSHAPE
Loadshape NRE13 - Indust. 1-shift (8/5)
Loadshape NRE14 - Indust. 2-shift (16/5)
Loadshape NRE15 - Indust. 3-shift (24/5)
Loadshape NRE16 - Indust. 4-shift (24/7)
Algorithm
ELECTRIC ENERGY SAVINGS
∆kWh = (CAP * DOD) * CHG * (CR
B
/ PC
B
- CR
EE
/ PC
EE
) * WHFe
Where:
CAP = Capacity of Battery
= Use actual battery capacity, otherwise use a default value of 35 kWh.
580
DOD = Depth of Discharge
= Use actual depth of discharge, otherwise use a default value of 80%.
581
578
Suzanne Foster Porter et al., “Analysis of Standards Options for Battery Charger Systems”, (PG&E, 2010), 45
579
Suzanne Foster Porter et al., “Analysis of Standards Options for Battery Charger Systems”, (PG&E, 2010), 42
580
Jacob V. Renquist, Brian Dickman, and Thomas H. Bradley, ”Economic Comparison of fuel cell powered forklifts to battery
powered forklifts”, International Journal of Hydrogen Energy Volume 37, Issue 17, (2012): 2.
581
Ryan Matley, “Measuring Energy Efficiency Improvements in Industrial Battery Chargers”, (ESL-IE-09-05-32, Energy
Filed with the Iowa Utilities Board on September 23, 2020, EEP-2018-0002

Iowa Energy Efficiency Statewide Technical Reference Manual –3.5.4 Forklift Battery Charger
Vol.3 Nonresidential Measures July 22, 2020 FINAL Page 267 of 410
CHG = Number of Charges per year
= Use actual number of annual charges, if unknown use values below based on the type of
operations:
582
Standard Operations
Number of Charges
per year
1-shift (8 hrs/day – 5 days/week)
520
2-shift (16 hrs/day – 5 days/week)
1040
3-shift (24 hrs/day – 5 days/week)
1560
4-shift (24 hrs/day – 7 days/week)
2184
CR
B
= Baseline Charge Return Factor
= 1.2485
583
PC
B
= Baseline Power Conversion Efficiency
= 0.84
584
CR
EE
= Efficient Charge Return Factor
= 1.107
585
PC
EE
= Efficient Power Conversion Efficiency
= 0.89
586
WHFe = Waste heat factor for energy to account for cooling energy savings from reduced waste heat
from the battery charger
= 1.09 for cooled warehouse, 1.0 for uncooled warehouse and 1.29 for refrigerated buildings.
587
Default savings using defaults provided above are provided below:
Standard Operations
ΔkWh
Cooled warehouse
Uncooled
warehouse
Refrigerated
warehouse
1-shift (8 hrs/day – 5 days/week)
3,848.4
3,530.6
4,554.5
2-shift (16 hrs/day – 5 days/week)
7,696.8
7,061.3
9,109.1
3-shift (24 hrs/day – 5 days/week)
11,545.2
10,591.9
13,663.6
4-shift (24 hrs/day – 7 days/week)
16,163.3
14,828.7
19,129.0
Technology Conference, New Orleans, LA, May 12-15, 2009), 4.
582
Number of charges is derived from the following reference and adjusted to the hours and days of the different types of shift
operations. These values are based on an estimated 2-charge per 8-hour workday. See reference file: Ryan Matley, “Measuring
Energy Efficiency Improvements in Industrial Battery Chargers”, (ESL-IE-09-05-32, Energy Technology Conference, New Orleans,
LA, May 12-15, 2009), 4.
583
Ryan Matley, “Measuring Energy Efficiency Improvements in Industrial Battery Chargers”, (ESL-IE-09-05-32, Energy Technology
Conference, New Orleans, LA, May 12-15, 2009), 4 (average of SCR and Ferroresonant).
584
Ibid.
585
Ibid.
586
Ibid.
587
WHFs are consistent with those provided in the lighting section. This assumes similar patterns of operation for lighting and
battery chargers.
Filed with the Iowa Utilities Board on September 23, 2020, EEP-2018-0002

Iowa Energy Efficiency Statewide Technical Reference Manual –3.5.4 Forklift Battery Charger
Vol.3 Nonresidential Measures July 22, 2020 FINAL Page 268 of 410
Heating Penalty:
If electrically heated building:
588
Where:
IFkWh = Heating Interation Factor for electric heating impacts; this factor represents the
increased electric space heating requirements due to the reduction of waste heat rejected
by the battery charger
= 0.44 if resistence heat, 0.19 if heat pump, 0 if unheated.
589
SUMMER COINCIDENT PEAK DEMAND SAVINGS
∆kW = (PF
B
/PC
B
- PF
EE
/PC
EE
) * Volts
DC
* Amps
DC
/ 1000 * WHFd * CF
Where:
PF
B
= Power factor of baseline charger
= 0.9095
590
PF
EE
= Power factor of high frequency charger
= 0.9370
591
Volts
DC
= Actual DC rated voltage of charger (assumed baseline charger is replaced with same rated high
frequency unit)
= Use actual battery DC voltage rating, otherwise use a default value of 48 volts.
592
Amps
DC
= Actual DC rated amperage of charger (assumed baseline charger is replaced with same rated
high frequency unit)
= Use actual battery DC ampere rating, otherwise use a default value of 81 amps.
593
1,000 = watt to kilowatt conversion factor
WHFd = Waste heat factor for demand to account for cooling energy savings from reduced waste heat
from the battery charger
= 1.43 for cooled warehouse, 1.0 for uncooled warehouse and 1.29 for refrigerated buildings.
594
CF = Summer Coincident Peak Factor for this measure
= 0.0 (for 1- and 2-shift operation)
595
588
Results in a negative value because this is an increase in heating consumption due to the less waste heat.
589
WHFs are consistent with those provided in the lighting section. This assumes similar patterns of operation for lighting and
battery chargers.
590
Ibid.
591
Ibid.
592
Voltage rating based on the assumption of 35kWh battery with a normalized average amp-hour capacity of 760 Ah charged
over a 7.5 hour charge cycle. Pacific Gas & Electric, “Emerging Technologies Program Application Assessment Report #0808”,
Industrial Battery Charger Energy Savings Opportunities. May 29, 2009. Page 8, Table 3.
593
Ampere rating based on the assumption of 35kWh battery with a normalized average amp-hour capacity of 760 Ah charged
over a 7.5 hour charge cycle. Pacific Gas & Electric, “Emerging Technologies Program Application Assessment Report #0808”,
Industrial Battery Charger Energy Savings Opportunities. May 29, 2009. Page 8, Table 3.
594
WHFs are consistent with those provided in the lighting section. This assumes similar patterns of operation for lighting and
battery chargers.
595
Emerging Technologies Program Application Assessment Report #0808, Industrial Battery Charger Energy Savings
Filed with the Iowa Utilities Board on September 23, 2020, EEP-2018-0002

Iowa Energy Efficiency Statewide Technical Reference Manual –3.5.4 Forklift Battery Charger
Vol.3 Nonresidential Measures July 22, 2020 FINAL Page 269 of 410
= 1.0 (for 3- and 4-shift operation)
596
Other variables as provided above.
Default savings using defaults provided above are provided below:
Standard Operations
∆kW
Cooled warehouse
Uncooled
warehouse
Refrigerated
warehouse
1-shift (8 hrs/day – 5 days/week)
0
0
0
2-shift (16 hrs/day – 5 days/week)
0
0
0
3-shift (24 hrs/day – 5 days/week)
0.1664
0.1165
0.1501
4-shift (24 hrs/day – 7 days/week)
0.1664
0.1165
0.1501
NATURAL GAS SAVINGS
Heating Penalty if fossil fuel heated building (or if heating fuel is unknown):
597
Where:
IFTherms = Heating Interation Factor for gas heating impacts; this factor represents the increased
gas space heating requirements due to the reduction of waste heat rejected by the
battery charger
= 0.019 if gas heated, 0 if unheated
598
PEAK GAS SAVINGS
For ease of application, savings for this measure is assumed to be evenly spread across the year. The Peak Gas Savings
is therefore assumed to be:
Where:
ΔTherms = Therm impact calculated above
HeatDays = Heat season days per year
= 197
599
WATER IMPACT DESCRIPTIONS AND CALCULATION
N/A
DEEMED O&M COST ADJUSTMENT CALCULATION
N/A
Opportunities, Pacific Gas & Electric. May 29, 2009.
596
Ibid.
597
Results in a negative value because this is an increase in heating consumption due to the efficient lighting.
598
WHFs are consistent with those provided in the lighting section. This assumes similar patterns of operation for lighting and
battery chargers.
599
Number of days where HDD 55 >0.
Filed with the Iowa Utilities Board on September 23, 2020, EEP-2018-0002

Iowa Energy Efficiency Statewide Technical Reference Manual –3.5.4 Forklift Battery Charger
Vol.3 Nonresidential Measures July 22, 2020 FINAL Page 270 of 410
MEASURE CODE: NR-MSC-BACH-V01-180101
SUNSET DATE: 1/1/2022
Filed with the Iowa Utilities Board on September 23, 2020, EEP-2018-0002

Iowa Energy Efficiency Statewide Technical Reference Manual –3.6.1 Dishwasher
Vol.3 Nonresidential Measures July 22, 2020 FINAL Page 271 of 410
3.6. Food Service
3.6.1. Dishwasher
DESCRIPTION
This measure applies to ENERGY STAR high and low temperature under counter, stationary single tank door type,
single tank conveyor, and multi tank conveyor dishwashers, as well as to high temperature pot, pan, and utensil
dishwashers installed in a commercial kitchen. ENERGY STAR commercial dishwashers use approximately 40% less
energy and water than standard models.
This measure was developed to be applicable to the following program types: TOS.
DEFINITION OF EFFICIENT EQUIPMENT
To qualify for this measure the installed equipment must be a new ENERGY STAR certified dishwasher meeting idle
energy rate (kW) and water consumption (gallons/rack) limits, as determined by both machine type and sanitation
approach (chemical/low temperature versus high temperature).
ENERGY STAR Requirements (Version 2.0, Effective February 1, 2013)
Dishwasher Type
High Temp Efficiency Requirements
Low Temp Efficiency Requirements
Idle Energy Rate
Water Consumption
Idle Energy Rate
Water Consumption
Under Counter
≤ 0.50 kW
≤ 0.86 GPR
≤ 0.50 kW
≤ 1.19 GPR
Stationary Single Tank Door
≤ 0.70 kW
≤ 0.89 GPR
≤ 0.60 kW
≤ 1.18 GPR
Pot, Pan, and Utensil
≤ 1.20 kW
≤ 0.58 GPSF
≤ 1.00 kW
≤ 0.58 GPSF
Single Tank Conveyor
≤ 1.50 kW
≤ 0.70 GPR
≤ 1.50 kW
≤ 0.79 GPR
Multiple Tank Conveyor
≤ 2.25 kW
≤ 0.54 GPR
≤ 2.00 kW
≤ 0.54 GPR
DEFINITION OF BASELINE EQUIPMENT
The baseline equipment is a new dishwasher that is not ENERGY STAR certified.
DEEMED LIFETIME OF EFFICIENT EQUIPMENT
The expected measure life is assumed to be:
600
Dishwasher Type
Equipment Life
Low
Temp
Under Counter
10
Stationary Single Tank Door
15
Single Tank Conveyor
20
Multi Tank Conveyor
20
High
Temp
Under Counter
10
Stationary Single Tank Door
15
Single Tank Conveyor
20
Multi Tank Conveyor
20
Pot, Pan, and Utensil
10
600
Lifetime from ENERGY STAR Commercial Kitchen Equipment Savings Calculator which cites reference as “EPA/FSTC research
on available models, 2013”
http://www.energystar.gov/buildings/sites/default/uploads/files/commercial_kitchen_equipment_calculator.xlsx
Filed with the Iowa Utilities Board on September 23, 2020, EEP-2018-0002

Iowa Energy Efficiency Statewide Technical Reference Manual –3.6.1 Dishwasher
Vol.3 Nonresidential Measures July 22, 2020 FINAL Page 272 of 410
DEEMED MEASURE COST
The incremental capital cost for this measure is:
601
Dishwasher Type
Incremental Cost
Low
Temp
Under Counter
$50
Stationary Single Tank Door
$0
Single Tank Conveyor
$0
Multi Tank Conveyor
$970
High
Temp
Under Counter
$120
Stationary Single Tank Door
$770
Single Tank Conveyor
$2050
Multi Tank Conveyor
$970
Pot, Pan, and Utensil
$1710
LOADSHAPE
Loadshape NREW12 - Nonresidential Electric Hot Water – Restaurant
Loadshape NRGW12 - Nonresidential Gas Hot Water – Restaurant
Algorithm
CALCULATION OF SAVINGS
ENERGY STAR dishwashers save energy in three categories: building water heating, booster water heating, and idle
energy. Building water heating and booster water heating could be either electric or natural gas.
ELECTRIC ENERGY SAVINGS
Custom calculation below, otherwise use deemed values found within the tables that follow.
602
603
Where:
ΔBuildingEnergy
= Change in annual electric energy consumption of building water heater
= [(WaterUse
Base
* RacksWashed * Days) * (∆T
in
*1.0 * 8.2 ÷ Eff
Heater
÷ 3,412)] -
[(WaterUse
ESTAR
* RacksWashed * Days) * (∆T
in
*1.0 * 8.2 ÷ Eff
Heater
÷ 3,412)]
ΔBoosterEnergy
= Annual electric energy consumption of booster water heater
= [(WaterUse
Base
* RacksWashed * Days) * (∆T
in
*1.0 * 8.2 ÷ Eff
Heater
÷ 3,412)] -
[(WaterUse
ESTAR
* RacksWashed * Days) * (∆T
in
*1.0 * 8.2 ÷ Eff
Heater
÷ 3,412)]
ΔIdleEnergy
= Annual idle electric energy consumption of dishwasher
= [IdleDraw
Base
* (Hours *Days – Days * RacksWashed * WashTime ÷ 60)] –
[IdleDraw
ESTAR
* (Hours *Days – Days * RacksWashed * WashTime ÷ 60)]
Where:
WaterUse
Base
= Water use per rack (gal) of baseline dishwasher
601
Measure cost from ENERGY STAR Commercial Kitchen Equipment Savings Calculator which cites reference as “EPA research
on available models using AutoQuotes, 2012”
602
Algorithms and assumptions except for inlet water temperature increase for building water heaters derived from ENERGY
STAR Commercial Kitchen Equipment Savings Calculator
603
Booster water heater energy only applies to high-temperature dishwashers.
Filed with the Iowa Utilities Board on September 23, 2020, EEP-2018-0002

Iowa Energy Efficiency Statewide Technical Reference Manual –3.6.1 Dishwasher
Vol.3 Nonresidential Measures July 22, 2020 FINAL Page 273 of 410
= Use value from table below as determined by machine type and sanitation method
WaterUse
ESTAR
= Water use per rack (gal) of ENERGY STAR dishwasher
= Custom or if unknown, use value from table below as determined by machine type
and sanitation method
RacksWashed = Number of racks washed per day
= Custom or if unknown, use value from table below as determined by machine type
and sanitation method
Days = Annual days of dishwasher operation
= Custom or if unknown, use 365.25 days per year
T
in
= Inlet water temperature increase (°F)
= Custom or if unknown, use 83.5 °F for building water heaters
604
and 40 °F for booster
water heaters
1.0 = Specific heat of water (Btu/lb/°F)
8.2 = Density of water (lb/gal)
Eff
Heater
= Efficiency of water heater
= Custom or if unknown, use 98% for electric building and booster water heaters
3,412 = kWh to Btu conversion factor
IdleDraw
Base
= Idle power draw (kW) of baseline dishwasher
= Use value from table below as determined by machine type and sanitation method
IdleDraw
ESTAR
= Idle power draw (kW) of ENERGY STAR dishwasher
= Custom or if unknown, use value from table below as determined by machine type
and sanitation method
Hours = Average daily hours of dishwasher operation
= Custom or if unknown, use 18 hours per day
WashTime = Typical wash time (min)
= Custom or if unknown, use value from table below as determined by machine type
and sanitation method
60 = Minutes to hours conversion factor
604
Inlet water temperature increase for building water heaters based on 140 °F building water heater set point and 56.5 °F inlet
water temperature to the DHW system.
Filed with the Iowa Utilities Board on September 23, 2020, EEP-2018-0002

Iowa Energy Efficiency Statewide Technical Reference Manual –3.6.1 Dishwasher
Vol.3 Nonresidential Measures July 22, 2020 FINAL Page 274 of 410
Default values for WaterUse, RacksWashed, kW
Idle
, and WashTime are presented in the table below.
RacksWashed
WashTime
WaterUse
IdleDraw
Low Temperature
All Dishwashers
All
Dishwashers
Conventional
ENERGY
STAR
Conventional
ENERGY
STAR
Under Counter
75
2.0
1.73
1.19
0.50
0.50
Stationary Single
Tank Door
280
1.5
2.10
1.18
0.60
0.60
Single Tank Conveyor
400
0.3
1.31
0.79
1.60
1.50
Multi Tank Conveyor
600
0.3
1.04
0.54
2.00
2.00
High Temperature
All Dishwashers
All
Dishwashers
Conventional
ENERGY
STAR
Conventional
ENERGY
STAR
Under Counter
75
2.0
1.09
0.86
0.76
0.50
Stationary Single
Tank Door
280
1.0
1.29
0.89
0.87
0.70
Single Tank Conveyor
400
0.3
0.87
0.70
1.93
1.50
Multi Tank Conveyor
600
0.2
0.97
0.54
2.59
2.25
Pot, Pan, and Utensil
280
3.0
0.70
0.58
1.20
1.20
Savings for all water heating combinations are presented in the tables below.
Electric building and electric booster water heating
Dishwasher type
kWh
Base
kWh
ESTAR
ΔkWh
Low
Temp
Under Counter
12,545.1
9,512.8
3,032.2
Stationary Single Tank Door
46,434.3
27,147.7
19,286.5
Single Tank Conveyor
48,582.3
32,424.9
16,157.4
Multi Tank Conveyor
57,676.4
35,215.4
22,461.0
High
Temp
Under Counter
13,355.3
9,973.2
3,382.2
Stationary Single Tank Door
44,234.7
31,004.4
13,230.3
Single Tank Conveyor
49,815.1
39,772.1
10,043.0
Multi Tank Conveyor
79,584.3
49,027.5
30,556.8
For example, an ENERGY STAR high-temperature, under counter dishwasher with electric building and electric
booster water heating with defaults from the calculation above and the table below would save:
ΔkWh = ΔBuildingEnergy + ΔBoosterEnergy + ΔIdleEnergy
Where:
ΔBuildingEnergy = [(1.09 * 75 * 365.25) * (83.5 *1.0 * 8.2 ÷ 0.98
÷ 3,412)] - [(0.86 * 75 *
365.25) * (83.5 *1.0 * 8.2 ÷ 0.98
÷ 3,412)]
= 1,291.5 kWh
ΔBoosterEnergy = [(1.09 * 75 * 365.25) * (40 *1.0 * 8.2 ÷ 0.98
÷ 3,412)] - [(0.86 * 75 * 365.25)
* (40 *1.0 * 8.2 ÷ 0.98
÷ 3,412)]
= 618.7 kWh
ΔIdleEnergy = [0.76 * (18 *365.25 – 365.25 * 75 * 2.0 ÷ 60)] –
[0.50 * (18 *365.25 – 365.25 * 75 * 2.0 ÷ 60)]
= 1,472.0 Wh
ΔkWh = 1,291.5 + 618.7 + 1,472.0
= 3,382.2 kWh
Filed with the Iowa Utilities Board on September 23, 2020, EEP-2018-0002
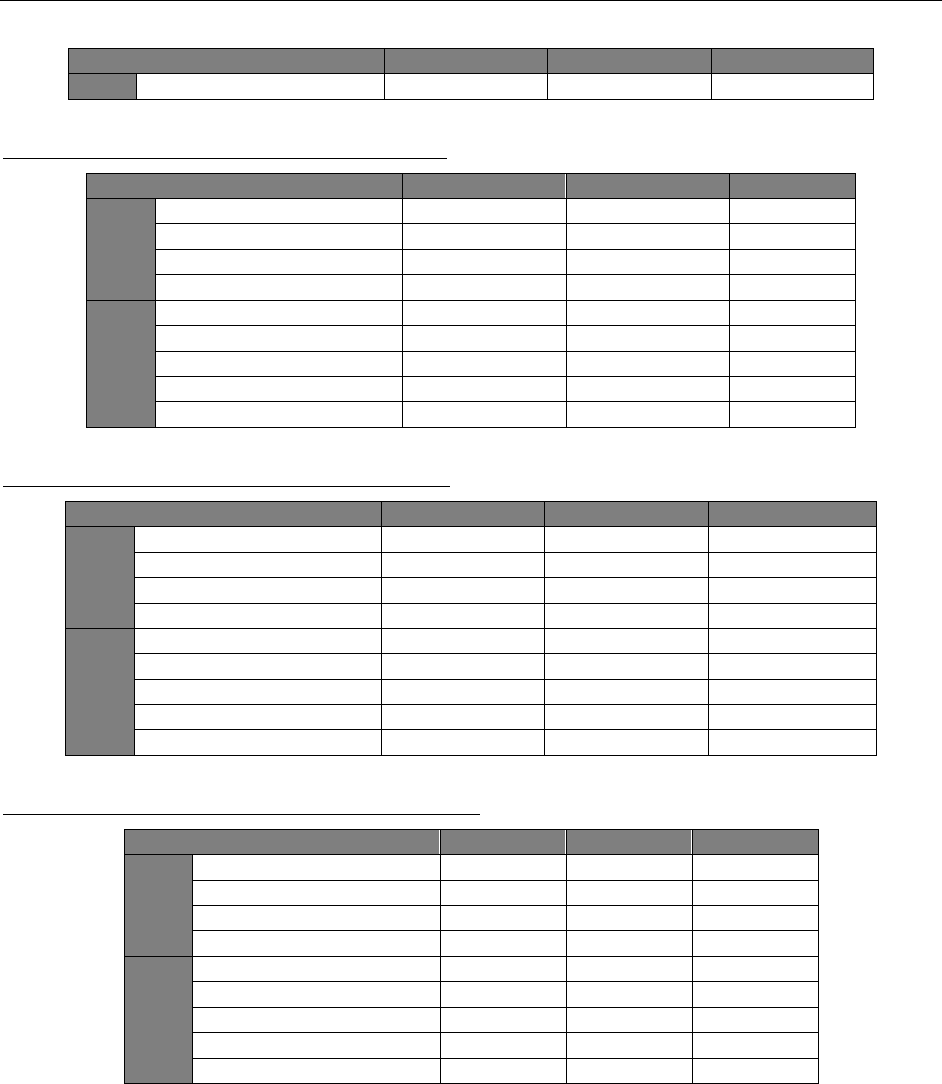
Iowa Energy Efficiency Statewide Technical Reference Manual –3.6.1 Dishwasher
Vol.3 Nonresidential Measures July 22, 2020 FINAL Page 275 of 410
Dishwasher type
kWh
Base
kWh
ESTAR
ΔkWh
Pot, Pan, and Utensil
23,457.5
19,736.7
3,720.7
Electric building and natural gas booster water heating
Dishwasher type
kWh
Base
kWh
ESTAR
ΔkWh
Low
Temp
Under Counter
12,545.1
9,512.8
3,032.2
Stationary Single Tank Door
46,434.3
27,147.7
19,286.5
Single Tank Conveyor
48,582.3
32,424.9
16,157.4
Multi Tank Conveyor
57,676.4
35,215.4
22,461.0
High
Temp
Under Counter
10,423.3
7,659.8
2,763.5
Stationary Single Tank Door
31,280.0
22,066.6
9,213.4
Single Tank Conveyor
37,333.7
29,729.6
7,604.1
Multi Tank Conveyor
58,710.4
37,406.9
21,303.4
Pot, Pan, and Utensil
16,427.7
13,912.1
2,515.6
Natural gas building and electric booster water heating
Dishwasher type
kWh
Base
kWh
ESTAR
ΔkWh
Low
Temp
Under Counter
2,830.7
2,830.7
0.0
Stationary Single Tank Door
2,410.7
2,410.7
0.0
Single Tank Conveyor
9,350.4
8,766.0
584.4
Multi Tank Conveyor
10,957.5
10,957.5
0.0
High
Temp
Under Counter
7,234.7
5,144.0
2,090.6
Stationary Single Tank Door
17,191.7
12,346.8
4,844.9
Single Tank Conveyor
23,760.3
18,808.5
4,951.8
Multi Tank Conveyor
36,009.9
24,769.6
11,240.4
Pot, Pan, and Utensil
8,782.9
7,577.8
1,205.1
Natural gas building and natural gas booster water heating
Dishwasher type
kWh
Base
kWh
ESTAR
ΔkWh
Low
Temp
Under Counter
2,830.7
2,830.7
0.0
Stationary Single Tank Door
2,410.7
2,410.7
0.0
Single Tank Conveyor
9,350.4
8,766.0
584.4
Multi Tank Conveyor
10,957.5
10,957.5
0.0
High
Temp
Under Counter
4,302.6
2,830.7
1,472.0
Stationary Single Tank Door
4,236.9
3,409.0
827.9
Single Tank Conveyor
11,278.9
8,766.0
2,512.9
Multi Tank Conveyor
15,136.0
13,149.0
1,987.0
Pot, Pan, and Utensil
1,753.2
1,753.2
0.0
SUMMER COINCIDENT PEAK DEMAND SAVINGS
Where:
kWh = Electric energy savings, calculated above
CF = Summer peak coincidence factor
= 0.638
Filed with the Iowa Utilities Board on September 23, 2020, EEP-2018-0002

Iowa Energy Efficiency Statewide Technical Reference Manual –3.6.1 Dishwasher
Vol.3 Nonresidential Measures July 22, 2020 FINAL Page 276 of 410
Other variables as defined above.
NATURAL GAS ENERGY SAVINGS
605
Where:
ΔBuildingEnergy = Change in annual natural gas consumption of building water heater
= [(WaterUse
Base
* RacksWashed * Days)*(∆T
in
* 1.0 * 8.2 ÷ Eff
Heater
÷ 100,000)] -
[(WaterUse
ESTAR
* RacksWashed * Days)*(∆T
in
* 1.0*8.2 ÷ Eff
Heater
÷ 100,000)]
ΔBoosterEnergy = Change in annual natural gas consumption of booster water heater
= [(WaterUse
Base
* RacksWashed * Days)*(∆T
in
* 1.0 * 8.2 ÷ Eff
Heater
÷ 100,000)] -
[(WaterUse
ESTAR
* RacksWashed * Days)*(∆T
in
* 1.0*8.2 ÷ Eff
Heater
÷ 100,000)]
Where:
Eff
Heater
= Efficiency of water heater
= Custom or 78% for gas building
606
and 80% for gas booster water heaters
100,000 = Therms to Btu conversion factor
Other variables as defined above.
605
Algorithms and assumptions derived from ENERGY STAR Commercial Kitchen Equipment Savings Calculator except for inlet
water temperature increase for building water heaters and efficiency of gas building water heater
606
DOE Final Rule discusses Recovery Efficiency with an average around 0.76 for Gas Fired Storage Water heaters and 0.78 for
standard efficiency gas fired tankless water heaters up to 0.95 for the highest efficiency gas fired condensing tankless water
heaters. These numbers represent the range of new units however, not the range of existing units in stock. Review of AHRI
Directory suggests range of recovery efficiency ratings for new Gas DHW units of 70-87%. Average of existing units is estimated
at 78%.
For example, an ENERGY STAR high-temperature, under counter dishwasher with electric building and electric
booster water heating with defaults from the calculation above and the table below would save:
KW = 3,382.2 / (18 * 365.25) *0.638
= 0.3282 KW
For example, an ENERGY STAR high-temperature, under counter dishwasher with gas building and gas booster
water heating with defaults from the calculation above and the table within the electric energy savings
characterization would save:
ΔTherms = ΔBuildingEnergy + ΔBoosterEnergy
Where:
ΔBuildingEnergy = [(1.09
* 75 * 365.25)*(83.5
* 1.0 * 8.2 ÷ 0.78 ÷ 100,000)] - [(0.86 * 75 *
365.25)*(83.5
* 1.0 * 8.2 ÷ 0.78 ÷ 100,000)]
= 55.4 therms
ΔBoosterEnergy = [(1.09
* 75 * 365.25)*(40
* 1.0 * 8.2 ÷ 0.80 ÷ 100,000)] - [(0.86 * 75 *
365.25)*(40
* 1.0 * 8.2 ÷ 0.80 ÷ 100,000)]
= 25.9 therms
ΔTherms = 55.4 + 25.9
= 81.2 therms
Filed with the Iowa Utilities Board on September 23, 2020, EEP-2018-0002

Iowa Energy Efficiency Statewide Technical Reference Manual –3.6.1 Dishwasher
Vol.3 Nonresidential Measures July 22, 2020 FINAL Page 277 of 410
Savings for all water heating combinations are presented in the tables below.
Electric building and natural gas booster water heating
Dishwasher type
Therms
Base
Therms
ESTAR
ΔTherms
Low
Temp
Under Counter
NA
NA
NA
Stationary Single Tank Door
NA
NA
NA
Single Tank Conveyor
NA
NA
NA
Multi Tank Conveyor
NA
NA
NA
High
Temp
Under Counter
122.6
96.7
25.9
Stationary Single Tank Door
541.5
373.6
167.9
Single Tank Conveyor
521.7
419.7
101.9
Multi Tank Conveyor
872.5
485.7
386.8
Pot, Pan, and Utensil
293.8
243.5
50.4
Natural gas building and natural gas booster water heating
Dishwasher type
Therms
Base
Therms
ESTAR
ΔTherms
Low
Temp
Under Counter
416.4
286.5
130.0
Stationary Single Tank Door
1,887.2
1,060.4
826.8
Single Tank Conveyor
1,681.8
1,014.2
667.6
Multi Tank Conveyor
2,002.8
1,039.9
962.9
High
Temp
Under Counter
384.9
303.7
81.2
Stationary Single Tank Door
1,700.8
1,173.4
527.4
Single Tank Conveyor
1,638.6
1,318.4
320.2
Multi Tank Conveyor
2,740.4
1,525.6
1,214.8
Pot, Pan, and Utensil
922.9
764.7
158.2
Natural gas building and electric booster water heating
Dishwasher type
Therms
Base
Therms
ESTAR
ΔTherms
Low
Temp
Under Counter
416.4
286.5
130.0
Stationary Single Tank Door
1,887.2
1,060.4
826.8
Single Tank Conveyor
1,681.8
1,014.2
667.6
Multi Tank Conveyor
2,002.8
1,039.9
962.9
High
Temp
Under Counter
262.4
207.0
55.4
Stationary Single Tank Door
1,159.3
799.8
359.5
Single Tank Conveyor
1,116.9
898.7
218.3
Multi Tank Conveyor
1,868.0
1,039.9
828.1
Pot, Pan, and Utensil
629.1
521.2
107.8
PEAK GAS SAVINGS
Where:
ΔTherms = Natural gas energy savings, calculated above
Other variables as defined above.
Filed with the Iowa Utilities Board on September 23, 2020, EEP-2018-0002

Iowa Energy Efficiency Statewide Technical Reference Manual –3.6.1 Dishwasher
Vol.3 Nonresidential Measures July 22, 2020 FINAL Page 278 of 410
WATER IMPACT DESCRIPTIONS AND CALCULATION
Where:
WaterUse
Base
= Water use per rack (gal) of baseline dishwasher
= Use value from table within the electric energy savings characterization as determined
by machine type and sanitation method
WaterUse
ESTAR
= Water use per rack (gal) of ENERGY STAR dishwasher
= Custom or if unknown, use value from table within the electric energy savings
characterization as determined by machine type and sanitation method
Other variales as defined above.
Savings for all dishwasher types are presented in the table below.
Annual Water Consumption (gallons)
Baseline
ENERGY STAR
Savings
Low Temperature
Under Counter
47,391.2
32,598.6
14,792.6
Stationary Single Tank
Door
214,767.0
120,678.6
94,088.4
Single Tank Conveyor
191,391.0
115,419.0
75,972.0
Multi Tank Conveyor
227,916.0
118,341.0
109,575.0
High Temperature
Under Counter
29,859.2
23,558.6
6,300.6
Stationary Single Tank
Door
131,928.3
91,020.3
40,908.0
Single Tank Conveyor
127,107.0
102,270.0
24,837.0
Multi Tank Conveyor
212,575.5
118,341.0
94,234.5
Pot, Pan, and Utensil
71,589.0
59,316.6
12,272.4
For example, an ENERGY STAR high-temperature, under counter dishwasher with gas building and gas booster
water heating with defaults from the calculation above and the table within the electric energy savings
characterization would save:
ΔPeakTherms = 81.2 / 365.25
= 0.2223 therms/day
For example, an ENERGY STAR low-temperature, under counter dishwasher with defaults from the calculation
above and the table within the electric energy savings characterization would save:
∆Water = (WaterUse
Base
* RacksWashed * Days) - (WaterUse
ESTAR
* RacksWashed * Days)
ΔWater = (1.73
* 75 * 365.25) - (1.19
* 75 * 365.25)
= 14,792.6 gallons
Filed with the Iowa Utilities Board on September 23, 2020, EEP-2018-0002

Iowa Energy Efficiency Statewide Technical Reference Manual –3.6.1 Dishwasher
Vol.3 Nonresidential Measures July 22, 2020 FINAL Page 279 of 410
DEEMED O&M COST ADJUSTMENT CALCULATION
N/A
MEASURE CODE: NR-FSE-DISH-V02-190101
SUNSET DATE: 1/1/2022
Filed with the Iowa Utilities Board on September 23, 2020, EEP-2018-0002

Iowa Energy Efficiency Statewide Technical Reference Manual –3.6.2 Commercial Solid and Glass Door
Refrigerators & Freezers
Vol.3 Nonresidential Measures July 22, 2020 FINAL Page 280 of 410
3.6.2. Commercial Solid and Glass Door Refrigerators & Freezers
DESCRIPTION
This measure applies to ENERGY STAR vertical closed and horizontal closed refrigerators or freezers installed in a
commercial kitchen. ENERGY STAR commercial refrigerators and freezers are more energy efficient because they are
designed with components such as ECM evaporator and condenser fan motors, hot gas anti-sweat heaters, or high-
efficiency compressors, which will significantly reduce energy consumption.
This measure was developed to be applicable to the following program types: TOS.
DEFINITION OF EFFICIENT EQUIPMENT
To qualify for this measure, the installed equipment must be a new ENERGY STAR certified vertical closed or
horizontal closed, solid or glass door refrigerator or freezer meeting energy consumptions requirements as
determined by door type (solid or glass) and refrigerated volume (V).
ENERGY STAR Requirements (Version 4.0, Effective January 1, 2017)
Volume (ft
3
)
Maximum Daily Energy Consumption
(kWh/day)
Refrigerator
Freezer
Vertical Closed:
Solid Door
0 < V < 15
≤ 0.022V+0.97
≤ 0.21V+0.90
15 ≤ V < 30
≤ 0.066V+0.31
≤ 0.12V+2.248
30 ≤ V < 50
≤ 0.04V+1.09
≤ 0.285V-2.703
V ≥ 50
≤ 0.024V+1.89
≤ 0.142V+4.445
Glass Door
0 < V < 15
≤ 0.095V+0.445
≤ 0.232V+2.36
15 ≤ V < 30
≤ 0.05V+1.12
30 ≤ V < 50
≤ 0.076V+0.34
V ≥ 50
≤ 0.105V-1.111
Horizontal Closed:
Solid or Glass Doors
All Volumes
≤ 0.05V+0.28
≤ 0.057V+0.55
DEFINITION OF BASELINE EQUIPMENT
The baseline equipment is a new vertical closed or horizontal closed, solid or glass door refrigerator or freezer that
is not ENERGY STAR certified.
DEEMED LIFETIME OF EFFICIENT EQUIPMENT
The expected measure life is assumed to be 12 years.
607
DEEMED MEASURE COST
607
Measure life from ENERGY STAR Commercial Kitchen Equipment Savings Calculator which cites reference as “FSTC research
on available models, 2009”
http://www.energystar.gov/buildings/sites/default/uploads/files/commercial_kitchen_equipment_calculator.xlsx
Filed with the Iowa Utilities Board on September 23, 2020, EEP-2018-0002

Iowa Energy Efficiency Statewide Technical Reference Manual –3.6.2 Commercial Solid and Glass Door
Refrigerators & Freezers
Vol.3 Nonresidential Measures July 22, 2020 FINAL Page 281 of 410
The incremental capital per cubic foot cost for this measure can be found below.
608
Description and Volume
(cu. ft.)
Refrigerator
Freezer
Incremental Unit Cost per Foot
Solid Door
0 ≤ V < 15
$24.21
$30.41
15 ≤ V < 30
30 ≤ V < 50
50 ≤ V
Glass Door
0 ≤ V < 15
$24.77
$33.01
15 ≤ V < 30
30 ≤ V < 50
50 ≤ V
Chest
Solid/Glass
$57.11
$75.90
LOADSHAPE
Loadshape NRE01 - Nonresidential Refrigeration – Grocery
Algorithm
CALCULATION OF SAVINGS
ELECTRIC ENERGY SAVINGS
Custom calculation below.
609
Where:
kWh
Base
= Maximum daily energy consumption (kWh/day) of baseline refrigerator or freezer
= Calculated as shown in the table below using the actual refrigerated volume (V)
Equipment Type
kWh
Base
610
Solid Door Refrigerator
0.05V+1.36
Glass Door Refrigerator
0.1V+0.86
Solid Door Freezer
0.22V+1.38
Glass Door Freezer
0.29V+2.95
Solid Door Chest
Refrigerator
0.05V+0.91
Glass Door Chest
Refrigerator
0.06V+0.37
608
Northwest Regional Technical Forum, ENERY STAR Version 4.0 Analysis. Refer to CostData&Analysis tab in
ComRefrigeratorFreezer_v4_2.xlsm.
609
Algorithms and assumptions from ENERGY STAR Commercial Kitchen Equipment Savings Calculator
610
United States Department of Energy, 10 CFR Part 431, “Energy Conservation Standards for Commercial Refrigeration
Equipment”, March, 2017.
Filed with the Iowa Utilities Board on September 23, 2020, EEP-2018-0002
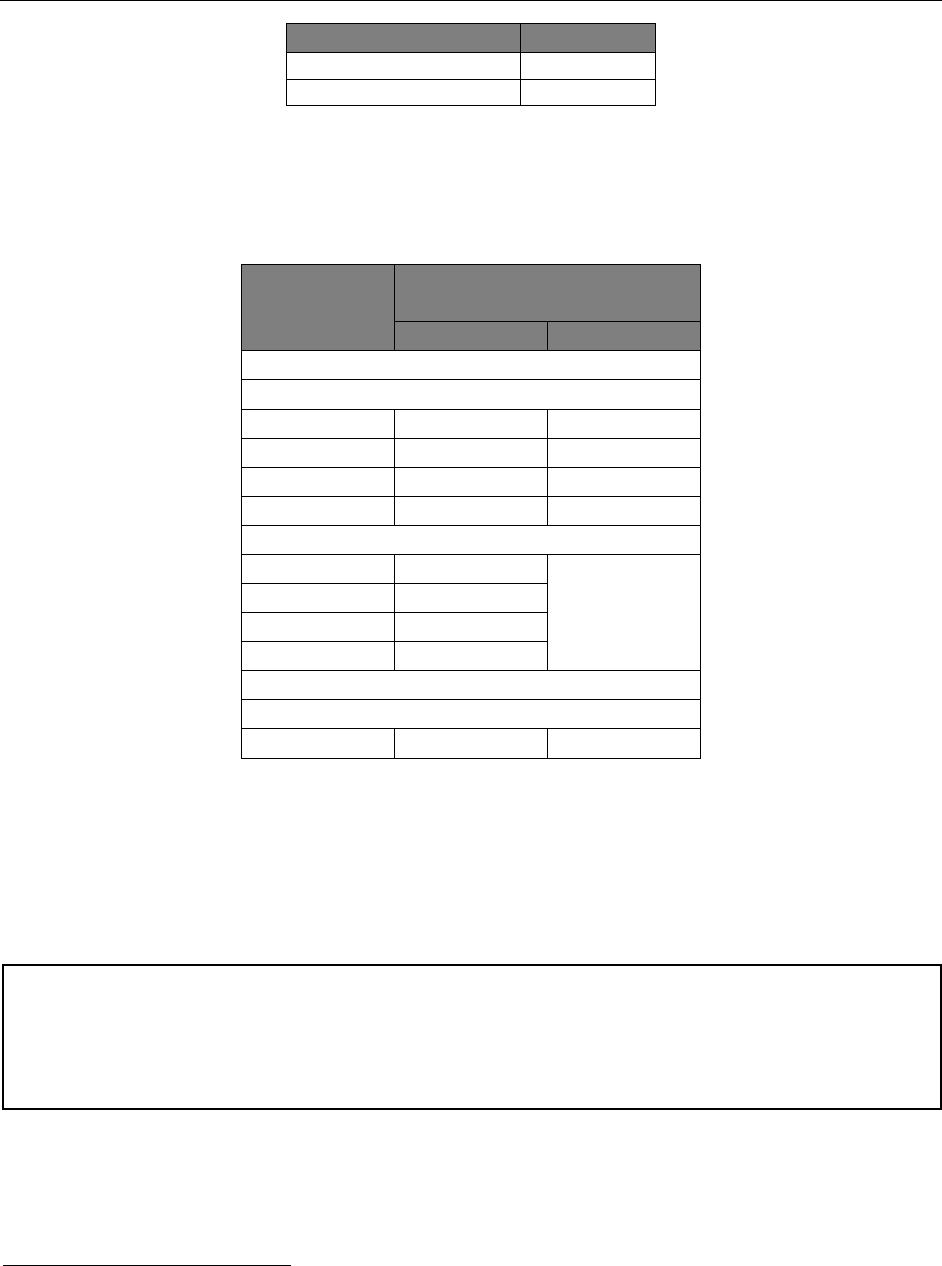
Iowa Energy Efficiency Statewide Technical Reference Manual –3.6.2 Commercial Solid and Glass Door
Refrigerators & Freezers
Vol.3 Nonresidential Measures July 22, 2020 FINAL Page 282 of 410
Equipment Type
kWh
Base
610
Solid Door Chest Freezer
0.06V + 1.12
Glass Door Chest Freezer
0.08V+1.23
kWh
ESTAR
= Maximum daily energy consumption (kWh/day) of ENERGY STAR refrigerator or
freezer
= Custom or if unknown, calculated as shown in the table below using the actual
refrigerated volume (V):
611
Volume (ft3)
Maximum Daily Energy
Consumption (kWh/day)
Refrigerator
Freezer
Vertical Closed:
Solid Door
0 < V < 15
≤ 0.022V+0.97
≤ 0.21V+0.90
15 ≤ V < 30
≤ 0.066V+0.31
≤ 0.12V+2.248
30 ≤ V < 50
≤ 0.04V+1.09
≤ 0.285V-2.703
V ≥ 50
≤ 0.024V+1.89
≤ 0.142V+4.445
Glass Door
0 < V < 15
≤ 0.095V+0.445
≤ 0.232V+2.36
15 ≤ V < 30
≤ 0.05V+1.12
30 ≤ V < 50
≤ 0.076V+0.34
V ≥ 50
≤ 0.105V-1.111
Horizontal Closed:
Solid or Glass Doors
All Volumes
≤ 0.05V+0.28
≤ 0.057V+0.55
V = Refrigerated volume (ft
3
) calculated in accordance with the Department of Energy test
procedure in 10 CFR §431.64
= Actual installed
Days = Days of refrigerator or freezer operation per year
= 365.25 days per year
SUMMER COINCIDENT PEAK DEMAND SAVINGS
611
ENERGY STAR, “ENERGY STAR Program Requirements for Commercial Refrigerators and Freezers”, v4.0, Effective January 1,
2017.
For example, an ENERGY STAR solid door, vertical closed refrigerator with a volume of 35 ft
3
would save:
ΔkWh = (kWh
Base
– kWh
ESTAR
) * Days
ΔkWh
= [(0.05 * 35 + 1.36) – (0.04 * 35 + 1.09)] * 365.25
= 226.5kWh
Filed with the Iowa Utilities Board on September 23, 2020, EEP-2018-0002

Iowa Energy Efficiency Statewide Technical Reference Manual –3.6.2 Commercial Solid and Glass Door
Refrigerators & Freezers
Vol.3 Nonresidential Measures July 22, 2020 FINAL Page 283 of 410
Where:
∆kWh = Electric energy savings, calculated above
HOURS = Hours of refrigerator or freezer operation per year
= 8766
612
CF = Summer peak coincidence factor
= 0.964
NATURAL GAS ENERGY SAVINGS
N/A
PEAK GAS SAVINGS
N/A
WATER IMPACT DESCRIPTIONS AND CALCULATION
N/A
DEEMED O&M COST ADJUSTMENT CALCULATION
N/A
MEASURE CODE: NR-FSE-CSGD-V01-190101
SUNSET DATE: 1/1/2024
612
Equipment is assumed to operate continuously, 24 hour per day, 365.25 days per year
For example, an ENERGY STAR solid door, vertical closed refrigerator with a volume of 35 ft
3
would save:
ΔkW = (226.5/8766) * 0.964
= 0.0249kW
Filed with the Iowa Utilities Board on September 23, 2020, EEP-2018-0002

Iowa Energy Efficiency Statewide Technical Reference Manual –3.6.3 Pre-Rinse Spray Valve
Vol.3 Nonresidential Measures July 22, 2020 FINAL Page 284 of 410
3.6.3. Pre-Rinse Spray Valve
DESCRIPTION
Pre-rinse valves use a spray of water to remove food waste from dishes prior to cleaning in a dishwasher. More
efficient spray valves use less water thereby reducing water consumption, water heating cost, and waste water
(sewer) charges. Pre-rinse spray valves include a nozzle, squeeze lever, and dish guard bumper. The primary impacts
of this measure are water savings. Reduced hot water consumption saves either natural gas or electricity, depending
on the type of energy the hot water heater uses.
This measure was developed to be applicable to the following program types: TOS and DI.
DEFINITION OF EFFICIENT EQUIPMENT
To qualify for this measure, the installed equipment must be a new pre-rinse spray valve with a maximum flow rate
that meets program requirements.
DEFINITION OF BASELINE EQUIPMENT
The baseline equipment flow rate depends on program type. For TOS, the baseline equipment is a new pre-rinse
spray valve with a maximum flow rate of 1.23 gpm or less.
613
For DI, the baseline equipment is an existing pre-rinse
spray valve with a flow rate of 2.14 gpm or less.
614
DEEMED LIFETIME OF EFFICIENT EQUIPMENT
The expected measure life is assumed to be 5 years.
615
DEEMED MEASURE COST
For TOS programs, the incremental cost of this measure is assumed to be $0.
616
For DI programs, the total installed
cost is assumed to be $54.
617
LOADSHAPE
Loadshape NREW12 - Nonresidential Electric Hot Water – Restaurant
Loadshape NRGW12 - Nonresidential Gas Hot Water – Restaurant
613
Baseline for TOS programs is calculated using the maximum flow rate for each product class in 10 CFR 431.266, Energy
Efficiency Program for Certain Commercial and Industrial Equipment weighted by estimated 2018 shipments for each product
class from Table 3.6.1: U.S. DOE, “Technical Support Document: Energy Efficiency Program for Consumer Products and
Commercial and Industrial Equipment: Commercial Prerinse Spray Valves,” December 2015.
614
Average flow rate of spray valve replaced through direct install programs from DNV-GL, “Impact Evaluation of National Grid
Rhode Island C&I Prescriptive Gas Pre-Rinse Spray Valve Measure – Final Report,” September 30, 2014, page 6-6.
615
Measure life from U.S. DOE, “Technical Support Document: Energy Efficiency Program for Consumer Products and
Commercial and Industrial Equipment: Commercial Prerinse Spray Valves,” December 2015, page 8-13.
616
Incremental measure cost based on U.S. DOE, “Technical Support Document: Energy Efficiency Program for Consumer
Products and Commercial and Industrial Equipment: Commercial Prerinse Spray Valves,” December 2015, page 8-1.
617
Total installed cost is the manufacturer selling price ($35.40) from Table 8.2.1 multiplied by the retailer markup (1.52) from
Table 8.2.2: U.S. DOE, “Technical Support Document: Energy Efficiency Program for Consumer Products and Commercial and
Industrial Equipment: Commercial Prerinse Spray Valves,” December 2015. It is assumed that programs typically install spray
valves only when other kitchen equipment is also being installed, and therefore, there are no additional labor costs associated
with spray valve installations.
Filed with the Iowa Utilities Board on September 23, 2020, EEP-2018-0002

Iowa Energy Efficiency Statewide Technical Reference Manual –3.6.3 Pre-Rinse Spray Valve
Vol.3 Nonresidential Measures July 22, 2020 FINAL Page 285 of 410
Algorithm
CALCULATION OF ENERGY SAVINGS
ELECTRIC ENERGY SAVINGS
Custom calculation below, otherwise use deemed value of 1,215.6 kWh for TOS and 5,640.6 kWh for DI.
618
Where:
HotPercentage = Percentage of hot water used for rinse
= Custom or If unknown, use 100%
T
out
= Unmixed Outlet Water Temperature from the DHW system
= Actual, otherwise assume 140.
619
T
in
= Inlet Water Temperature to the DHW system
= Actual, otherwise assume 56.5.
620
1.0 = Specific heat of water (Btu/lb/°F)
8.33 = Specific weight capacity of water (lb/gal)
Eff
Heater
= Efficiency of water heater
= Custom or if unknown, use 98% for electric water heaters
3,412 = kWh to Btu conversion factor
WaterUse = Change in annual water consumption
= Custom calculation in Water Impact Descriptions and Calculation section of this
measure, otherwise use 5,844.0 gal/yr for TOS and 27,116.2 gal/yr for DI
SUMMER COINCIDENT PEAK DEMAND SAVINGS
618
Algorithms and assumptions except for water temperature values flow rates, and specific weight of water derived from
ENERGY STAR Commercial Kitchen Equipment Savings Calculator. See file Pre Rinse Spray Valve Calculations_06122019.xlsx.
http://www.energystar.gov/buildings/sites/default/uploads/files/commercial_kitchen_equipment_calculator.xlsx
619
Ideally the actual set point of the water heater should be used. If not, 140 degrees is provided as an estimate based on
review of building and plumbing codes for IA. The codes limit temperatures at the end use but not at the water heater system,
which can be anywhere in the range 120 -201 degrees. Generally speaking, code limits the temperature to fixtures to 120
degrees F and 140 degrees for applications like laundry or dishwashing.
620
Averaged monthly water main temperature calculated using the methodology provided in Building America Research
Benchmark Definition, updated December 2009. Pg.19-20. http://www.nrel.gov/docs/fy10osti/47246.pdf; water main
temperature represents the average of TMY3 data from all Class I stations located in Des Moines, IA.
For example, an efficient pre-rinse spray valve installed under the TOS program type, with defaults from the
calculation above, would save:
ΔkWh = 1.00 * (140 – 56.5) * 1.0 * 8.33 / 0.98 / 3,412 * 5,844.0
= 1,215.6 kWh
Filed with the Iowa Utilities Board on September 23, 2020, EEP-2018-0002

Iowa Energy Efficiency Statewide Technical Reference Manual –3.6.3 Pre-Rinse Spray Valve
Vol.3 Nonresidential Measures July 22, 2020 FINAL Page 286 of 410
Where:
kWh = Electric energy savings, calculated above
Minutes = Average daily minutes of spray valve operation
= Custom or if unknown, use 64 minutes per day.
621
60 = Minutes to hours conversion factor
Days = Annual days of operation
= Custom or if unknown, use 365.25 days per year
CF = Summer peak coincidence factor
= 0.0114 for a fast-food restaurant and 0.0250 for a sit-down restaurant.
622
NATURAL GAS ENERGY SAVINGS
Custom calculation below, otherwise use deemed value of 52.1 therms/yr for TOS and 241.8 therms/yr for DI.
623
Where:
Eff
Heater
= Efficiency of water heater
= Custom or if unknown, use 78%
624
for gas water heaters
100,000 = Btu to therms conversion factor
Other variables as defined above.
621
ENERGY STAR Commercial Kitchen Equipment Savings Calculator
622
CF adopted from Low Flow Faucet Aerator measure, calculated as follows: Assumptions for percentage of usage during peak
period (2-6pm) were made and then multiplied by 65/365 (65 being the number of days in peak period) and by the number of
total annual recovery hours to give an estimate of the number of hours of recovery during peak periods. There are 260 hours in
the peak period, so the probability there will be savings during the peak period is calculated as the number of hours of recovery
during peak divided by 260. See ‘Commercial Faucet Aerator Calculations.xls’ for details.
623
Algorithms and assumptions derived except for water temperature values, flow rates, specific weight of water, and gas
water heater efficiency from ENERGY STAR Commercial Kitchen Equipment Savings Calculator. See file Pre Rinse Spray Valve
Calculations_06122019.xlsx.
624
DOE Final Rule discusses Recovery Efficiency with an average around 0.76 for Gas Fired Storage Water heaters and 0.78 for
standard efficiency gas fired tankless water heaters up to 0.95 for the highest efficiency gas fired condensing tankless water
heaters. These numbers represent the range of new units however, not the range of existing units in stock. Review of AHRI
Directory suggests range of recovery efficiency ratings for new Gas DHW units of 70-87%. Average of existing units is estimated
at 78%.
For example, an efficient pre-rinse spray valve installed in a sit-down restaurant under the TOS program type,
with defaults from the calculation above would save:
ΔkW = 1,215.6 / ((64/60) * 365.25) * 0.0250
= 0.07800 kW
For example, an efficient pre-rinse spray valve installed under the TOS program type, with defaults from the
calculation above would save:
ΔTherms = 1.00 * (140 – 56.5) * 1.0 * 8.2 / 0.78 / 100,000 * 5,844.0
= 52.1 therms/yr
Filed with the Iowa Utilities Board on September 23, 2020, EEP-2018-0002

Iowa Energy Efficiency Statewide Technical Reference Manual –3.6.3 Pre-Rinse Spray Valve
Vol.3 Nonresidential Measures July 22, 2020 FINAL Page 287 of 410
PEAK GAS SAVINGS
Where:
ΔTherms = Natural gas energy savings, calculated above
Other variables as defined above.
WATER IMPACT DESCRIPTIONS AND CALCULATION
Custom calculation below, otherwise use deemed value of 5,844.0 gal/yr for TOS and 27,116.2 gal/yr for DI.
625
Where:
Flow
Base
= Flow rate (gal/min) of baseline pre-rinse spray valve
= Custom or if unknown, use 1.23 gpm for TOS
626
and 2.14 gpm for DI
627
Flow
EE
= Flow rate (gal/min) of efficient pre-rinse spray valve
= Custom or if unknown, use 0.98 gal/min
628
Other variables as defined above.
DEEMED O&M COST ADJUSTMENT CALCULATION
N/A
MEASURE CODE: NR-FSE-SPRY-V03-200101
SUNSET DATE: 1/1/2024
625
Algorithms and assumptions, except for flow rates, derived from ENERGY STAR Commercial Kitchen Equipment Savings
Calculator. See file Pre Rinse Spray Valve Calculations_06122019.xlsx.
626
Baseline for TOS programs is calculated using the maximum flow rate for each product class in 10 CFR 431.266, Energy
Efficiency Program for Certain Commercial and Industrial Equipment weighted by estimated 2018 shipments for each product
class from Table 3.6.1: U.S. DOE, “Technical Support Document: Energy Efficiency Program for Consumer Products and
Commercial and Industrial Equipment: Commercial Prerinse Spray Valves,” December 2015.
627
Average flow rate of spray valve replaced through direct install programs from DNV-GL, “Impact Evaluation of National Grid
Rhode Island C&I Prescriptive Gas Pre-Rinse Spray Valve Measure – Final Report,” September 30, 2014, page 6-6.
628
A new pre-rinse spray valve is assumed to be 20% more efficient than the federal standard.
For example, an efficient pre-rinse spray valve installed under the TOS program type, with defaults from the
calculation above would save:
ΔPeakTherms = 52.1 / 365.25
= 0.1437 therms/day
For example, an efficient pre-rinse spray valve, installed under the TOS program type, with defaults from the
calculation above would save:
WaterUse = (1.23 – 0.98) * 64 * 365.25
= 5,844.0 gal/yr
Filed with the Iowa Utilities Board on September 23, 2020, EEP-2018-0002

Iowa Energy Efficiency Statewide Technical Reference Manual –3.6.4 Infrared Upright Broiler
Vol.3 Nonresidential Measures July 22, 2020 FINAL Page 288 of 410
3.6.4. Infrared Upright Broiler
DESCRIPTION
This measure applies to new natural gas fired high efficiency upright broilers utilizing infrared burners and installed
in a commercial kitchen. Upright broilers are heavy-duty, freestanding overfired broilers. Infrared broilers move
heat faster and carry a higher heat intensity than non-infrared broilers.
This measure was developed to be applicable to the following program types: TOS
DEFINITION OF EFFICIENT EQUIPMENT
To qualify for this measure, the installed equipment must be a new natural gas upright broiler with infrared burners
and an efficiency rating that meets the minimum standards according to utility program requirements.
DEFINITION OF BASELINE EQUIPMENT
The baseline equipment is a new natural gas upright broiler without infrared burners.
DEEMED LIFETIME OF EFFICIENT EQUIPMENT
The expected measure life is assumed to be 10 years.
629
DEEMED MEASURE COST
The incremental capital cost for this measure is $5,900.
630
LOADSHAPE
Loadshape NRGC01 - Nonresidential Gas Cooking – Restaurant
Algorithm
CALCULATION OF SAVINGS
ELECTRIC ENERGY SAVINGS
N/A
SUMMER COINCIDENT PEAK DEMAND SAVINGS
N/A
NATURAL GAS ENERGY SAVINGS
Custom calculation below, otherwise use deemed value of 2.7 therms / MBtu/hr input.
Where:
629
Measure life from Nicor Gas Energy Efficiency Plan 2011-2014. Revised Plan Filed Pursuant to Order Docket 10-0562, May
27, 2011
630
Incremental cost from Nicor Gas Energy Efficiency Plan 2011-2014. Revised Plan Filed Pursuant to Order Docket 10-0562,
May 27, 2011
Filed with the Iowa Utilities Board on September 23, 2020, EEP-2018-0002

Iowa Energy Efficiency Statewide Technical Reference Manual –3.6.4 Infrared Upright Broiler
Vol.3 Nonresidential Measures July 22, 2020 FINAL Page 289 of 410
InputRate
Base
= Rated energy input rate of baseline upright broiler (Btu/hr)
= 95,000 Btu/hr
631
InputRate
EE
= Rated energy input rate of infrared upright broiler (Btu/hr)
= Custom or if unknown, use 82,333 Btu/hr
632
Duty = Duty cycle of upright broiler (%)
= Custom or if unknown, use 70%
633
Hours = Typical operating hours of upright broiler
= Custom or if unknown, use 2,496 hours
634
100,000 = Btu to therms conversion factor
1,000 = Btu to Mbtu conversion factor
PEAK GAS SAVINGS
Where:
ΔTherms = Natural gas energy savings, calculated above
Days = Annual days of operation
= Custom or if unknown, use 312 days per year
635
WATER IMPACT DESCRIPTIONS AND CALCULATION
N/A
DEEMED O&M COST ADJUSTMENT CALCULATION
N/A
631
Median rated energy input for upright broilers from FSTC Broiler Technology Assessment, Table 4.3
http://www.fishnick.com/equipment/techassessment/4_broilers.pdf
632
Infrared energy input rate calculated based on baseline energy input rate of 95,000 Btu/hr, baseline cooking efficiency of
30%, and infrared cooking efficiency of 34%
633
Duty cycle from Food Service Technology Center Broiler Technical Assessment, Table 4.3
634
Typical operating hours based on broiler operating schedule of 8 hours per day, 6 days per week, 52 weeks per year,
provided in Food Service Technology Center Broiler Technical Assessment, Table 4.3
635
Based on broiler operating schedule of 8 hours per day, 6 days per week, 52 weeks per year, provided in Food Service
Technology Center Broiler Technical Assessment, Table 4.3
For example, an infrared upright broiler with default values from the algorithm above would save:
ΔTherms = [(95,000 – 82,333) *(0.70 * 2,496) / 100,000] / (82,333 / 1,000)
= 2.7 therms/ MBtu/hr input
For example, an infrared upright broiler with default values from the calculation above would save:
ΔPeakTherms = 2.7 / 312
= 0.0087 therms/MBtu/hr input/day
Filed with the Iowa Utilities Board on September 23, 2020, EEP-2018-0002

Iowa Energy Efficiency Statewide Technical Reference Manual –3.6.4 Infrared Upright Broiler
Vol.3 Nonresidential Measures July 22, 2020 FINAL Page 290 of 410
MEASURE CODE: NR-FSE-IRUB-V01-170101
SUNSET DATE: 1/1/2022
Filed with the Iowa Utilities Board on September 23, 2020, EEP-2018-0002

Iowa Energy Efficiency Statewide Technical Reference Manual –3.6.5 Infrared Salamander Broiler
Vol.3 Nonresidential Measures July 22, 2020 FINAL Page 291 of 410
3.6.5. Infrared Salamander Broiler
DESCRIPTION
This measure applies to new natural gas fired high efficiency salamander broilers utilizing infrared burners installed
in a commercial kitchen. Salamander broilers are medium-input overfired broilers that are typically mounted on
the backshelf of a range. Infrared broilers move heat faster and carry a higher heat intensity than non-infrared
broilers.
This measure was developed to be applicable to the following program types: TOS.
DEFINITION OF EFFICIENT EQUIPMENT
To qualify for this measure, the installed equipment must be a new natural gas fired salamander broiler with infrared
burners and an efficiency rating that meets the minimum standards according to utility program requirements.
DEFINITION OF BASELINE EQUIPMENT
The baseline equipment is a new natural gas fired salamander broiler without infrared burners.
DEEMED LIFETIME OF EFFICIENT EQUIPMENT
The expected measure life is assumed to be 12 years.
636
DEEMED MEASURE COST
The incremental capital cost for this measure is $1,000.
637
LOADSHAPE
Loadshape NRGC01 - Nonresidential Gas Cooking – Restaurant
Algorithm
CALCULATION OF SAVINGS
ELECTRIC ENERGY SAVINGS
N/A
SUMMER COINCIDENT PEAK DEMAND SAVINGS
N/A
NATURAL GAS ENERGY SAVINGS
Custom calculation below, otherwise use deemed value of 9.7 therms / MBtu/hr input.
636
Measure life from Nicor Gas Energy Efficiency Plan 2011-2014. Revised Plan Filed Pursuant to Order Docket 10-0562, May
27, 2011
637
Incremental cost from Nicor Gas Energy Efficiency Plan 2011-2014. Revised Plan Filed Pursuant to Order Docket 10-0562,
May 27, 2011
Filed with the Iowa Utilities Board on September 23, 2020, EEP-2018-0002

Iowa Energy Efficiency Statewide Technical Reference Manual –3.6.5 Infrared Salamander Broiler
Vol.3 Nonresidential Measures July 22, 2020 FINAL Page 292 of 410
Where:
InputRate
Base
= Rated energy input rate of baseline salamander broiler (Btu/hr)
= 38,500 Btu/hr
638
InputRate
EE
= Rated energy input rate of infrared salamander broiler (Btu/hr)
= Custom or if unknown, use 24,750 Btu/hr
639
Duty = Duty cycle of salamander broiler (%)
= Custom or if unknown, use 70%
640
Hours = Typical operating hours of salamander broiler
= Custom or if unknown, use 2,496 hours
641
100,000 = Btu to therms conversion factor
1,000 = Btu to Mbtu conversion factor
PEAK GAS SAVINGS
Where:
ΔTherms = Natural gas energy savings, calculated above
Days = Annual days of operation
= Custom or if unknown, use 312 days per year
642
WATER IMPACT DESCRIPTIONS AND CALCULATION
N/A
638
Median rated energy input for salamander broilers from FSTC Broiler Technology Assessment, Table 4.3
http://www.fishnick.com/equipment/techassessment/4_broilers.pdf
639
Calculated energy input rate based on baseline energy input rate of 38,500 Btu/hr, baseline cooking efficiency of 22.5%, and
infrared cooking efficiency of 35%
640
Duty cycle from Food Service Technology Center Broiler Technical Assessment, Table 4.3
641
Typical operating hours based on broiler operating schedule of 8 hours per day, 6 days per week, 52 weeks per year,
provided in Food Service Technology Center Broiler Technical Assessment, Table 4.3
642
Based on broiler operating schedule of 8 hours per day, 6 days per week, 52 weeks per year, provided in Food Service
Technology Center Broiler Technical Assessment, Table 4.3
For example, an infrared salamander broiler with default values from the algorithm above would save:
ΔTherms = [(38,500 – 24,750) *(0.70 * 2,496) / 100,000] / (24,750 / 1,000)
= 9.7 therms/ MBtu/hr input
For example, an infrared salamander broiler with default values from the calculation above would save:
ΔPeakTherms = 9.7 / 312
= 0.0311 therms/MBtu/hr input/day
Filed with the Iowa Utilities Board on September 23, 2020, EEP-2018-0002

Iowa Energy Efficiency Statewide Technical Reference Manual –3.6.5 Infrared Salamander Broiler
Vol.3 Nonresidential Measures July 22, 2020 FINAL Page 293 of 410
DEEMED O&M COST ADJUSTMENT CALCULATION
N/A
MEASURE CODE: NR-FSE-IRBL-V01-170101
SUNSET DATE: 1/1/2022
Filed with the Iowa Utilities Board on September 23, 2020, EEP-2018-0002

Iowa Energy Efficiency Statewide Technical Reference Manual –3.6.6 Infrared Charbroiler
Vol.3 Nonresidential Measures July 22, 2020 FINAL Page 294 of 410
3.6.6. Infrared Charbroiler
DESCRIPTION
This measure applies to new natural gas fired charbroilers that utilize infrared burners installed in a commercial
kitchen. Charbroilers cook food in a grid placed over a radiant heat source. Infrared broilers move heat faster and
carry a higher heat intensity than non-infrared broilers.
This measure was developed to be applicable to the following program types: TOS.
DEFINITION OF EFFICIENT EQUIPMENT
To qualify for this measure, the installed equipment must be a new natural gas charbroiler with infrared burners and
an efficiency rating that meets the minimum standards according to utility program requirements.
DEFINITION OF BASELINE EQUIPMENT
The baseline equipment is a new natural gas charbroiler without infrared burners.
DEEMED LIFETIME OF EFFICIENT EQUIPMENT
The expected measure life is assumed to be 12 years.
643
DEEMED MEASURE COST
The incremental capital cost for this measure is $2,200.
644
LOADSHAPE
Loadshape NRGC01 - Nonresidential Gas Cooking – Restaurant
Algorithm
CALCULATION OF SAVINGS
ELECTRIC ENERGY SAVINGS
N/A
SUMMER COINCIDENT PEAK DEMAND SAVINGS
N/A
NATURAL GAS ENERGY SAVINGS
Custom calculation below, otherwise use deemed value of 8.4 therms / MBtu/hr input.
645
Where:
PreheatEnergy = (PreheatRate
Base
* Preheats * PreheatTime / 60) - (PreheatRate
EE
* Preheats *
643
Measure life from Food Service Technology Center Gas Broiler Life-Cycle Cost Calculator,
https://caenergywise.com/calculators/natural-gas-conveyor-broilers/#calc
644
Nicor Gas Energy Efficiency Plan 2011-2014. Revised Plan Filed Pursuant to Order Docket 10-0562
645
Assumptions derived from Food Service Technology Center Gas Broiler Life-Cycle Cost Calculator and from FSTC Broiler
Technology Assessment, http://www.fishnick.com/equipment/techassessment/4_broilers.pdf
Filed with the Iowa Utilities Board on September 23, 2020, EEP-2018-0002

Iowa Energy Efficiency Statewide Technical Reference Manual –3.6.6 Infrared Charbroiler
Vol.3 Nonresidential Measures July 22, 2020 FINAL Page 295 of 410
PreheatTime / 60)
ΔCookingEnergy = (InputRate
Base
- InputRate
EE
) * Hours
Where:
Days = Annual days of operation
= Custom or if unknown, use 312 days per year
646
100,000 = Btu to therms conversion factor
1,000 = Btu to MBtu conversion factor
PreheatRate
Base
= Preheat energy rate of baseline charbroiler
= 64,000 Btu/hr
PreheatRate
EE
= Preheat energy rate of infrared charbroiler
= Custom or if unknown, use 54,000 Btu/hr
Preheats = Number of preheats per day
= Custom or if unknown, use 1 preheat per day
PreheatTime = Length of one preheat
= Custom or if unknown, use 15 minutes per preheat
647
60 = Minutes to hours conversion factor
InputRate
Base
= Input energy rate of baseline charbroiler
= 128,000 Btu/hr
InputRate
EE
= Input energy rate of infrared charbroiler
= Custom or if unknown, use 96,000 Btu/hr
Hours = Average daily hours of operation
= Custom or if unknown, use 8 hours per day
PEAK GAS SAVINGS
646
Typical annual operating time from FSTC Broiler Technology Assessment, Table 4.3
647
Typical preheat time from FSTC Broiler Technology Assessment
For example, an infrared charbroiler with default values from the calculation above would save:
ΔTherms = [(ΔPreheatEnergy + ΔCookingEnergy) * Days /100,000] / (InputRate
EE
/1,000)
Where:
ΔPreheatEnergy = (64,000 * 1 * 15 / 60) - (54,000 * 1 * 15 / 60)
= 2,500 Btu/day
ΔCookingEnergy = (128,000 – 96,000) * 8
= 256,000 Btu/day
ΔTherms = [(2,500 + 256,000) * 312 / 100,000] / (96,000/1,000)
= 8.4 therms/ MBtu/hr input
Filed with the Iowa Utilities Board on September 23, 2020, EEP-2018-0002

Iowa Energy Efficiency Statewide Technical Reference Manual –3.6.6 Infrared Charbroiler
Vol.3 Nonresidential Measures July 22, 2020 FINAL Page 296 of 410
Where:
ΔTherms = Natural gas energy savings, calculated above
Other variables as defined above.
WATER IMPACT DESCRIPTIONS AND CALCULATION
N/A
DEEMED O&M COST ADJUSTMENT CALCULATION
N/A
MEASURE CODE: NR-FSE-IRCB-V01-170101
SUNSET DATE: 1/1/2022
For example, an infrared charbroiler with default values from the calculation above would save:
ΔPeakTherms = 8.4 / 312
= 0.0269 therms/MBtu/hr input/day
Filed with the Iowa Utilities Board on September 23, 2020, EEP-2018-0002
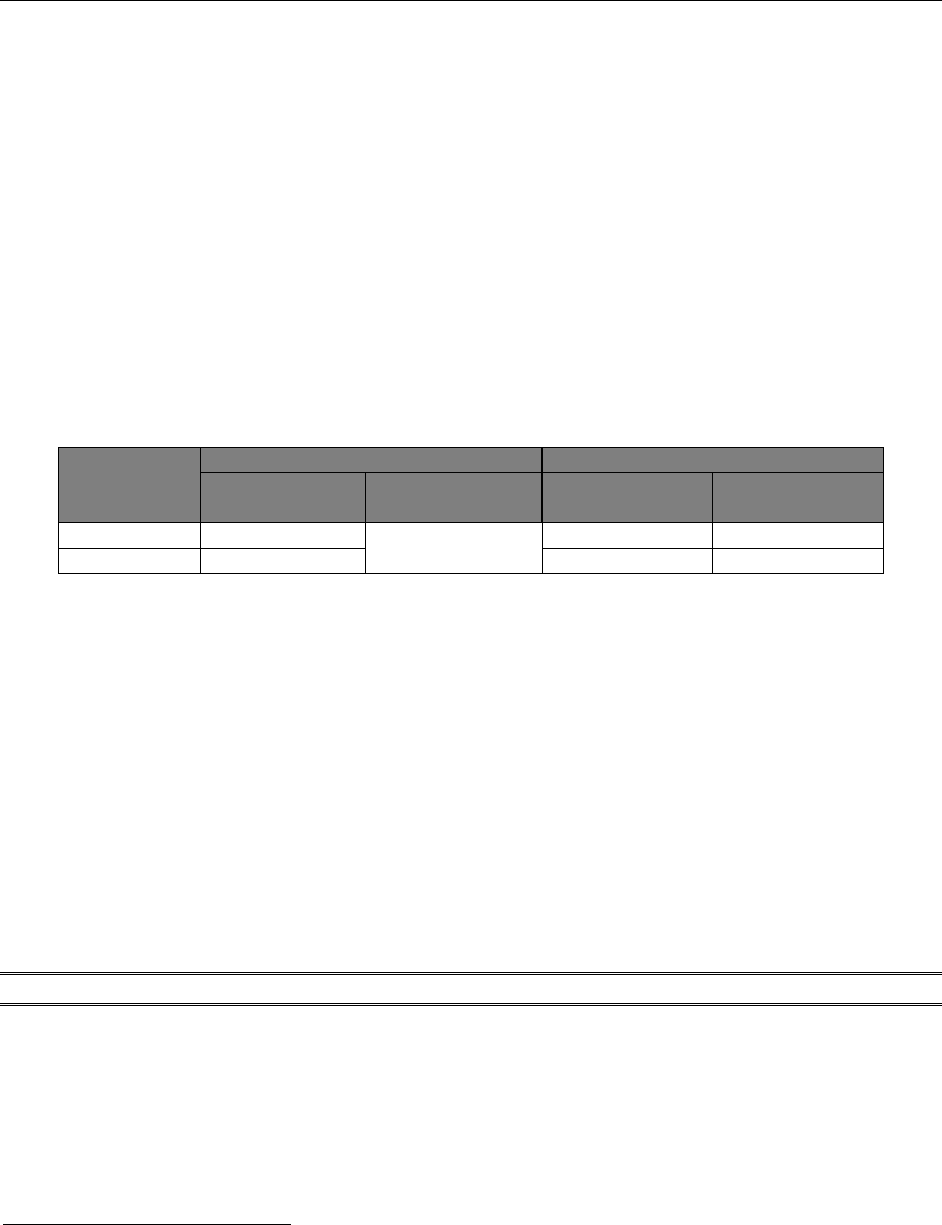
Iowa Energy Efficiency Statewide Technical Reference Manual –3.6.7 Convection Oven
Vol.3 Nonresidential Measures July 22, 2020 FINAL Page 297 of 410
3.6.7. Convection Oven
DESCRIPTION
This measure applies to electric or natural gas fired ENERGY STAR convection ovens installed in a commercial kitchen.
Convection ovens are general purpose ovens that use fans to circulate hot, dry air over the food surface. ENERGY
STAR certified convection ovens are approximately 20% more efficient than standard ovens.
This measure was developed to be applicable to the following program types: TOS.
DEFINITION OF EFFICIENT EQUIPMENT
To qualify for this measure, the installed equipment must be an ENERGY STAR certified convection oven meeting
idle energy rate (kW or Btu/hr)) and cooking efficiency (%) limits, as determined by both fuel type and oven capacity
(full size versus half size).
ENERGY STAR Requirements (Version 2.1, Effective January 1, 2014)
Oven Capacity
Electric Efficiency Requirements
Natural Gas Efficiency Requirements
Idle Energy Rate
Cooking Efficiency
Consumption
Idle Energy Rate
Cooking Efficiency
Consumption
Full Size
≤ 1.60 kW
≥ 71%
≤ 12,000 Btu/hr
≥ 46%
Half Size
≤ 1.00 kW
N/A
N/A
DEFINITION OF BASELINE EQUIPMENT
The baseline equipment is a new electric or natural gas convection oven that is not ENERGY STAR certified.
DEEMED LIFETIME OF EFFICIENT EQUIPMENT
The expected measure life is assumed to be 12 years.
648
DEEMED MEASURE COST
The incremental capital cost for this measure is $400.
649
LOADSHAPE
Loadshape NRE02 - Nonresidential Electric Cooking – Restaurant
Loadshape NRGC01 - Nonresidential Gas Cooking – Restaurant
Algorithm
CALCULATION OF SAVINGS
ELECTRIC ENERGY SAVINGS
Custom calculation for an electric convection oven below, otherwise use deemed value of 1,938.5 kWh for full-size
ovens and 192.1 kWh for half-size ovens.
650
648
Lifetime from ENERGY STAR Commercial Kitchen Equipment Savings Calculator, which cites reference as “FSTC research on
available models, 2009”
https://www.energystar.gov/sites/default/files/asset/document/commercial_kitchen_equipment_calculator.xlsx
649
Measure cost from 2014-2023 Iowa Statewide Assessment of Energy Efficiency Potential
650
Algorithms and assumptions derived from ENERGY STAR Commercial Kitchen Equipment Savings Calculator
Filed with the Iowa Utilities Board on September 23, 2020, EEP-2018-0002

Iowa Energy Efficiency Statewide Technical Reference Manual –3.6.7 Convection Oven
Vol.3 Nonresidential Measures July 22, 2020 FINAL Page 298 of 410
Where:
ΔIdleEnergy = (IdleRate
Base
* (Hours - FoodCooked/Production
Base
)) - (IdleRate
ESTAR
* (Hours -
FoodCooked/Production
ESTAR
))
ΔCookingEnergy = (FoodCooked * EFOOD/ Eff
Base
) - (FoodCooked * EFOOD/ Eff
ESTAR
)
Where:
Hours = Average daily hours of operation
= Custom or if unknown, use 12 hours per day
Days = Annual days of operation
= Custom or if unknown, use 365.25 days per year
1,000 = Wh to kWh conversion factor
FoodCooked = Food cooked per day
= Custom or if unknown, use 100 pounds
Production
Base
= Production capacity of baseline electric convection oven
= 90 lb/hr for full-size ovens and 45 lb/hr for half-size ovens
Production
ESTAR
= Production capacity of ENERGY STAR electric convection oven
= Custom or if unknown, use 90 lb/hr for full-size ovens and 50 lb/hr for half-size ovens
IdleRate
Base
= Idle energy rate of baseline electric convection oven
= 2,000 W for full-size ovens and 1,030 W for half-size ovens
IdleRate
ESTAR
= Idle energy rate of ENERGY STAR electric convection oven
= Custom or if unknown, use 1,600 for full-size ovens and 1,000 for half-size ovens
EFOOD = ASTM energy to food
= 73.2 Wh/lb
Eff
Base
= Cooking efficiency of baseline electric convection oven
= 65% for full-size ovens and 68% for half-size ovens
Eff
ESTAR
= Cooking efficiency of ENERGY STAR electric convection oven
= Custom or if unknown, use 71% for both full-size and half-size ovens
For example, an ENERGY STAR full-size electric convection oven with default values from the algorithm above
would save:
ΔkWh = (ΔIdleEnergy + ΔCookingEnergy) * Days /1,000
Where:
ΔIdleEnergy = (2,000 * (12 – 100 / 90)) - (1,600 * (12 – 100 / 90))
= 4,356 Wh
ΔCookingEnergy = (100 * 73.2/ 0.65) - (100 * 73.2/ 0.71)
= 952 Wh
ΔkWh = (4,356 + 952) * 365.25 / 1,000
= 1,938.5 kWh
Filed with the Iowa Utilities Board on September 23, 2020, EEP-2018-0002

Iowa Energy Efficiency Statewide Technical Reference Manual –3.6.7 Convection Oven
Vol.3 Nonresidential Measures July 22, 2020 FINAL Page 299 of 410
SUMMER COINCIDENT PEAK DEMAND SAVINGS
Where:
kWh = Electric energy savings, calculated above
CF = Summer peak coincidence factor
= 0.787
Other variables as defined above.
NATURAL GAS ENERGY SAVINGS
Custom calculation for a natural gas convection oven below, otherwise use deemed value of 129.4 therms/yr.
651
Where:
ΔIdleEnergy = (IdleRate
Base
* (Hours - FoodCooked/Production
Base
)) - (IdleRate
ESTAR
* (Hours -
FoodCooked/Production
ESTAR
))
ΔCookingEnergy = (FoodCooked * EFOOD/ Eff
Base
) - (FoodCooked * EFOOD/ Eff
ESTAR
)
Where:
100,000 = Btu to therms conversion factor
FoodCooked = Food cooked per day
= Custom or if unknown, use 100 pounds
Production
Base
= Production capacity of baseline gas convection oven
= 83 lb/hr
Production
ESTAR
= Production capacity of ENERGY STAR gas convection oven
= Custom or if unknown, use 86 lb/hr
IdleRate
Base
= Idle energy rate of baseline gas convection oven
= 15,100 Btu/hr
IdleRate
ESTAR
= Idle energy rate of ENERGY STAR gas convection oven
= Custom or if unknown, use 12,000 Btu/hr
EFOOD = ASTM energy to food
= 250 Btu/lb
Eff
Base
= Cooking efficiency of baseline gas convection oven
= 44%
651
Algorithms and assumptions derived from ENERGY STAR Commercial Kitchen Equipment Savings Calculator
For example, an ENERGY STAR full-size electric convection oven with default values from the algorithm above
would save:
ΔkW = 1,938.5 / (12 * 365.25) * 0.787
= 0.3481 kW
Filed with the Iowa Utilities Board on September 23, 2020, EEP-2018-0002

Iowa Energy Efficiency Statewide Technical Reference Manual –3.6.7 Convection Oven
Vol.3 Nonresidential Measures July 22, 2020 FINAL Page 300 of 410
Eff
ESTAR
= Cooking efficiency of ENERGY STAR gas convection oven
= Custom or if unknown, use 46%
Other variables as defined above.
PEAK GAS SAVINGS
Where:
ΔTherms = Natural gas energy savings, calculated above
Other variables as defined above.
WATER IMPACT DESCRIPTIONS AND CALCULATION
N/A
DEEMED O&M COST ADJUSTMENT CALCULATION
N/A
MEASURE CODE: NR-FSE-ESCV-V01-170101
SUNSET DATE: 1/1/2024
For example, an ENERGY STAR gas convection oven with default values from the algorithm above would save:
ΔTherms = (ΔIdleEnergy + ΔCookingEnergy) * Days /100,000
Where:
ΔIdleEnergy = (15,100 * (12 - 100 / 83)) - (12,000 * (12 - 100 / 86))
= 32,960 Btu/day
ΔCookingEnergy = (100 * 250/ 0.44) - (100 * 250/ 0.46)
=2,470 Btu/day
ΔTherms = (32,960 + 2,470) * 365.25 / 100,000
= 129.4 therms/yr
For example, an ENERGY STAR gas convection with default values from the algorithm above would save:
ΔPeakTherms = 129.4 / 365.25
= 0.3543 therms/day
Filed with the Iowa Utilities Board on September 23, 2020, EEP-2018-0002

Iowa Energy Efficiency Statewide Technical Reference Manual –3.6.8 Conveyor Oven
Vol.3 Nonresidential Measures July 22, 2020 FINAL Page 301 of 410
3.6.8. Conveyor Oven
DESCRIPTION
This measure applies to a natural gas fired high efficiency conveyor oven installed in a commercial kitchen.
Conveyor ovens are available using four different heating processes: infrared, natural convection with a ceramic
baking hearth, forced convection or air impingement, or a combination of infrared and forced convection. Conveyor
ovens are typically used for producing a limited number of products with similar cooking requirements at high
production rates.
Some manufacturers offer an air-curtain feature at either end of the cooking chamber that helps to keep the heated
air inside the conveyor oven. The air curtain operates as a virtual oven wall and helps reduce both the idle energy
of the oven and the resultant heat gain to the kitchen.
This measure was developed to be applicable to the following program types: TOS.
DEFINITION OF EFFICIENT EQUIPMENT
To qualify for this measure, the installed equipment must be a natural gas conveyor oven with cooking efficiency
and idle energy rates that meet the minimum standards according to utility program requirements.
DEFINITION OF BASELINE EQUIPMENT
The baseline equipment is a new, standard, natural gas conveyor oven.
DEEMED LIFETIME OF EFFICIENT EQUIPMENT
The expected measure life is assumed to be 12 years.
652
DEEMED MEASURE COST
The incremental capital cost for this measure is $1800.
653
LOADSHAPE
Loadshape NRGC01 - Nonresidential Gas Cooking – Restaurant
Algorithm
CALCULATION OF SAVINGS
ELECTRIC ENERGY SAVINGS
N/A
SUMMER COINCIDENT PEAK DEMAND SAVINGS
N/A
NATURAL GAS ENERGY SAVINGS
652
Measure life from Food Service Technology Center Gas Conveyor Oven Life-Cycle Cost Calculator
https://caenergywise.com/calculators/natural-gas-conveyor-ovens/#calc
653
Nicor Gas Energy Efficiency Plan 2011-2014. Revised Plan Filed Pursuant to Order Docket 10-0562, May 27, 2011
Filed with the Iowa Utilities Board on September 23, 2020, EEP-2018-0002

Iowa Energy Efficiency Statewide Technical Reference Manual –3.6.8 Conveyor Oven
Vol.3 Nonresidential Measures July 22, 2020 FINAL Page 302 of 410
Custom calculation below, otherwise use deemed value of 594.1 therms/yr.
654
Where:
PreheatEnergy = (PreheatEnergy
Base
* Preheats) - (PreheatEnergy
EE
* Preheats)
ΔIdleEnergy = IdleRate
Base
* (Hours – (FoodCooked/Production
Base
) – (Preheats * PreheatTime / 60)) -
IdleRate
EE
* (Hours – (FoodCooked/Production
EE
) – (Preheats * PreheatTime / 60))
ΔCookingEnergy = (FoodCooked * EFOOD/ Eff
Base
) - (FoodCooked * EFOOD/ Eff
EE
)
Where:
Days = Annual days of operation
= Custom or if unknown, use 312 days per year
100,000 = Btu to therms conversion factor
PreheatEnergy
Base
= Preheat energy of baseline oven
= 35,000 Btu
PreheatEnergy
EE
= Preheat energy of efficient oven
= Custom or if unknown, use 18,000 Btu
Preheats = Number of preheats per day
= Custom or if unknown, use 1 preheat per day
PreheatTime = Length of one preheat
= Custom or if unknown, use 15 minutes per preheat
655
60 = Minutes to hours conversion factor
IdleRate
Base
= Idle energy rate of baseline oven
= 70,000 Btu/hr
IdleRate
EE
= Idle energy rate of efficient oven
= Custom or if unknown, use 57,000 Btu/hr
Hours = Average daily hours of operation
= Custom or if unknown, use 10 hours per day
FoodCooked = Number of pizzas cooked per day
= Custom or if unknown, use 250 pizzas per day
Production
Base
= Production capacity of baseline oven
= 150 pizzas per hour
Production
EE
= Production capacity of efficient oven
= Custom or if unknown, use 220 pizzas per hour
EFOOD = ASTM energy to food
654
Assumptions derived from Food Service Technology Center Gas Conveyor Oven Life-Cycle Cost Calculator and from FSTC
Oven Technology Assessment, http://www.fishnick.com/equipment/techassessment/7_ovens.pdf.
655
Engineering assumption
Filed with the Iowa Utilities Board on September 23, 2020, EEP-2018-0002

Iowa Energy Efficiency Statewide Technical Reference Manual –3.6.8 Conveyor Oven
Vol.3 Nonresidential Measures July 22, 2020 FINAL Page 303 of 410
= 170 Btu/pizza
Eff
Base
= Cooking efficiency of baseline oven
= 20%
Eff
EE
= Cooking efficiency of efficient oven
= Custom or if unknown, use 42%
PEAK GAS SAVINGS
Where:
ΔTherms = Natural gas energy savings, calculated above
Days = Annual days of operation
= Custom or if unknown, use 312 days per year
WATER IMPACT DESCRIPTIONS AND CALCULATION
N/A
DEEMED O&M COST ADJUSTMENT CALCULATION
N/A
MEASURE CODE: NR-FSE-CVOV-V03-200101
SUNSET DATE: 1/1/2022
For example, an efficient conveyor oven with default values from the algorithm above would save:
ΔTherms = (ΔPreheatEnergy + ΔIdleEnergy + ΔCookingEnergy) * Days /100,000
Where:
ΔPreheatEnergy = (35,000 * 1) - (18,000 * 1)
= 17,000 Btu/day
ΔIdleEnergy = 70,000* (10 - (250 / 150) - (1 * 15 / 60)) - 57,000 * (10 - (250 / 220) - (1 * 15 / 60))
= 74,856 Btu/day
ΔCookingEnergy = (250 * 170/ 0.20) - (250 * 170/ 0.42)
= 111,310 Btu/day
ΔTherms = (17,000 + 74,856 +111,310) * 312 / 100,000
= 633.9 therms/yr
For example, an efficient conveyor oven with default values from the algorithm above would save:
ΔPeakTherms = 633.9 / 312
= 2.032 therms/day
Filed with the Iowa Utilities Board on September 23, 2020, EEP-2018-0002

Iowa Energy Efficiency Statewide Technical Reference Manual –3.6.9 Infrared Rotisserie Oven
Vol.3 Nonresidential Measures July 22, 2020 FINAL Page 304 of 410
3.6.9. Infrared Rotisserie Oven
DESCRIPTION
This measure applies to new natural gas fired high efficiency rotisserie ovens utilizing infrared burners and installed
in a commercial kitchen. Rotisserie ovens are designed for batch cooking, with individual spits arranged on a rotating
wheel or drum within an enclosed cooking cavity. Infrared ovens move heat faster and carry a higher heat intensity
than non-infrared ovens.
This measure was developed to be applicable to the following program types: TOS.
DEFINITION OF EFFICIENT EQUIPMENT
To qualify for this measure, the installed equipment must be a new natural gas rotisserie oven with infrared burners
and an efficiency rating that meets the minimum standards according to utility program requirements.
DEFINITION OF BASELINE EQUIPMENT
The baseline equipment is a new natural gas rotisserie oven without infrared burners.
DEEMED LIFETIME OF EFFICIENT EQUIPMENT
The expected measure life is assumed to be 12 years.
656
DEEMED MEASURE COST
The incremental capital cost for this measure is $2,700.
657
LOADSHAPE
Loadshape NRGC01 - Nonresidential Gas Cooking – Restaurant
Algorithm
CALCULATION OF SAVINGS
ELECTRIC ENERGY SAVINGS
N/A
SUMMER COINCIDENT PEAK DEMAND SAVINGS
N/A
NATURAL GAS ENERGY SAVINGS
Custom calculation below, otherwise use deemed value of 3.6 therms / MBtu/hr input.
656
Measure life from Nicor Gas Energy Efficiency Plan 2011-2014. Revised Plan Filed Pursuant to Order Docket 10-0562, May
27, 2011
657
Incremental cost from Nicor Gas Energy Efficiency Plan 2011-2014. Revised Plan Filed Pursuant to Order Docket 10-0562,
May 27, 2011
Filed with the Iowa Utilities Board on September 23, 2020, EEP-2018-0002

Iowa Energy Efficiency Statewide Technical Reference Manual –3.6.9 Infrared Rotisserie Oven
Vol.3 Nonresidential Measures July 22, 2020 FINAL Page 305 of 410
Where:
InputRate
Base
= Energy input rate of baseline rotisserie oven (Btu/hr)
= 50,000 Btu/hr
658
InputRate
EE
= Energy input rate of infrared rotisserie oven (Btu/hr)
= Custom of if unknown, use 40,323 Btu/hr
659
Duty = Duty cycle of rotisserie oven (%)
= Custom or if unknown, use 60%
660
Hours = Typical operating hours of rotisserie oven
= Custom or if unknown, use 2,496 hours
661
100,000 = Btu to therms conversion factor
1,000 = Btu to Mbtu conversion factor
PEAK GAS SAVINGS
Where:
ΔTherms = Natural gas energy savings, calculated above
Days = Annual days of operation
= Custom or if unknown, use 312 days per year
662
WATER IMPACT DESCRIPTIONS AND CALCULATION
N/A
658
Median rated energy input for rotisserie ovens from FSTC Oven Technology Assessment, Table 7.2
http://www.fishnick.com/equipment/techassessment/7_ovens.pdf
659
Infrared energy input rate calculated based on baseline energy input rate of 50,000 Btu/hr, baseline cooking efficiency of
25%, and infrared cooking efficiency of 31%
660
Duty cycle from Food Service Technology Center Oven Technical Assessment, Table 7.2
661
Typical operating hours based on oven operating schedule of 8 hours per day, 6 days per week, 52 weeks per year, provided
in Food Service Technology Center Oven Technical Assessment, Table 7.2
662
Based on oven operating schedule of 8 hours per day, 6 days per week, 52 weeks per year, provided in Food Service
Technology Center Oven Technical Assessment, Table 7.2
For example, an infrared rotisserie oven with default values from the algorithm above would save:
ΔTherms = [(50,000 – 40,323) *(0.60 * 2,496) / 100,000] / (40,323 / 1,000)
= 3.6 therms/ MBtu/hr input
For example, an infrared rotisserie oven with default values from the calculation above would save:
ΔPeakTherms = 3.6 / 312
= 0.0115 therms/MBtu/hr input/day
Filed with the Iowa Utilities Board on September 23, 2020, EEP-2018-0002

Iowa Energy Efficiency Statewide Technical Reference Manual –3.6.9 Infrared Rotisserie Oven
Vol.3 Nonresidential Measures July 22, 2020 FINAL Page 306 of 410
DEEMED O&M COST ADJUSTMENT CALCULATION
N/A
MEASURE CODE: NR-FSE-IROV-V01-170101
SUNSET DATE: 1/1/2022
Filed with the Iowa Utilities Board on September 23, 2020, EEP-2018-0002

Iowa Energy Efficiency Statewide Technical Reference Manual –3.6.10 Commercial Steam Cooker
Vol.3 Nonresidential Measures July 22, 2020 FINAL Page 307 of 410
3.6.10. Commercial Steam Cooker
DESCRIPTION
This measure applies to electric or natural gas fired ENERGY STAR steam cookers installed in a commercial kitchen.
Commercial steam cookers contain compartments where steam energy is transferred to food by direct contact.
ENERGY STAR certified steam cookers have shorter cook times, higher production rates, and reduced heat loss due
to better insulation and more efficiency steam delivery.
This measure was developed to be applicable to the following program types: TOS.
DEFINITION OF EFFICIENT EQUIPMENT
To qualify for this measure, the installed equipment must be an ENERGY STAR certified steam cooker meeting idle
energy rate (kW or Btu/hr)) and cooking efficiency (%) limits, as determined by both fuel type and pan capacity.
ENERGY STAR Requirements (Version 1.2, Effective August 1, 2003)
Pan Capacity
Electric Efficiency Requirements
Natural Gas Efficiency Requirements
Idle Energy Rate
Cooking Efficiency
Idle Energy Rate
Cooking Efficiency
3-pan
≤ 400 W
≥ 50%
≤ 6,250 Btu/hr
≥ 38%
N/A
4-pan
≤ 530 W
≤ 8,350 Btu/hr
5-pan
≤ 670 W
≤ 10,400 Btu/hr
6-pan and larger
≤ 800 W
≤ 12,500 Btu/hr
DEFINITION OF BASELINE EQUIPMENT
The baseline equipment is a new electric or natural gas steam cooker that is not ENERGY STAR certified.
DEEMED LIFETIME OF EFFICIENT EQUIPMENT
The expected measure life is assumed to be 12 years.
663
DEEMED MEASURE COST
The incremental capital cost for this measure is $3,400 for electric steam cookers and $2,270 for gas steam
cookers.
664
LOADSHAPE
Loadshape NRE02 - Nonresidential Electric Cooking – Restaurant
Loadshape NRGC01 - Nonresidential Gas Cooking – Restaurant
Algorithm
CALCULATION OF SAVINGS
ELECTRIC ENERGY SAVINGS
663
Measure life from ENERGY STAR Commercial Kitchen Equipment Savings Calculator
http://www.energystar.gov/buildings/sites/default/uploads/files/commercial_kitchen_equipment_calculator.xlsx
664
Incremental costs from ENERGY STAR Commercial Kitchen Equipment Savings Calculator. Calculator cites EPA research using
AutoQuotes, July 2016.
Filed with the Iowa Utilities Board on September 23, 2020, EEP-2018-0002

Iowa Energy Efficiency Statewide Technical Reference Manual –3.6.10 Commercial Steam Cooker
Vol.3 Nonresidential Measures July 22, 2020 FINAL Page 308 of 410
Custom calculation for an electric steam cooker below, otherwise use deemed value from the table that follows.
665
Where:
ΔIdleEnergy = [((1 – SteamMode) *IdleRate
Base
+ SteamMode * Production
Base
* Pans
*EFOOD/Eff
Base
)* (Hours – FoodCooked/(Production
Base
* Pans))] - [((1 – SteamMode)
*IdleRate
ESTAR
+ SteamMode * Production
ESTAR
* Pans *EFOOD/Eff
ESTAR
)* (Hours –
FoodCooked/(Production
ESTAR
* Pans))]
ΔCookingEnergy = (FoodCooked * EFOOD/ Eff
Base
) - (FoodCooked * EFOOD/ Eff
ESTAR
)
Where:
Days = Annual days of operation
= Custom or if unknown, use 365.25 days per year
1,000 = Wh to kWh conversion factor
SteamMode = Time (%) in constant steam mode
= Custom or if unknown, use 40%
IdleRate
Base
= Idle energy rate (W) of baseline electric steam cooker
= Use value from table below as determined by pan capacity
666
IdleRate
ESTAR
= Idle energy rate (W) of ENERGY STAR electric steam cooker
= Custom or if unknown, use value from table below as determined by pan capacity
Idle Energy Rates of Electric Steam Cooker
Pan Capacity
IdleRate
Base
IdleRate
ESTAR
3
1,100
400
4
530
5
670
6
800
10
800
Production
Base
= Production capacity (lb/hr) per pan of baseline electric steam cooker
= 23.3 lb/hr
Production
ESTAR
= Production capacity (lb/hr) per pan of ENERGY STAR electric steam cooker
= Custom or if unknown, use 16.7 lb/hr
Pans = Number of pans per steam cooker
= Custom or if unknown, use 6 pans
EFOOD = ASTM energy to food
= 30.8 Wh/lb
665
Algorithms and assumptions derived from ENERGY STAR Commercial Kitchen Equipment Savings Calculator
666
Idle energy rate for baseline steam cookers is the average of rates provided by ENERGY STAR for steam generator and boiler-
based cookers
Filed with the Iowa Utilities Board on September 23, 2020, EEP-2018-0002

Iowa Energy Efficiency Statewide Technical Reference Manual –3.6.10 Commercial Steam Cooker
Vol.3 Nonresidential Measures July 22, 2020 FINAL Page 309 of 410
Eff
Base
= Cooking efficiency (%) of baseline electric steam cooker
667
= 28%
Eff
ESTAR
= Cooking efficiency (%) of ENERGY STAR electric steam cooker
= Custom or if unknown, use 50%
Hours = Average daily hours of operation
= Custom or if unknown, use 12 hours per day
FoodCooked = Food cooked per day (lbs)
= Custom or if unknown, use 100 pounds
Savings for all pan capacities are presented in the table below.
Energy Consumption of Electric Steam Cookers
Pan Capacity
kWh
Base
kWh
ESTAR
Savings (kWh)
3
18,438.9
7,637.6
10,801.3
4
23,018.6
9,784.1
13,234.5
5
27,563.8
11,953.8
15,609.9
6
32,091.7
14,100.1
17,991.6
10
50,134.5
21,384.3
28,750.1
Average
30,249.5
12,972.0
17,277.5
SUMMER COINCIDENT PEAK DEMAND SAVINGS
Where:
kWh = Electric energy savings, calculated above
CF = Summer peak coincidence factor
= 0.787
Other variables as defined above
667
Cooking efficiency for baseline steam cookers is the average of efficiencies provided by ENERGY STAR for steam generator
and boiler-based cookers
For example, an ENERGY STAR, 6-pan electric steam cooker with defaults from the calculation above would save:
ΔkWh = (ΔIdleEnergy + ΔCookingEnergy) * Days / 1,000
Where:
ΔIdleEnergy = [((1 – 0.40) *1,100
+ 0.40 * 23.3
* 6 *30.8/0.28)* (12 – 100/(23.3
* 6))] - [((1 – 0.40)
*800
+ 0.40 * 16.7
* 6 *30.8/0.50) * (12 – 100/(16.7
* 6))]
= 44,418 Wh
ΔCookingEnergy = (100 * 30.8/ 0.28) - (100 * 30.8/ 0.50)
= 4,840 Wh
ΔkWh = (44,418 + 4,840) * 365.25 /1,000
= 17,991.6 kWh
Filed with the Iowa Utilities Board on September 23, 2020, EEP-2018-0002

Iowa Energy Efficiency Statewide Technical Reference Manual –3.6.10 Commercial Steam Cooker
Vol.3 Nonresidential Measures July 22, 2020 FINAL Page 310 of 410
NATURAL GAS ENERGY SAVINGS
Custom calculation for a natural gas steam cooker below, otherwise use deemed value from the table that follows.
668
Where:
ΔIdleEnergy = [((1 – SteamMode) *IdleRate
Base
+ SteamMode * Production
Base
* Pans *EFOOD/Eff
Base
)*
(Hours – FoodCooked/(Production
Base
* Pans))] - [((1 – SteamMode) *IdleRate
ESTAR
+
SteamMode * Production
ESTAR
* Pans *EFOOD/Eff
ESTAR
)* (Hours –
FoodCooked/(Production
ESTAR
* Pans))]
ΔCookingEnergy = (FoodCooked * EFOOD/ Eff
Base
) - (FoodCooked * EFOOD/ Eff
ESTAR
)
Where:
100,000 = Btu to therms conversion factor
IdleRate
Base
= Idle energy rate (Btu/hr) of baseline gas steam cooker
= Use value from table below as determined by pan capacity
669
IdleRate
ESTAR
= Idle energy rate (Btu/hr) of ENERGY STAR gas steam cooker
= Custom or if unknown, use value from table below as determined by pan capacity
Idle Energy Rates of Gas Steam Cooker
Pan Capacity
IdleRate
Base
IdleRate
ESTAR
3
16,500
6,250
5
10,400
6
12,500
10
12,500
Production
Base
= Production capacity (lb/hr) per pan of baseline gas steam cooker
= 23.3 lb/hr
Production
ESTAR
= Production capacity (lb/hr) per pan of ENERGY STAR gas steam cooker
= Custom or if unknown, use 20 lb/hr
EFOOD = ASTM energy to food
= 105 Btu/lb
Eff
Base
= Cooking efficiency (%) of baseline gas steam cooker
670
668
Algorithms and assumptions derived from ENERGY STAR Commercial Kitchen Equipment Savings Calculator
669
Idle energy rate for baseline steam cookers is the average of rates provided by ENERGY STAR for steam generator and boiler-
based cookers
670
Cooking efficiency for baseline steam cookers is the average of efficiencies provided by ENERGY STAR for steam generator
and boiler-based cookers
For example, an ENERGY STAR, 6-pan electric steam cooker with defaults from the calculation above would save:
ΔkW = 17,991.6 / (12 * 365.25) * 0.787
= 3.2305 kW
Filed with the Iowa Utilities Board on September 23, 2020, EEP-2018-0002

Iowa Energy Efficiency Statewide Technical Reference Manual –3.6.10 Commercial Steam Cooker
Vol.3 Nonresidential Measures July 22, 2020 FINAL Page 311 of 410
= 16.5%
Eff
ESTAR
= Cooking efficiency (%) of ENERGY STAR gas steam cooker
= Custom or if unknown, use 38%
Other variables as defined above.
Savings for all pan capacities are presented in the table below.
Energy Consumption of Gas Steam Cookers
Pan Capacity
Therms
Base
Therms
ESTAR
Savings (Therms)
3
1,301.5
492.8
808.7
5
1,842.1
795.7
1,046.4
6
2,107.2
947.8
1,159.4
10
3,157.4
1,344.5
1,812.9
Average
1,996.0
845.0
1,150.0
PEAK GAS SAVINGS
Where:
ΔTherms = Natural gas energy savings, calculated above
Other variables as defined above
WATER IMPACT DESCRIPTIONS AND CALCULATION
Custom calculation below, otherwise use deemed value of 134,412.0 gallons per year.
671
Savings are the same for
electric and gas steam cookers.
Where:
671
Algorithms and assumptions derived from ENERGY STAR Commercial Kitchen Equipment Savings Calculator
For example, an ENERGY STAR, 6-pan gas steam cooker with defaults from the calculation above would save:
ΔTherms = (ΔIdleEnergy + ΔCookingEnergy) * Days / 100,000
Where:
ΔIdleEnergy = [((1 – 0.40) *16,500
+ 0.40 * 23.3
* 6 *105/0.165)* (12 – 100/(23.3
* 6))] - [((1 – 0.40)
*12,500
+ 0.40 * 20
* 6 *105/0.38)* (12 – 100/(20
* 6))]
= 281,434 Btu
ΔCookingEnergy = (100 * 105/ 0.17) - (100 * 105/ 0.38)
= 36,005 Btu
ΔTherms = (281,434 + 36,005) * 365.25 /100,000
= 1,159.4 therms
For example, an ENERGY STAR, 6-pan gas steam cooker with defaults from the calculation above would save:
ΔPeakTherms = 1,159.4 / 365.25
= 3.1743 therms/day
Filed with the Iowa Utilities Board on September 23, 2020, EEP-2018-0002

Iowa Energy Efficiency Statewide Technical Reference Manual –3.6.10 Commercial Steam Cooker
Vol.3 Nonresidential Measures July 22, 2020 FINAL Page 312 of 410
WaterUse
Base
= Water use (gal/hr) of baseline steam cooker
= 40 gal/hr
WaterUse
ESTAR
= Water use (gal/hr) of ENERGY STAR steam cooker
672
= Custom or if unknown, use 9.3 gal/hr
Other variables as defined above
DEEMED O&M COST ADJUSTMENT CALCULATION
N/A
MEASURE CODE: NR-FSE-STMC-V02-190101
SUNSET DATE: 1/1/2022
672
Water use for ENERGY STAR steam cookers is the average of water use values provided by ENERGY STAR for steam
generator and boiler-based cookers
For example, a steam cooker with defaults from the calculation above would save
ΔWaterUse = (40 – 9.3) * 12 * 365.25
= 134,412.0 gal/year
Filed with the Iowa Utilities Board on September 23, 2020, EEP-2018-0002

Iowa Energy Efficiency Statewide Technical Reference Manual –3.6.11 Fryer
Vol.3 Nonresidential Measures July 22, 2020 FINAL Page 313 of 410
3.6.11. Fryer
DESCRIPTION
This measure applies to electric or natural gas fired ENERGY STAR certified fryers installed in a commercial kitchen.
ENERGY STAR fryers offer shorter cook times and higher production rates through advanced burner and heat
exchanger designs. Fry pot insulation reduces standby losses, resulting in lower idle energy rates. Standard-sized
ENERGY STAR fryers are up to 30% more efficient, and large-vat ENERGY STAR fryers are up to 35% more efficient,
than standard fryers.
This measure was developed to be applicable to the following program types: TOS.
DEFINITION OF EFFICIENT EQUIPMENT
To qualify for this measure, the installed equipment must be an ENERGY STAR certified fryer meeting idle energy
rate (kW or Btu/hr)) and cooking efficiency (%) limits, as determined by both fuel type and fryer capacity (standard
versus large vat).
ENERGY STAR Requirements (Version 3.0, Effective October 1, 2016)
Fryer Capacity
Electric Efficiency Requirements
Natural Gas Efficiency Requirements
Idle Energy Rate
Cooking Efficiency
Idle Energy Rate
Cooking Efficiency
Standard Open Deep-Fat Fryer
≤ 800 W
≥ 83%
≤ 9,000 Btu/hr
≥ 50%
Large Vat Open Deep-Fat Fryer
≤ 1,100 W
≥ 80%
≤ 12,000 Btu/hr
DEFINITION OF BASELINE EQUIPMENT
The baseline equipment is a new electric or natural gas fryer that is not ENERGY STAR certified.
DEEMED LIFETIME OF EFFICIENT EQUIPMENT
The expected measure life is assumed to be 12 years.
673
DEEMED MEASURE COST
The incremental capital cost for this measure is $276 for standard electric, $1,150 for large vat electric, $1,860 for
standard gas, and $1,850 for large vat gas fryers.
674
LOADSHAPE
Loadshape NRE02 - Nonresidential Electric Cooking – Restaurant
Loadshape NRGC01 - Nonresidential Gas Cooking – Restaurant
Algorithm
CALCULATION OF SAVINGS
ELECTRIC ENERGY SAVINGS
Custom calculation for an electric fryer below, otherwise use deemed value of 3,128.2 kWh for standard fryers and
673
Lifetime from ENERGY STAR Commercial Kitchen Equipment Savings Calculator ,which cites reference as “FSTC research on
available models, 2009”
https://www.energystar.gov/sites/default/files/asset/document/commercial_kitchen_equipment_calculator.xlsx
674
Measure costs from ENERGY STAR Commercial Kitchen Equipment Savings Calculator, which cites reference as “EPA
research on available models using AutoQuotes, July 2016”
Filed with the Iowa Utilities Board on September 23, 2020, EEP-2018-0002

Iowa Energy Efficiency Statewide Technical Reference Manual –3.6.11 Fryer
Vol.3 Nonresidential Measures July 22, 2020 FINAL Page 314 of 410
2,537.9 kWh for large vat fryers.
675
Where:
ΔIdleEnergy = (IdleRate
Base
* (Hours – FoodCooked/Production
Base
))- (IdleRate
ESTAR
* (Hours –
FoodCooked/Production
ESTAR
))
ΔCookingEnergy = (FoodCooked * EFOOD/ Eff
Base
) - (FoodCooked * EFOOD/ Eff
ESTAR
)
Where:
Hours = Average daily hours of operation
= Custom or if unknown, use 16 hours per day for a standard fryer and 12 hours per day
for a large vat fryer
Days = Annual days of operation
= Custom or if unknown, use 365.25 days per year
1,000 = Wh to kWh conversion factor
FoodCooked = Food cooked per day
= Custom or if unknown, use 150 pounds
Production
Base
= Production capacity of baseline electric fryer
= 65 lb/hr for standard fryers and 100 lb/hr for large vat fryers
Production
ESTAR
= Production capacity of ENERGY STAR electric fryer
= Custom or if unknown, use 70 lb/hr for standard fryers and 110 lb/hr for large vat fryers
IdleRate
Base
= Idle energy rate of baseline electric fryer
= 1,200 W for standard fryers and 1,350 W for large vat fryers
IdleRate
ESTAR
= Idle energy rate of ENERGY STAR electric fryer
= Custom or if unknown, use 800 W for standard fryers and 1,100 for large vat fryers
EFOOD = ASTM energy to food
= 167 Wh/lb
Eff
Base
= Cooking efficiency of baseline electric fryer
= 75% for standard fryers and 70% for large vat fryers
Eff
ESTAR
= Cooking efficiency of ENERGY STAR electric fryer
= Custom or if unknown, use 83% for standard fryers and 80% for large vat fryers
675
Algorithms and assumptions derived from ENERGY STAR Commercial Kitchen Equipment Savings Calculator
Filed with the Iowa Utilities Board on September 23, 2020, EEP-2018-0002

Iowa Energy Efficiency Statewide Technical Reference Manual –3.6.11 Fryer
Vol.3 Nonresidential Measures July 22, 2020 FINAL Page 315 of 410
SUMMER COINCIDENT PEAK DEMAND SAVINGS
Where:
kWh = Electric energy savings, calculated above
CF = Summer peak coincidence factor
= 0.787
Other variables as defined above.
NATURAL GAS ENERGY SAVINGS
Custom calculation for a natural gas fryer below, otherwise use deemed value of 507.9 therms/yr for standard fryers
and 415.1 therms/yr for large vat fryers.
676
Where:
ΔIdleEnergy = (IdleRate
Base
* (Hours – FoodCooked/Production
Base
))- (IdleRate
ESTAR
* (Hours –
FoodCooked/Production
ESTAR
))
ΔCookingEnergy = (FoodCooked * EFOOD/ Eff
Base
) - (FoodCooked * EFOOD/ Eff
ESTAR
)
Where:
100,000 = Btu to therms conversion factor
Production
Base
= Production capacity of baseline gas fryer
= 60 lb/hr for standard fryers and 100 lb/hr for large vat fryers
Production
ESTAR
= Production capacity of ENERGY STAR gas fryer
676
Algorithms and assumptions derived from ENERGY STAR Commercial Kitchen Equipment Savings Calculator
For example, an ENERGY STAR standard-sized electric fryer, using default values from the calculation above,
would save:
ΔkWh = (ΔIdleEnergy + ΔCookingEnergy) * Days /1,000
Where:
ΔIdleEnergy = (1200 * (16 – 150 / 65)) - (800 * (16 – 150 / 70))
= 5,345 Wh
ΔCookingEnergy = (150 * 167/ 0.75) - (150 * 167/ 0.83)
= 3,219 Wh
ΔkWh = (5,345 + 3,219) * 365.25 / 1,000
= 3,128.2 kWh
For example, an ENERGY STAR standard-sized electric fryer, using default values from the calculation above,
would save:
ΔkW = 3,128.2 / (16 * 365.25) * 0.787
= 0.4213 kW
Filed with the Iowa Utilities Board on September 23, 2020, EEP-2018-0002

Iowa Energy Efficiency Statewide Technical Reference Manual –3.6.11 Fryer
Vol.3 Nonresidential Measures July 22, 2020 FINAL Page 316 of 410
= Custom or if unknown, use 65 lb/hr for standard fryers and 110 lb/hr for large vat fryers
IdleRate
Base
= Idle energy rate of baseline gas fryer
= 14,000 Btu/hr for standard fryers and 16,000 Btu/hr for large vat fryers
IdleRate
ESTAR
= Idle energy rate of ENERGY STAR gas fryer
= Custom or if unknown, use 9,000 Btu/hr for standard fryers and 12,000 Btu/hr for large
vat fryers
EFOOD = ASTM energy to food
= 570 Btu/lb
Eff
Base
= Cooking efficiency of baseline gas fryer
= 35% for both standard and large vat fryers
Eff
ESTAR
= Cooking efficiency of ENERGY STAR gas fryer
= Custom or if unknown, use 50% for both standard and large vat fryers
Other variables as defined above.
PEAK GAS SAVINGS
Where:
ΔTherms = Natural gas energy savings, calculated above
Other variables as defined above.
WATER IMPACT DESCRIPTIONS AND CALCULATION
N/A
DEEMED O&M COST ADJUSTMENT CALCULATION
N/A
For example, an ENERGY STAR standard-sized gas fryer, using default values from above, would save:
ΔTherms = (ΔIdleEnergy + ΔCookingEnergy) * Days /100,000
Where:
ΔIdleEnergy = (14,000 * (16 – 150 / 60)) - (9,000 * (16 – 150 / 65))
= 65,769 Btu/day
ΔCookingEnergy = (150 * 570/ 0.35) - (150 * 570/ 0.50)
=73,286 Btu/day
ΔTherms = (65,769 + 73,286) * 365 / 100,000
= 507.9 therms/yr
For example, an ENERGY STAR standard-sized gas fryer, using default values from above, would save:
ΔPeakTherms = 507.9 / 365.25
= 1.3906 therms/day
Filed with the Iowa Utilities Board on September 23, 2020, EEP-2018-0002

Iowa Energy Efficiency Statewide Technical Reference Manual –3.6.11 Fryer
Vol.3 Nonresidential Measures July 22, 2020 FINAL Page 317 of 410
MEASURE CODE: NR-FSE-ESFR-V02-190101
SUNSET DATE: 1/1/2022
Filed with the Iowa Utilities Board on September 23, 2020, EEP-2018-0002

Iowa Energy Efficiency Statewide Technical Reference Manual –3.6.12 Griddle
Vol.3 Nonresidential Measures July 22, 2020 FINAL Page 318 of 410
3.6.12. Griddle
DESCRIPTION
This measure applies to electric or natural gas fired ENERGY STAR certified griddles installed in a commercial kitchen.
ENERGY STAR commercial griddles achieve approximately 10% higher efficiency than standard griddles with
strategies such as highly conductive or reflective plate materials and improved thermostatic controls.
This measure was developed to be applicable to the following program types: TOS.
DEFINITION OF EFFICIENT EQUIPMENT
To qualify for this measure the installed equipment must be a new ENERGY STAR electric or natural gas fired griddle
meeting idle energy rate limits as determined by fuel type.
ENERGY STAR Requirements (Version 1.2, Effective May 8, 2009 for natural gas and January 1, 2011 for electric
griddles)
Electric Efficiency Requirements
Natural Gas Efficiency Requirements
Idle Energy Rate
Cooking Efficiency
Idle Energy Rate
Cooking Efficiency
≤ 320 W/ft
2
≤ 1.00 kW
Reported
≤ 2,650 Btu/hr/ft
2
N/A
Reported
DEFINITION OF BASELINE EQUIPMENT
The baseline equipment is a new electric or natural gas fired griddle that is not ENERGY STAR certified.
DEEMED LIFETIME OF EFFICIENT EQUIPMENT
The expected measure life is assumed to be 12 years.
677
DEEMED MEASURE COST
The incremental capital cost for this measure is $0 for an electric griddle and $360 for a gas griddle.
678
LOADSHAPE
Loadshape NRE02 - Nonresidential Electric Cooking – Restaurant
Loadshape NRGC01 - Nonresidential Gas Cooking – Restaurant
Algorithm
CALCULATION OF SAVINGS
ELECTRIC ENERGY SAVINGS
Custom calculation for an electric griddle below, otherwise use deemed value of 1,910.4 kWh.
679
677
Measure life from ENERGY STAR Commercial Kitchen Equipment Savings Calculator, which cites reference as “FSTC research
on available models, 2009”
http://www.energystar.gov/buildings/sites/default/uploads/files/commercial_kitchen_equipment_calculator.xlsx
678
Measure cost from Commercial Kitchen Equipment Savings Calculator, which cites reference as “EPA research on available
models using AutoQuotes, 2012”
http://www.energystar.gov/index.cfm?fuseaction=find_a_product.showProductGroup&pgw_code=COG
679
Algorithms and assumptions derived from ENERGY STAR Commercial Kitchen Equipment Savings Calculator
Filed with the Iowa Utilities Board on September 23, 2020, EEP-2018-0002

Iowa Energy Efficiency Statewide Technical Reference Manual –3.6.12 Griddle
Vol.3 Nonresidential Measures July 22, 2020 FINAL Page 319 of 410
Where:
ΔIdleEnergy = [(IdleRate
Base
* Width * Length) * (Hours – FoodCooked/Production
Base
)] – [(IdleRate
ESTAR
* Width * Length) * (Hours – FoodCooked/Production
ESTAR
))
ΔCookingEnergy = (FoodCooked * EFOOD/ Eff
Base
) - (FoodCooked * EFOOD/ Eff
ESTAR
)
Where:
Hours = Average daily hours of operation
= Custom or if unknown, use 12 hours per day
Days = Annual days of operation
= Custom or if unknown, use 365.25 days per year
1,000 = Wh to kWh conversion factor
Width = Griddle width
= Custom or if unknown, use 3 feet
Depth = Griddle depth
= Custom or if unknown, use 2 feet
FoodCooked = Food cooked per day
= Custom or if unknown, use 100 pounds
Production
Base
= Production capacity of baseline electric griddle
= 35 lb/hr
Production
ESTAR
= Production capacity of ENERGY STAR electric griddle
= Custom or if unknown, use 40 lb/hr
IdleRate
Base
= Idle energy rate of baseline electric griddle
= 400 W/ft
2
IdleRate
ESTAR
= Idle energy rate of ENERGY STAR electric griddle
= Custom or if unknown, use 320 W/ft
2
EFOOD = ASTM energy to food
= 139 Wh/lb
Eff
Base
= Cooking efficiency of baseline electric griddle
= 65%
Eff
ESTAR
= Cooking efficiency of ENERGY STAR electric griddle
= Custom or if unknown, use 70%
Filed with the Iowa Utilities Board on September 23, 2020, EEP-2018-0002

Iowa Energy Efficiency Statewide Technical Reference Manual –3.6.12 Griddle
Vol.3 Nonresidential Measures July 22, 2020 FINAL Page 320 of 410
SUMMER COINCIDENT PEAK DEMAND SAVINGS
Where:
kWh = Electric energy savings, calculated above
CF = Summer peak coincidence factor
= 0.787
Other variables as defined above.
NATURAL GAS ENERGY SAVINGS
Custom calculation for a natural gas griddle below, otherwise use deemed value of 131.4 therms.
680
Where:
ΔIdleEnergy = [IdleRate
Base
* (Width * Length) * (Hours – FoodCooked/Production
Base
)] – [IdleRate
ESTAR
* (Width * Length) * (Hours – FoodCooked/Production
ESTAR
))
ΔCookingEnergy = (FoodCooked * EFOOD/ Eff
Base
) - (FoodCooked * EFOOD/ Eff
ESTAR
)
Where:
100,000 = Btu to therms conversion factor
Production
Base
= Production capacity of baseline gas griddle
= 25 lb/hr
Production
ESTAR
= Production capacity of ENERGY STAR gas griddle
= Custom or if unknown, use 45 lb/hr
IdleRate
Base
= Idle energy rate of baseline gas griddle
= 3,500 Btu/hr/ft
2
680
Algorithms and assumptions derived from ENERGY STAR Commercial Kitchen Equipment Savings Calculator
For example, an ENERGY STAR electric griddle with defaults from the calculation above would save:
ΔkWh = (ΔIdleEnergy + ΔCookingEnergy) * Days / 1,000
Where:
ΔIdleEnergy =[400 * (3 * 2) * (12 – 100 / 35)] – [320 * (3 * 2) * (12 – 100 / 40)] = 3,703 Wh
ΔCookingEnergy = (100 * 139/ 0.65) - (100 * 139/ 0.70)
= 1,528 Wh
ΔkWh = (3,703 + 1,528) * 365.25 /1,000
= 1,910.4 kWh
For example, an ENERGY STAR electric griddle with defaults from the calculation above would save:
ΔkW = 1,910.4 / (12 * 365.25) * 0.787
= 0.3430 kW
Filed with the Iowa Utilities Board on September 23, 2020, EEP-2018-0002

Iowa Energy Efficiency Statewide Technical Reference Manual –3.6.12 Griddle
Vol.3 Nonresidential Measures July 22, 2020 FINAL Page 321 of 410
IdleRate
ESTAR
= Idle energy rate of ENERGY STAR gas griddle
= Custom or if unknown, use 2,650 Btu/hr/ft
2
EFOOD = ASTM energy to food
= 475 Btu/lb
Eff
Base
= Cooking efficiency of baseline gas griddle
= 32%
Eff
ESTAR
= Cooking efficiency of ENERGY STAR gas griddle
= Custom or if unknown, use 38%
Other variables as defined above.
PEAK GAS SAVINGS
Where:
ΔTherms = Natural gas energy savings, calculated above
Other variables as defined above.
WATER IMPACT DESCRIPTIONS AND CALCULATION
N/A
DEEMED O&M COST ADJUSTMENT CALCULATION
N/A
MEASURE CODE: NR-FSE-ESGR-V01-170101
SUNSET DATE: 1/1/2022
For example, an ENERGY STAR gas griddle with defaults from the calculation above would save:
ΔTherms = (ΔIdleEnergy + ΔCookingEnergy) * Days /100,000
Where:
ΔIdleEnergy = [3,500 * (3 * 2) * (12 – 100 / 25)] – [2,650 * (3 * 2) * (12 – 100 / 45)]
= 12,533 Btu/day
ΔCookingEnergy = (100 * 475/ 0.32) - (100 * 475/ 0.38)
= 23,438 Btu/day
ΔTherms = (12,533 + 23,438) * 365.25 /100,000
= 131.4 therms/yr
For example, an ENERGY STAR gas griddle with defaults from the calculation above would save:
ΔPeakTherms = 131.4 / 365.25
= 0.3598 therms/day
Filed with the Iowa Utilities Board on September 23, 2020, EEP-2018-0002

Iowa Energy Efficiency Statewide Technical Reference Manual –3.7 Shell Measures
Vol.3 Nonresidential Measures July 22, 2020 FINAL Page 322 of 410
3.7. Shell Measures
Many of the Nonresidential Shell measures use load hours (LH) to calculate heating and cooling savings. The table
with these values is included in this section and referenced in each measure. The benefit of improved shell
performance is realized during any period of time air conditioning equipment (both heating and cooling) is in
operation, and therefore it follows that system loading hours (as opposed to effective full load hours) may more
appropriately quantify measure impacts that relate to a building’s shell.
Calculation of LH uses the same approach and base files as EFLH, as described in Section 3.3. To calculate the LH by
building type and climate zone provided below, VEIC created OpenStudio and/or eQuest models for each building
type. The LH calculation is based on hourly building loads (total heating/cooling output). The calculation allows for
a more generally applicable LH determination that is tied to the load profiles of various building prototypes and not
affected by modeling irregularities that can be equipment specific. The load profiles are related to system
characteristics such as constant vs. variable air volume and single- vs. multi-zone configurations, but not sensitive to
how the energy model treats equipment operation at very low loads or performs sizing estimates. The calculation
sums the annual total (heating or cooling) load hours.
The models, prototype building descriptions, methodology documentation, and final results can be found on the
Iowa TRM SharePoint Site (TRM Reference Documents; Non Residential; Modeling).
Note where a measure installation is within a building or application that does not fit with any of the defined building
types below, the user should apply custom assumptions where it is reasonable to estimate them, else the building
of best fit should be utilized. For the specific assumptions used in each model, refer to table in the “IA Prototype
Building Descriptions” file in the SharePoint folder referenced above.
Building Type
Zone 5 (Burlington)
Zone 6 (Mason City)
Average/unknown
Weighting
Factors for
Nonresidential
Average
681
Model Source
Heating
LH
Cooling
LH
Heating
LH
Cooling
LH
Heating
LH
Cooling
LH
Convenience
3024
3005
2129
4054
2690
3628
0%
eQuest
Education
6213
3354
6633
2771
6430
2996
9%
OpenStudio
Grocery
6217
2871
6819
2425
6499
2725
0%
OpenStudio
Health
8729
5240
8732
4405
8720
4770
0%
OpenStudio
Hospital
8286
8760
8272
8760
8289
8760
0%
OpenStudio
Industrial
3396
3537
2233
4526
3080
3977
0%
eQuest
Lodging
5218
8019
6234
7309
5500
7909
0%
OpenStudio
Multifamily
5145
5424
5998
4575
5382
5084
0%
OpenStudio
Office - Large
5037
4844
5787
4457
5316
4596
0%
OpenStudio
Office - Small
4641
3941
5329
3265
5087
3678
26%
OpenStudio
Religious
2485
4347
1667
5267
2223
4763
16%
eQuest
Restaurant
2954
3019
3619
2217
3321
2798
7%
OpenStudio
Retail - Large
2699
3621
1807
4623
2405
4218
5%
eQuest
Retail - Small
4222
2636
4935
1839
4596
2445
11%
OpenStudio
Warehouse
2025
3617
1390
4553
1788
4100
26%
eQuest
Nonresidential
Average
3480
3643
3473
3723
3561
3734
N/A
N/A
681
The weighting used to average modeled variables into a generic, nonresidential category is based on the number of buildings
matching each building type in the 2012 Commercial Buildings Energy Consumption Survey (CBECS) Data for the Midwest Region,
West North Central Division, which includes Iowa. Building types that comprise less than 5% of the total population are excluded
from the weighted averaging.
Filed with the Iowa Utilities Board on September 23, 2020, EEP-2018-0002

Iowa Energy Efficiency Statewide Technical Reference Manual –3.7.1 Infiltration Control
Vol.3 Nonresidential Measures July 22, 2020 FINAL Page 323 of 410
3.7.1. Infiltration Control
DESCRIPTION
Thermal shell air leaks are sealed through strategic use and location of air-tight materials. An estimate of savings is
provided in two ways. It is highly recommended that leaks be detected and pre- and post-sealing leakage rates
measured with the assistance of a blower-door by qualified/certified inspectors.
682
Where this occurs, an algorithm
is provided to estimate the site specific savings. Where test in/test out has not occurred, a conservative deemed
assumption is provided.
This measure was developed to be applicable to the following program types: RF.
If applied to other program types, the measure savings should be verified.
DEFINITION OF EFFICIENT EQUIPMENT
Air sealing materials and diagnostic testing should meet all eligibility program qualification criteria. The initial and
final tested leakage rates should be assessed in such a manner that the identified reductions can be properly
discerned, particularly in situations wherein multiple building envelope measures may be implemented
simultaneously.
DEFINITION OF BASELINE EQUIPMENT
The existing air leakage should be determined through approved and appropriate test methods using a blower door.
The baseline condition of a building upon first inspection significantly affects the opportunity for cost-effective
energy savings through air-sealing.
DEEMED LIFETIME OF EFFICIENT EQUIPMENT
The expected measure life is assumed to be 15 years.
683
DEEMED MEASURE COST
The actual capital cost for this measure should be used in screening.
LOADSHAPE
NREC01:16 – Nonresidential Cooling (by Building Type)
NREH01:16 – Nonresidential Electric Heat (by Building Type)
NREP01:16 – Nonresidential Electric Heat Pump (by Building Type)
NRGH01:16 – Nonresidential Gas Heating (by Building Type)
Algorithm
CALCULATION OF SAVINGS
ELECTRIC ENERGY SAVINGS
Test In / Test Out Approach
682
Refer to the Energy Conservatory Blower Door Manual for more information on testing methodologies.
683
Measure Life Report, Residential and Commercial/Industrial Lighting and HVAC Measures, GDS Associates, 2007.
Filed with the Iowa Utilities Board on September 23, 2020, EEP-2018-0002

Iowa Energy Efficiency Statewide Technical Reference Manual –3.7.1 Infiltration Control
Vol.3 Nonresidential Measures July 22, 2020 FINAL Page 324 of 410
Where:
= If central cooling, reduction in annual cooling requirement due to air sealing
CFM
Pre
= Infiltration at natural conditions as estimated by blower door testing before air sealing
= Actual
684
CFM
Post
= Infiltration at natural conditions as estimated by blower door testing after air sealing
= Actual
60 = Converts Cubic Feet per Minute to Cubic Feet per Hour
LH
cooling
= Load Hours for Cooling [hr] are provided in Section 3.7, Shell end use
ΔT
AVG,cooling
= Average temperature difference [⁰F] during cooling season between outdoor air
temperature and assumed 75⁰F indoor air temperature
Climate Zone
(City based upon)
OA
AVG,cooling
[°F]
685
ΔT
AVG,cooling
[°F]
Zone 5 (Burlington)
80.4
5.4
Zone 6 (Mason City)
75.2
0.2
Average/unknown
78.6
3.6
0.018 = Specific Heat Capacity of Air (Btu/ft
3
*°F)
LM = Latent multiplier to account for latent cooling demand
= dependent on location:
686
Climate Zone (City based upon)
LM
Zone 5 (Burlington)
4.1
Zone 6 (Mason City)
4.2
Average/ unknown
4.2
1000 = Converts Btu to kBtu
η
cooling
= Energy efficiency ratio (EER) of cooling system (kBtu/kWh)
684
Because the pre- and post-sealing blower door test will occur on different days, there is a potential for the wind and
temperature conditions on the two days to affect the readings. There are methodologies to account for these effects. For wind
- first if possible, avoid testing in high wind, place blower door on downwind side, take a pre-test baseline house pressure
reading and adjust your house pressure readings by subtracting the baseline reading, and use the time averaging feature on the
digital gauge, etc. Corrections for air density due to temperature swings can be accounted for with Air Density Correction
Factors. Refer to the Energy Conservatory Blower Door Manual for more information.
685
National Solar Radiation Data Base -- 1991- 2005 Update: Typical Meteorological Year 3
http://rredc.nrel.gov/solar/old_data/nsrdb/1991-2005/tmy3/by_state_and_city.html . Heating Season defined as September
17
th
through April 13
th
, cooling season defined as May 20 through August 15
th
. For cooling season, temperatures from 8AM to
8PM were used to establish average temperatures as this is when cooling systems are expected to be loaded.
686
The Latent Multiplier is used to convert the sensible cooling savings calculated to a value representing sensible and latent
cooling loads. The values are derived from the methodology outlined in Infiltration Factor Calculation Methodology by Bruce
Harley, Senior Manager, Applied Building Science, CLEAResult 11/18/2015 and is based upon an 8760 analysis of sensible and
total heat loads using hourly climate data.
Filed with the Iowa Utilities Board on September 23, 2020, EEP-2018-0002

Iowa Energy Efficiency Statewide Technical Reference Manual –3.7.1 Infiltration Control
Vol.3 Nonresidential Measures July 22, 2020 FINAL Page 325 of 410
= Actual. If not directly specified, EER may be calculated from other commonly listed
efficiency ratings (kW/ton or COP):
EER = 12 / kW/ton
EER = COP x 3.412
= If electric heat (resistance or heat pump), reduction in annual electric heating due to
air sealing
LH
heating
= Load Hours for Heating [hr] are provided in Section 3.7, Shell end use
ΔT
AVG,heating
= Average temperature difference [⁰F] during heating season between outdoor air
temperature and assumed 55⁰F heating base temperature
Climate Zone
(City based upon)
OA
AVG,heating
[°F]
687
ΔT
AVG,heating
[°F]
Zone 5 (Burlington)
39.6
15.4
Zone 6 (Mason City)
30.1
24.9
Average/ unknown
35.9
19.1
3,142 = Conversion from Btu to kWh.
η
heating
= Efficiency of heating system, expressed as COP
= Actual. For equipment with HSPF ratings, use the following conversion to COP:
COP = HSPF/3.413
Conservative Deemed Approach
Where:
SavingsPerUnit = Annual savings per square foot, dependent on heating / cooling equipment
688
687
National Solar Radiation Data Base -- 1991- 2005 Update: Typical Meteorological Year 3
http://rredc.nrel.gov/solar/old_data/nsrdb/1991-2005/tmy3/by_state_and_city.html . Heating Season defined as September
17
th
through April 13
th
, cooling season defined as May 20 through August 15
th
. For cooling season, temperatures from 8AM to
8PM were used to establish average temperatures as this is when cooling systems are expected to be loaded.
688
The values in the table represent estimates of savings from a 10-15% improvement in air leakage. The values are half those
provided by Cadmus for the Joint Assessment, based on building simulations performed. The conservative estimate is more
appropriate for a deemed estimate. These values should be re-evaluated if EM&V values provide support for a higher deemed
estimate.
For example, a small retail building (2,000 SqFt) in unknown location with 10.5 SEER central cooling and a heat
pump system with COP of 1.92, with pre- and post-sealing natural infiltration rates of 340 and 225 CFM,
respectively:
ΔkWh = ΔkWh
cooling
+ ΔkWh
heating
= [((340 – 225) * 60 * 2,445 * 3.6 * 0.018 * 4.2) / (1000 * 10.5)] +
[((340 – 225) * 60 * 4,596 * 19.1 * 0.018) / (1.92 * 3,412)]
= 437 + 1664
= 2101 kWh
Filed with the Iowa Utilities Board on September 23, 2020, EEP-2018-0002
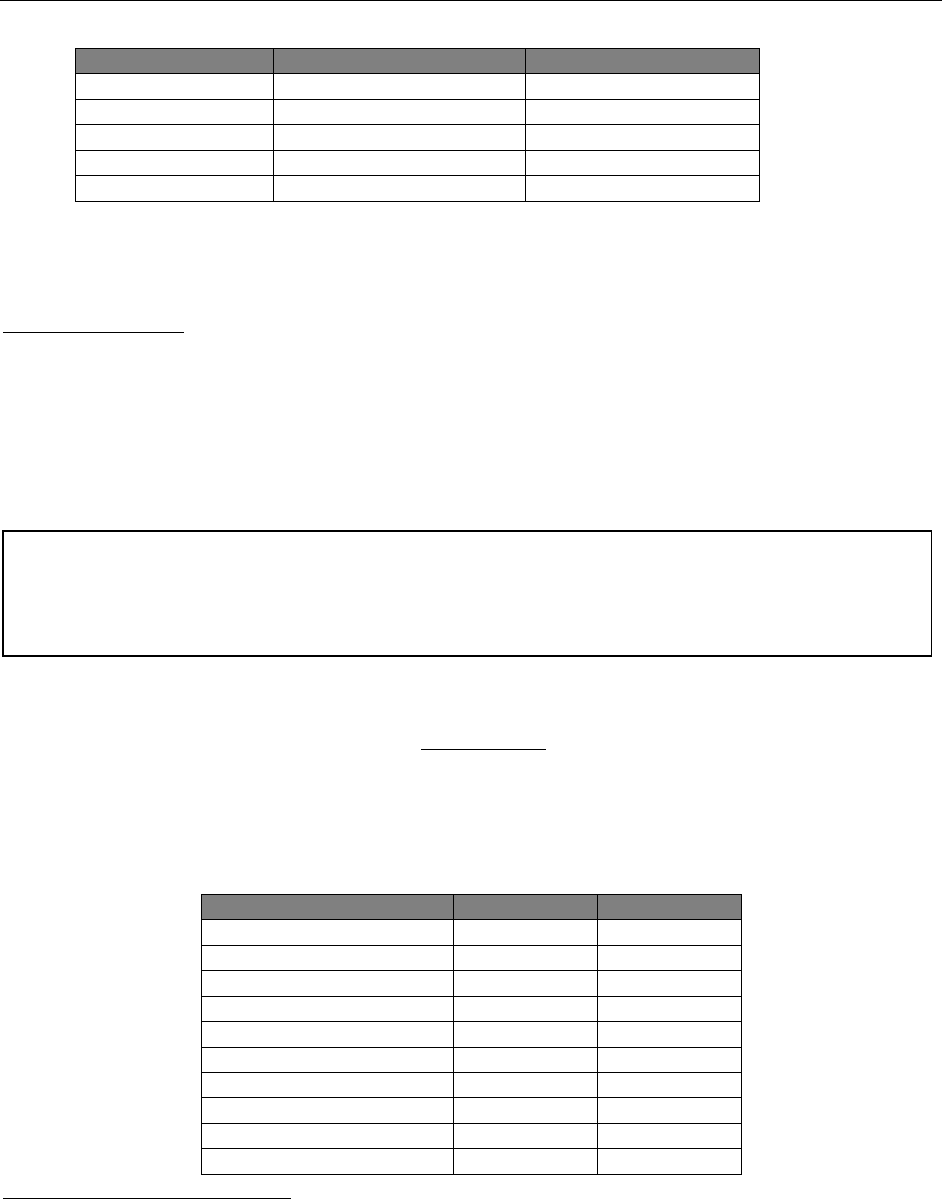
Iowa Energy Efficiency Statewide Technical Reference Manual –3.7.1 Infiltration Control
Vol.3 Nonresidential Measures July 22, 2020 FINAL Page 326 of 410
End Use
HVAC System
SavingsPerUnit (kWh/ft
2
)
Cooling Chillers
Chiller
0.027
Cooling DX
Air Conditioning
0.041
Space Heat
Electric Resistance/Furnace
0.2915
Heat Pump - Cooling
Heat Pump
0.041
Heat Pump - Heating
Heat Pump
0.1885
SqFt = Building square footage
= Actual
Additional Fan savings
= If gas furnace heat, kWh savings for reduction in fan run time
= ΔTherms * F
e
* 29.3
F
e
= Furnace Fan energy consumption as a percentage of annual fuel consumption
= 3.14%
689
29.3 = kWh per therm
SUMMER COINCIDENT PEAK DEMAND SAVINGS
Where:
LH
cooling
= Load hours of air conditioning are provided in Section 3.7, Shell end use
CF = Summer System Peak Coincidence Factor for Cooling (dependent on building type)
Building Type
CF
690
Model Source
Convenience
92.3%
eQuest
Education
96.7%
OpenStudio
Grocery
100.0%
OpenStudio
Health
100.0%
OpenStudio
Hospital
98.6%
OpenStudio
Industrial
44.6%
eQuest
Lodging
97.4%
OpenStudio
Multifamily
100.0%
OpenStudio
Office - Large
98.8%
OpenStudio
Office - Small
100.0%
OpenStudio
689
F
e
is not one of the AHRI certified ratings provided for residential furnaces, but can be reasonably estimated from a
calculation based on the certified values for fuel energy (Ef in MMBtu/yr) and Eae (kWh/yr). An average of a 300 record sample
(non-random) out of 1495 was 3.14%. This is, appropriately, ~50% greater than the ENERGY STAR version 3 criteria for 2% F
e
.
See “Furnace Fan Analysis.xlsx” for reference.
690
This calculation is the total savings in peak hour demand divided by the total savings in absolute peak demand.
For example, restaurant in Burlington with a gas furnace with system efficiency of 70%, with pre- and post-
sealing natural infiltration rates of 340 and 225 CFM, respectively:
ΔkWh = 81 * 0.0314 * 29.3
= 75 kWh
Filed with the Iowa Utilities Board on September 23, 2020, EEP-2018-0002

Iowa Energy Efficiency Statewide Technical Reference Manual –3.7.1 Infiltration Control
Vol.3 Nonresidential Measures July 22, 2020 FINAL Page 327 of 410
Building Type
CF
690
Model Source
Religious
94.3%
eQuest
Restaurant
99.6%
OpenStudio
Retail - Large
87.6%
eQuest
Retail - Small
100.0%
OpenStudio
Warehouse
77.9%
eQuest
Nonresidential Average
691
92.3%
N/A
NATURAL GAS SAVINGS
Test In / Test Out Approach
If Natural Gas heating:
Where:
100,000 = Conversion from BTUs to Therms
Other factors as defined above
Conservative Deemed Approach
Where:
SavingsPerUnit = Annual savings per square foot, dependent on heating / cooling equipment
692
End Use
HVAC System
SavingsPerUnit
(Therms/ft
2
)
Space Heat Boiler
Gas Boiler
0.0155
Space Heat Furnace
Gas Furnace
0.0155
SqFt = Building square footage
= Actual
691
For weighting factors, see HVAC variable table in section 3.3.
692
The values in the table represent estimates of savings from a 10-15% improvement in air leakage. The values are half those
provided by Cadmus for the Joint Assessment, based on building simulations performed. The conservative estimate is more
appropriate for a deemed estimate. These values should be re-evaluated if EM&V values provide support for a higher deemed
estimate.
For example, a small retail building (2,000 Sq) Ft in unknown location with 10.5 SEER central cooling and a heat
pump system with COP of 1.92, with pre- and post-sealing natural infiltration rates of 340 and 225 CFM,
respectively:
ΔkW = 437 / 2,445 * 1.00
= 0.1787 kW
For example, restaurant in Burlington with a gas furnace with system efficiency of 70%, with pre- and post-
sealing natural infiltration rates of 340 and 225 CFM, respectively:
ΔTherms = ((340 – 225) * 60 * 2,954 * 15.4 * 0.018) / (0.70 * 100,000)
= 81 therms
Filed with the Iowa Utilities Board on September 23, 2020, EEP-2018-0002

Iowa Energy Efficiency Statewide Technical Reference Manual –3.7.1 Infiltration Control
Vol.3 Nonresidential Measures July 22, 2020 FINAL Page 328 of 410
PEAK GAS SAVINGS
Where:
ΔTherms = Therm impact calculated above
GCF = Gas Coincidence Factor for Heating
Building Type
GCF
693
Model Source
Convenience
0.016482
eQuest
Education
0.011480
OpenStudio
Grocery
0.013083
OpenStudio
Health
0.010179
OpenStudio
Hospital
0.015543
OpenStudio
Industrial
0.014296
eQuest
Lodging
0.013205
OpenStudio
Multifamily
0.012268
OpenStudio
Office - Large
0.013082
OpenStudio
Office - Small
0.016718
OpenStudio
Religious
0.011964
eQuest
Restaurant
0.015262
OpenStudio
Retail - Large
0.013281
eQuest
Retail - Small
0.014055
OpenStudio
Warehouse
0.015677
eQuest
Nonresidential Average
694
0.014658
N/A
WATER IMPACT DESCRIPTIONS AND CALCULATION
N/A
DEEMED O&M COST ADJUSTMENT CALCULATION
N/A
MEASURE CODE: NR-SHL-AIRS-V04-210101
SUNSET DATE: 1/1/2024
693
Calculated as the percentage of total savings in the maximum saving day, from models.
694
For weighting factors, see HVAC variable table in section 3.3.
For example, restaurant in Burlington with a gas furnace with system efficiency of 70%, with pre- and post-
sealing natural infiltration rates of 340 and 225 CFM, respectively:
∆PeakTherms = 81 * 0.015262
= 1.221 therms
Filed with the Iowa Utilities Board on September 23, 2020, EEP-2018-0002

Iowa Energy Efficiency Statewide Technical Reference Manual –3.7.2 Foundation Wall Insulation
Vol.3 Nonresidential Measures July 22, 2020 FINAL Page 329 of 410
3.7.2. Foundation Wall Insulation
DESCRIPTION
Energy and demand saving are realized through reductions in the building cooling and heating loads. Insulation is
added to foundation sidewalls. Insulation added above ground in conditioned space is modeled the same as wall
insulation. Below ground insulation is adjusted with an approximation of the thermal resistance of the ground.
Cooling savings only consider above grade insulation, as below grade has little temperature difference during the
cooling season.
This measure was developed to be applicable to the following program types: RF and NC. If applied to other
program types, the measure savings should be verified.
DEFINITION OF EFFICIENT EQUIPMENT
This measure requires a member of the implementation staff or a participating contractor to evaluate the pre and
post assembly R-values and measure surface areas. The requirements for participation in the program will be defined
by the utilities.
DEFINITION OF BASELINE EQUIPMENT
For retrofit projects, the baseline condition is the existing condition and requires assessment of the existing
insulation. It should be based on the entire wall assembly. If existing condition is unknown, assume IECC 2006.
For new construction projects, baseline is building code, IECC 2012.
DEEMED LIFETIME OF EFFICIENT EQUIPMENT
The measure expected useful life (EUL) is assumed to be 20 years per DEER 2008. This is consistent with SDG&E’s
9th Year Measure Retrofit Study (1996 & 1997 Residential Weatherization Programs), CPUC’s Energy Efficiency
Policy Manual v.2, and GDS’s Measure Life Report Residential and Commercial/Industrial Lighting and HVAC
Measures (June 2007).
DEEMED MEASURE COST
For retrofit projects, full installation costs should be used.
LOADSHAPE
NREC01:16 – Nonresidential Cooling (by Building Type)
NREH01:16 – Nonresidential Electric Heat (by Building Type)
NREP01:16 – Nonresidential Electric Heat Pump (by Building Type)
NRGH01:16 – Nonresidential Gas Heating (by Building Type)
Algorithm
CALCULATION OF ENERGY SAVINGS
ELECTRIC ENERGY SAVINGS
Electric energy savings is calculated as the sum of energy saved when cooling the building and energy saved when
heating the building
∆kWh = ∆kWh
cooling
+ ∆kWh
heating
If central cooling, the electric energy saved in annual cooling due to the added insulation is
Filed with the Iowa Utilities Board on September 23, 2020, EEP-2018-0002

Iowa Energy Efficiency Statewide Technical Reference Manual –3.7.2 Foundation Wall Insulation
Vol.3 Nonresidential Measures July 22, 2020 FINAL Page 330 of 410
Where:
R
existingAG
= Above grade wall heat loss coefficient, with existing insulation, for the complete
structural assembly [(hr-⁰F-ft
2
)/Btu]
695
R
newAG
= Above grade wall heat loss coefficient, with new insulation, for the complete
structural assembly [(hr-⁰F-ft
2
)/Btu]
Area
AG
= Area of the above grade wall surface in square feet
LH
cooling
= Load Hours for Cooling [hr] are provided in Section 3.7, Shell end use
ΔT
AVG,cooling
= Average temperature difference [⁰F] during cooling season between outdoor air
temperature and assumed 75⁰F indoor air temperature
Climate Zone
(City based upon)
OA
AVG,cooling
[°F]
696
ΔT
AVG,cooling
[°F]
Zone 5 (Burlington)
80.4
5.4
Zone 6 (Mason City)
75.2
0.2
Average/unknown
78.6
3.6
1,000 = Conversion from Btu to kBtu
η
cooling
= Seasonal energy efficiency ratio (SEER) of cooling system (kBtu/kWh)
= Actual
If the building is heated with electric heat (resistance or heat pump), the electric energy saved in annual heating
due to the added insulation is:
Where:
R
existingBG
= Below grade wall assembly heat loss coefficient with existing insulation, for the
complete structural assembly [(hr-⁰F-ft
2
)/Btu]
= Actual R-value of wall assembly plus “Average Earth R-value” by depth in table below.
For example, for an area that extends 5 feet below grade, an R-value of 7.46 would be
695
In addition to the nominal value of the insulation, assembly design and materials also need to be considered for their impact
on the overall insulation properties of the complete structural assembly. This exercise is best left as a site or project specific
determination. For those desiring a more streamlined or prescriptive approach toward estimating assembly R-values, ASHRAE
Standard 90.1 2019 dedicates Normative Appendix A “Rated R-Value of Insulation and Assembly U-Factor, C-Factor, and F-
Factor Determinations” to outline an approach using convenient lookup tables.
696
National Solar Radiation Data Base -- 1991- 2005 Update: Typical Meteorological Year 3
http://rredc.nrel.gov/solar/old_data/nsrdb/1991-2005/tmy3/by_state_and_city.html . Heating Season defined as September
17
th
through April 13
th
, cooling season defined as May 20 through August 15
th
. For cooling season, temperatures from 8AM to
8PM were used to establish average temperatures as this is when cooling systems are expected to be loaded.
Filed with the Iowa Utilities Board on September 23, 2020, EEP-2018-0002

Iowa Energy Efficiency Statewide Technical Reference Manual –3.7.2 Foundation Wall Insulation
Vol.3 Nonresidential Measures July 22, 2020 FINAL Page 331 of 410
selected and added to the existing insulation R-value.
Below Grade R-value
Depth below grade (ft)
0
1
2
3
4
5
6
7
8
Earth R-value (°F-ft
2
-
h/Btu)
2.44
4.50
6.30
8.40
10.44
12.66
14.49
17.00
20.00
Average Earth R-value
(°F-ft2-h/Btu)
2.44
3.47
4.41
5.41
6.42
7.46
8.46
9.53
10.69
R
newBG
= Below grade wall assembly heat loss coefficient with new insulation, for the complete
structural assembly [(hr-⁰F-ft
2
)/Btu]
Area
BG
= Area of the below grade wall surface in square feet.
LH
heating
= Load Hours for Heating [hr] are provided in Section 3.7, Shell end use
ΔT
AVG,heating
= Average temperature difference [⁰F] during heating season between outdoor air
temperature and assumed 55⁰F heating base temperature
Climate Zone
(City based upon)
OA
AVG,heating
[°F]
697
ΔT
AVG,heating
[°F]
Zone 5 (Burlington)
39.6
15.4
Zone 6 (Mason City)
30.1
24.9
Average/unknown
35.9
19.1
3,142 = Conversion from Btu to kWh.
η
heating
= Efficiency of heating system
= Actual. Note: electric resistance heating and heat pumps will have an efficiency
greater than or equal to 100%
If the building is heated with a gas furnace, there will be some electric savings in heating the building attributed to
extra insulation since the furnace fans will run less.
∆kWh
heating
= ∆Therms * Fe * 29.3
Where:
∆Therms = Gas savings calculated with equation below.
Fe = Percentage of heating energy consumed by fans, assume 3.14%
698
29.3 = Conversion from therms to kWh
SUMMER COINCIDENT PEAK DEMAND SAVINGS
∆kW = (∆kWh
cooling
/ LH
cooling
) * CF
697
National Solar Radiation Data Base -- 1991- 2005 Update: Typical Meteorological Year 3
http://rredc.nrel.gov/solar/old_data/nsrdb/1991-2005/tmy3/by_state_and_city.html . Heating Season defined as September
17
th
through April 13
th
, cooling season defined as May 20 through August 15
th
. For cooling season, temperatures from 8AM to
8PM were used to establish average temperatures as this is when cooling systems are expected to be loaded.
698
F
e
is not one of the AHRI certified ratings provided for furnaces, but can be reasonably estimated from a calculation based
on the certified values for fuel energy (Ef in MMBtu/yr) and Eae (kWh/yr). An average of a 300 record sample (non-random)
out of 1495 was 3.14% for residential units. This is, appropriately, ~50% greater than the Energy Star version 3 criteria for 2%
F
e
. See “Programmable Thermostats Furnace Fan Analysis.xlsx” for reference. Assumed to be consistent with C&I applications.
Filed with the Iowa Utilities Board on September 23, 2020, EEP-2018-0002

Iowa Energy Efficiency Statewide Technical Reference Manual –3.7.2 Foundation Wall Insulation
Vol.3 Nonresidential Measures July 22, 2020 FINAL Page 332 of 410
Where:
LH
cooling
= Load hours of air conditioning are provided in Section 3.7, Shell end use
CF = Summer System Peak Coincidence Factor for Cooling (dependent on building type)
Building Type
CF
699
Model Source
Convenience
92.3%
eQuest
Education
96.7%
OpenStudio
Grocery
100.0%
OpenStudio
Health
100.0%
OpenStudio
Hospital
98.6%
OpenStudio
Industrial
44.6%
eQuest
Lodging
97.4%
OpenStudio
Multifamily
100.0%
OpenStudio
Office - Large
98.8%
OpenStudio
Office - Small
100.0%
OpenStudio
Religious
94.3%
eQuest
Restaurant
99.6%
OpenStudio
Retail - Large
87.6%
eQuest
Retail - Small
100.0%
OpenStudio
Warehouse
77.9%
eQuest
Nonresidential Average
700
92.3%
N/A
NATURAL GAS SAVINGS
If building uses a gas heating system, the savings resulting from the insulation is calculated with the following
formula.
Where:
100,000 = Conversion from BTUs to Therms
η
heat
= Efficiency of heating system
= Actual
Other terms as defined above.
PEAK GAS SAVINGS
Where:
ΔTherms = Therm impact calculated above
GCF = Gas Coincidence Factor for Heating
699
This calculation is the total savings in peak hour demand divided by the total savings in absolute peak demand.
700
For weighting factors, see HVAC variable table in section 3.3.
Filed with the Iowa Utilities Board on September 23, 2020, EEP-2018-0002

Iowa Energy Efficiency Statewide Technical Reference Manual –3.7.2 Foundation Wall Insulation
Vol.3 Nonresidential Measures July 22, 2020 FINAL Page 333 of 410
Building Type
GCF
701
Model Source
Convenience
0.016482
eQuest
Education
0.011480
OpenStudio
Grocery
0.013083
OpenStudio
Health
0.010179
OpenStudio
Hospital
0.015543
OpenStudio
Industrial
0.014296
eQuest
Lodging
0.013205
OpenStudio
Multifamily
0.012268
OpenStudio
Office - Large
0.013082
OpenStudio
Office - Small
0.016718
OpenStudio
Religious
0.011964
eQuest
Restaurant
0.015262
OpenStudio
Retail - Large
0.013281
eQuest
Retail - Small
0.014055
OpenStudio
Warehouse
0.015677
eQuest
Nonresidential Average
702
0.014658
N/A
WATER IMPACT DESCRIPTIONS AND CALCULATION
N/A
DEEMED O&M COST ADJUSTMENT CALCULATION
N/A
MEASURE CODE: NR-SHL-FINS-V04-210101
SUNSET DATE: 1/1/2024
701
Calculated as the percentage of total savings in the maximum saving day, from models.
702
For weighting factors, see HVAC variable table in section 3.3.
Filed with the Iowa Utilities Board on September 23, 2020, EEP-2018-0002

Iowa Energy Efficiency Statewide Technical Reference Manual –3.7.3 Roof Insulation
Vol.3 Nonresidential Measures July 22, 2020 FINAL Page 334 of 410
3.7.3. Roof Insulation
DESCRIPTION
Energy and demand savings are realized through reductions in the building cooling and heating loads.
This measure was developed to be applicable to the following program types: RF and NC.
If applied to other program types, the measure savings should be verified.
DEFINITION OF EFFICIENT EQUIPMENT
The efficient condition is insulation levels that exceed code requirements and should be determined by the
program. IECC 2012 requirements are shown in the following tables:
ASHRAE/IECC Climate Zone 5 (A, B, C)
Assembly
Maximum
Insulation Min. R-
Value
Insulation entirely above deck
U-0.039
R-25 ci
Metal building (with R-5 thermal blocks)
U-0.035
R-19 + R-11 LS
Attic and other
All other: U-0.027
Group R: U-0.021
All other: R-38
Group R: R-49
ASHRAE/IECC Climate Zone 6 (A, B, C)
Assembly
Maximum
Insulation Min. R-
Value
Insulation entirely above deck
U-0.032
R-30 ci
Metal building (with R-5 thermal blocks)
U-0.031
R-25 + R-11 LS
Attic and other
U-0.021
R-49
Note: ci = continuous insulation, LS = Liner System
DEFINITION OF BASELINE EQUIPMENT
The retrofit baseline condition is the existing condition and requires assessment of the existing insulation. It should
be based on the entire roof assembly. If existing condition is unknown, assume IECC 2006.
The new construction baseline is code requirement, IECC 2012.
DEEMED LIFETIME OF EFFICIENT EQUIPMENT
The measure expected useful life (EUL) is assumed to be 20 years per DEER 2008. This is consistent with SDG&E’s
9th Year Measure Retrofit Study (1996 & 1997 Residential Weatherization Programs), CPUC’s Energy Efficiency
Policy Manual v.2, and GDS’s Measure Life Report Residential and Commercial/Industrial Lighting and HVAC
Measures (June 2007).
DEEMED MEASURE COST
For retrofit projects, full installation costs should be used.
For new construction projects, costs should be limited to incremental material and labor costs associated with the
portion of insulation that exceeds code requirements.
LOADSHAPE
Filed with the Iowa Utilities Board on September 23, 2020, EEP-2018-0002

Iowa Energy Efficiency Statewide Technical Reference Manual –3.7.3 Roof Insulation
Vol.3 Nonresidential Measures July 22, 2020 FINAL Page 335 of 410
NREC01:16 – Nonresidential Cooling (by Building Type)
NREH01:16 – Nonresidential Electric Heat (by Building Type)
NREP01:16 – Nonresidential Electric Heat Pump (by Building Type)
NRGH01:16 – Nonresidential Gas Heating (by Building Type)
Algorithm
CALCULATION OF ENERGY SAVINGS
ELECTRIC ENERGY SAVINGS
Electric energy savings is calculated as the sum of energy saved when cooling the building and energy saved when
heating the building
∆kWh = ∆kWh
cooling
+ ∆kWh
heating
If central cooling, the electric energy saved in annual cooling due to the added insulation is
Where:
R
existing
= CompleteComplete roof assembly heat loss coefficient with existing insulation [(hr-⁰F-
ft
2
)/Btu]
703
R
new
= Complete roof assembly heat loss coefficient with new insulation [(hr-⁰F-ft
2
)/Btu]
Area = Area of the insulated roof surface in square feet, as measured from within the
conditioned space (area of overhangs or eaves should be excluded, for example).
LH
cooling
= Load Hours for Cooling [hr] are provided in Section 3.7, Shell end use
ΔT
AVG,cooling
= Average temperature difference [⁰F] during cooling season between outdoor air
temperature and assumed 75⁰F indoor air temperature
Climate Zone
(City based upon)
OA
AVG,cooling
[°F]
704
ΔT
AVG,cooling
[°F]
Zone 5 (Burlington)
80.4
5.4
Zone 6 (Mason City)
75.2
0.2
Average/unknown
78.6
3.6
1,000 = Conversion from Btu to kBtu
703
In addition to the nominal value of the insulation, assembly design and materials also need to be considered for their impact
on the overall insulation properties of the complete structural assembly. This exercise is best left as a site or project specific
determination. For those desiring a more streamlined or prescriptive approach toward estimating assembly R-values, ASHRAE
Standard 90.1 2019 dedicates Normative Appendix A “Rated R-Value of Insulation and Assembly U-Factor, C-Factor, and F-
Factor Determinations” to outline an approach using convenient lookup tables.
704
National Solar Radiation Data Base -- 1991- 2005 Update: Typical Meteorological Year 3
http://rredc.nrel.gov/solar/old_data/nsrdb/1991-2005/tmy3/by_state_and_city.html . Heating Season defined as September
17
th
through April 13
th
, cooling season defined as May 20 through August 15
th
. For cooling season, temperatures from 8AM to
8PM were used to establish average temperatures as this is when cooling systems are expected to be loaded.
Filed with the Iowa Utilities Board on September 23, 2020, EEP-2018-0002

Iowa Energy Efficiency Statewide Technical Reference Manual –3.7.3 Roof Insulation
Vol.3 Nonresidential Measures July 22, 2020 FINAL Page 336 of 410
η
cooling
= Seasonal energy efficiency ratio (SEER) of cooling system (kBtu/kWh)
= Actual
If the building is heated with electric heat (resistance or heat pump), the electric energy saved in annual heating
due to the added insulation is:
Where:
LH
heating
= Load Hours for Heating [hr] are provided in Section 3.7, Shell end use
ΔT
AVG,heating
= Average temperature difference [⁰F] during heating season between outdoor air
temperature and assumed 55⁰F heating base temperature
Climate Zone
(City based upon)
OA
AVG,heating
[°F]
705
ΔT
AVG,heating
[°F]
Zone 5 (Burlington)
39.6
15.4
Zone 6 (Mason City)
30.1
24.9
Average/unknown
35.9
19.1
3,142 = Conversion from Btu to kWh.
η
heating
= Efficiency of heating system
= Actual. Note: electric resistance heating and heat pumps will have an efficiency
greater than or equal to 100%
If the building is heated with a gas furnace, there will be some electric savings in heating the building attributed to
extra insulation since the furnace fans will run less.
∆kWh
heating
= ∆Therms * Fe * 29.3
Where:
∆Therms = Gas savings calculated with equation below.
Fe = Percentage of heating energy consumed by fans, assume 3.14%
706
705
National Solar Radiation Data Base -- 1991- 2005 Update: Typical Meteorological Year 3
http://rredc.nrel.gov/solar/old_data/nsrdb/1991-2005/tmy3/by_state_and_city.html . Heating Season defined as September
17
th
through April 13
th
, cooling season defined as May 20 through August 15
th
. For cooling season, temperatures from 8AM to
8PM were used to establish average temperatures as this is when cooling systems are expected to be loaded.
706
F
e
is not one of the AHRI certified ratings provided for furnaces, but can be reasonably estimated from a calculation based
on the certified values for fuel energy (Ef in MMBtu/yr) and Eae (kWh/yr). An average of a 300 record sample (non-random)
For example, for a small retail building with insulation entirely above deck in Climate Zone 6 with 1,500 ft
2
of
R-20 roof insulated to R-35, 10.5 SEER central AC, and 1.92 COP heat pump system:
ΔkWh = ΔkWh
cooling
+ ΔkWh
heating
= ((1/20 – 1/35) * 1,500 * 1.0 * 1,839 * 0.2 / (1,000 * 10.5)) + ((1/20 – 1/35) * 1,500 * 1.0 *
4,935 * 24.9/ (3,412 * 1.92))
= 1.1 + 602.9
= 604 kWh
Filed with the Iowa Utilities Board on September 23, 2020, EEP-2018-0002

Iowa Energy Efficiency Statewide Technical Reference Manual –3.7.3 Roof Insulation
Vol.3 Nonresidential Measures July 22, 2020 FINAL Page 337 of 410
29.3 = Conversion from therms to kWh
SUMMER COINCIDENT PEAK DEMAND SAVINGS
Where:
LH
cooling
= Load hours of air conditioning are provided in Section 3.7, Shell end use
CF = Summer System Peak Coincidence Factor for Cooling (dependent on building type)
Building Type
CF
707
Model Source
Convenience
92.3%
eQuest
Education
96.7%
OpenStudio
Grocery
100.0%
OpenStudio
Health
100.0%
OpenStudio
Hospital
98.6%
OpenStudio
Industrial
44.6%
eQuest
Lodging
97.4%
OpenStudio
Multifamily
100.0%
OpenStudio
Office - Large
98.8%
OpenStudio
Office - Small
100.0%
OpenStudio
Religious
94.3%
eQuest
Restaurant
99.6%
OpenStudio
Retail - Large
87.6%
eQuest
Retail - Small
100.0%
OpenStudio
Warehouse
77.9%
eQuest
Nonresidential Average
708
92.3%
N/A
out of 1495 was 3.14% for residential units. This is, appropriately, ~50% greater than the Energy Star version 3 criteria for 2%
F
e
. See “Programmable Thermostats Furnace Fan Analysis.xlsx” for reference. Assumed to be consistent with C&I applications.
707
This calculation is the total savings in peak hour demand divided by the total savings in absolute peak demand, from
models..
708
For weighting factors, see HVAC variable table in section 3.3.
For example, for a small retail building with insulation entirely above deck in Climate Zone 6 with 1,500 ft
2
of
R-20 roof insulated to R-35, and a gas furnace with system efficiency of 70%:
ΔkWh = 56.5 * 0.0314 *29.3
= 52.0 kWh
For example, for a small retail building with insulation entirely above deck in Climate Zone 6 with 1,500 ft
2
of
R-20 roof insulated to R-35, and 10.5 SEER central AC:
ΔkW = 1.1/1,839 * 1.00
= 0.0006 kW
Filed with the Iowa Utilities Board on September 23, 2020, EEP-2018-0002

Iowa Energy Efficiency Statewide Technical Reference Manual –3.7.3 Roof Insulation
Vol.3 Nonresidential Measures July 22, 2020 FINAL Page 338 of 410
NATURAL GAS SAVINGS
If building uses a gas heating system, the savings resulting from the insulation is calculated with the following
formula.
Where:
R
existing
= Complete roof heat loss coefficient with existing insulation [(hr-⁰F-ft
2
)/Btu]
R
new
= Complete roof heat loss coefficient with new insulation [(hr-⁰F-ft
2
)/Btu]
Area = Area of the insulated roof surface in square feet. Assume 1000 sq ft for planning.
LH
heating
=Load Hours for Heating are provided in Section 3.7, Shell end use
ΔT
AVG,heating
= Average temperature difference [⁰F] during heating season (see above)
100,000 = Conversion from BTUs to Therms
η
heat
= Efficiency of heating system
= Actual
PEAK GAS SAVINGS
Where:
ΔTherms = Therm impact calculated above
GCF = Gas Coincidence Factor for Heating
Building Type
GCF
709
Model Source
Convenience
0.016482
eQuest
Education
0.011480
OpenStudio
Grocery
0.013083
OpenStudio
Health
0.010179
OpenStudio
Hospital
0.015543
OpenStudio
Industrial
0.014296
eQuest
Lodging
0.013205
OpenStudio
Multifamily
0.012268
OpenStudio
Office - Large
0.013082
OpenStudio
Office - Small
0.016718
OpenStudio
Religious
0.011964
eQuest
Restaurant
0.015262
OpenStudio
Retail - Large
0.013281
eQuest
709
Calculated as the percentage of total savings in the maximum saving day, from models.
For example, for a small retail building with insulation entirely above deck in Climate Zone 6 with 1,500 ft
2
of
R-20 roof insulated to R-35, and a gas furnace with system efficiency of 70%:
ΔTherms = ((1/20 – 1/35) * 1,500 * 1.0 * 4,4584,935 * 24.9/ (100,000 * 0.70))
= 56.5 therms
Filed with the Iowa Utilities Board on September 23, 2020, EEP-2018-0002

Iowa Energy Efficiency Statewide Technical Reference Manual –3.7.3 Roof Insulation
Vol.3 Nonresidential Measures July 22, 2020 FINAL Page 339 of 410
Building Type
GCF
709
Model Source
Retail - Small
0.014055
OpenStudio
Warehouse
0.015677
eQuest
Nonresidential Average
710
0.014658
N/A
WATER IMPACT DESCRIPTIONS AND CALCULATION
N/A
DEEMED O&M COST ADJUSTMENT CALCULATION
N/A
MEASURE CODE: NR-SHL-XINS-V05-210101
SUNSET DATE: 1/1/2024
710
For weighting factors, see HVAC variable table in section 3.3.
For example, for a small retail building with insulation entirely above deck in Climate Zone 6 with 1,500 ft
2
of
R-20 roof insulated to R-35, and a gas furnace with system efficiency of 70%:
ΔPeakTherms = 56.5 * 0.014055
= 0.794 therms
Filed with the Iowa Utilities Board on September 23, 2020, EEP-2018-0002

Iowa Energy Efficiency Statewide Technical Reference Manual –3.7.4 Wall Insulation
Vol.3 Nonresidential Measures July 22, 2020 FINAL Page 340 of 410
3.7.4. Wall Insulation
DESCRIPTION
Energy and demand saving are realized through reductions in the building cooling and heating loads.
This measure was developed to be applicable to the following program types: RF and NC.
If applied to other program types, the measure savings should be verified.
DEFINITION OF EFFICIENT EQUIPMENT
The efficient condition is insulation levels that exceed code requirements and should be determined by the
program. IECC 2012 requirements are shown in the following tables:
ASHRAE/IECC Climate Zone 5 (A, B, C)
Nonresidential
Assembly
Maximum
Insulation Min.
R-Value
Mass
U-0.078
R-11.4 ci
Metal Building
U-0.052
R-13 + R-13 ci
Metal Framed
U-0.064
R-13 + R-7.5 ci
Wood Framed
and Other
U-0.064
R-13 + R-3.8 ci
or R-20
ASHRAE/IECC Climate Zone 6 (A, B, C)
Nonresidential
Assembly
Maximum
Insulation Min.
R-Value
Mass
U-0.078
R-13.1 ci
Metal Building
U-0.052
R-13 + R-13 ci
Metal Framed
U-0.064
R-13 + R-7.5 ci
Wood Framed
and Other
U-0.051
R-13 + R-7.5 ci
or R-20 + R-3.8 ci
Note: ci = continuous insulation
DEFINITION OF BASELINE EQUIPMENT
The retrofit baseline condition is the existing condition and requires assessment of the existing insulation. It should
be based on the entire wall assembly. If existing condition is unknown, assume IECC 2006.
The new construction baseline is code requirement, IECC 2012.
DEEMED LIFETIME OF EFFICIENT EQUIPMENT
The measure expected useful life (EUL) is assumed to be 20 years per DEER 2008. This is consistent with SDG&E’s
9th Year Measure Retrofit Study (1996 & 1997 Residential Weatherization Programs), CPUC’s Energy Efficiency
Policy Manual v.2, and GDS’s Measure Life Report Residential and Commercial/Industrial Lighting and HVAC
Measures (June 2007).
DEEMED MEASURE COST
For retrofit projects, full installation costs should be used.
Filed with the Iowa Utilities Board on September 23, 2020, EEP-2018-0002

Iowa Energy Efficiency Statewide Technical Reference Manual –3.7.4 Wall Insulation
Vol.3 Nonresidential Measures July 22, 2020 FINAL Page 341 of 410
For new construction projects, costs should be limited to incremental material and labor costs associated with the
portion of insulation that exceeds code requirements.
LOADSHAPE
NREC01:16 – Nonresidential Cooling (by Building Type)
NREH01:16 – Nonresidential Electric Heat (by Building Type)
NREP01:16 – Nonresidential Electric Heat Pump (by Building Type)
NRGH01:16 – Nonresidential Gas Heating (by Building Type)
Algorithm
CALCULATION OF ENERGY SAVINGS
ELECTRIC ENERGY SAVINGS
Electric energy savings is calculated as the sum of energy saved when cooling the building and energy saved when
heating the building
∆kWh = ∆kWh
cooling
+ ∆kWh
heating
If central cooling, the electric energy saved in annual cooling due to the added insulation is:
Where:
R
existing
= Complete wall assembly heat loss coefficient with existing insulation [(hr-⁰F-
ft
2
)/Btu]
711
R
new
= Complete wall assembly heat loss coefficient with new insulation [(hr-⁰F-ft
2
)/Btu]
Area = Area of the wall surface in square feet.
LH
cooling
= Load Hours for Cooling [hr] are provided in Section 3.7, Shell end use
ΔT
AVG,cooling
= Average temperature difference [⁰F] during cooling season between outdoor air
temperature and assumed 75⁰F indoor air temperature
Climate Zone
(City based upon)
OA
AVG,cooling
[°F]
712
ΔT
AVG,cooling
[°F]
Zone 5 (Burlington)
80.4
5.4
Zone 6 (Mason City)
75.2
0.2
Average/unknown
78.6
3.6
711
In addition to the nominal value of the insulation, assembly design and materials also need to be considered for their impact
on the overall insulation properties of the complete structural assembly. This exercise is best left as a site or project specific
determination. For those desiring a more streamlined or prescriptive approach toward estimating assembly R-values, ASHRAE
Standard 90.1 2019 dedicates Normative Appendix A “Rated R-Value of Insulation and Assembly U-Factor, C-Factor, and F-
Factor Determinations” to outline an approach using convenient lookup tables.
712
National Solar Radiation Data Base -- 1991- 2005 Update: Typical Meteorological Year 3
http://rredc.nrel.gov/solar/old_data/nsrdb/1991-2005/tmy3/by_state_and_city.html . Heating Season defined as September
17
th
through April 13
th
, cooling season defined as May 20 through August 15
th
. For cooling season, temperatures from 8AM to
8PM were used to establish average temperatures as this is when cooling systems are expected to be loaded.
Filed with the Iowa Utilities Board on September 23, 2020, EEP-2018-0002

Iowa Energy Efficiency Statewide Technical Reference Manual –3.7.4 Wall Insulation
Vol.3 Nonresidential Measures July 22, 2020 FINAL Page 342 of 410
1,000 = Conversion from Btu to kBtu
η
cooling
= Seasonal energy efficiency ratio (SEER) of cooling system (kBtu/kWh)
= Actual
If the building is heated with electric heat (resistance or heat pump), the electric energy saved in annual heating
due to the added insulation is:
Where:
LH
heating
= Load Hours for Heating [hr] are provided in Section 3.7, Shell end use
ΔT
AVG,heating
= Average temperature difference [⁰F] during heating season between outdoor air
temperature and assumed 55⁰F heating base temperature
Climate Zone
(City based upon)
OA
AVG,heating
[°F]
713
ΔT
AVG,heating
[°F]
Zone 5 (Burlington)
39.6
15.4
Zone 6 (Mason City)
30.1
24.9
Average/unknown
35.9
19.1
3,142 = Conversion from Btu to kWh.
η
heating
= Efficiency of heating system
= Actual. Note: electric resistance heating and heat pumps will have an efficiency
greater than or equal to 100%
If the building is heated with a gas furnace, there will be some electric savings in heating the building attributed to
extra insulation since the furnace fans will run less.
∆kWh
heating
= ∆Therms * Fe * 29.3
Where:
∆Therms = Gas savings calculated with equation below.
Fe = Percentage of heating energy consumed by fans, assume 3.14%
714
29.3 = Conversion from therms to kWh
SUMMER COINCIDENT PEAK DEMAND SAVINGS
Where:
713
National Solar Radiation Data Base -- 1991- 2005 Update: Typical Meteorological Year 3
http://rredc.nrel.gov/solar/old_data/nsrdb/1991-2005/tmy3/by_state_and_city.html . Heating Season defined as September
17
th
through April 13
th
, cooling season defined as May 20 through August 15
th
. For cooling season, temperatures from 8AM to
8PM were used to establish average temperatures as this is when cooling systems are expected to be loaded.
714
F
e
is not one of the AHRI certified ratings provided for furnaces, but can be reasonably estimated from a calculation based
on the certified values for fuel energy (Ef in MMBtu/yr) and Eae (kWh/yr). An average of a 300 record sample (non-random)
out of 1495 was 3.14% for residential units. This is, appropriately, ~50% greater than the Energy Star version 3 criteria for 2%
F
e
. See “Programmable Thermostats Furnace Fan Analysis.xlsx” for reference. Assumed to be consistent with C&I applications.
Filed with the Iowa Utilities Board on September 23, 2020, EEP-2018-0002

Iowa Energy Efficiency Statewide Technical Reference Manual –3.7.4 Wall Insulation
Vol.3 Nonresidential Measures July 22, 2020 FINAL Page 343 of 410
LH
cooling
= Load hours of air conditioning are provided in Section 3.7, Shell end use
CF = Summer System Peak Coincidence Factor for Cooling (dependent on building type)
Building Type
CF
715
Model Source
Convenience
92.3%
eQuest
Education
96.7%
OpenStudio
Grocery
100.0%
OpenStudio
Health
100.0%
OpenStudio
Hospital
98.6%
OpenStudio
Industrial
44.6%
eQuest
Lodging
97.4%
OpenStudio
Multifamily
100.0%
OpenStudio
Office - Large
98.8%
OpenStudio
Office - Small
100.0%
OpenStudio
Religious
94.3%
eQuest
Restaurant
99.6%
OpenStudio
Retail - Large
87.6%
eQuest
Retail - Small
100.0%
OpenStudio
Warehouse
77.9%
eQuest
Nonresidential Average
716
92.3%
N/A
NATURAL GAS SAVINGS
If building uses a gas heating system, the savings resulting from the insulation is calculated with the following
formula.
Where:
R
existing
= Complete wall heat loss coefficient with existing insulation [(hr-⁰F-ft
2
)/Btu]
R
new
= Complete wall heat loss coefficient with new insulation [(hr-⁰F-ft
2
)/Btu]
Area = Area of the wall surface in square feet. Assume 1000 sq ft for planning.
LH
heating
= Load Hours for Heating are provided in Section 3.7, Shell end use
ΔT
AVG,heating
= Average temperature difference [⁰F] during heating season (see above)
100,000 = Conversion from BTUs to Therms
η
heat
= Efficiency of heating system
= Actual
PEAK GAS SAVINGS
Where:
715
This calculation is the total savings in peak hour demand divided by the total savings in absolute peak demand.
716
For weighting factors, see HVAC variable table in section 3.3.
Filed with the Iowa Utilities Board on September 23, 2020, EEP-2018-0002

Iowa Energy Efficiency Statewide Technical Reference Manual –3.7.4 Wall Insulation
Vol.3 Nonresidential Measures July 22, 2020 FINAL Page 344 of 410
ΔTherms = Therm impact calculated above
GCF = Gas Coincidence Factor for Heating
Building Type
GCF
717
Model Source
Convenience
0.016482
eQuest
Education
0.011480
OpenStudio
Grocery
0.013083
OpenStudio
Health
0.010179
OpenStudio
Hospital
0.015543
OpenStudio
Industrial
0.014296
eQuest
Lodging
0.013205
OpenStudio
Multifamily
0.012268
OpenStudio
Office - Large
0.013082
OpenStudio
Office - Small
0.016718
OpenStudio
Religious
0.011964
eQuest
Restaurant
0.015262
OpenStudio
Retail - Large
0.013281
eQuest
Retail - Small
0.014055
OpenStudio
Warehouse
0.015677
eQuest
Nonresidential Average
718
0.014658
N/A
WATER IMPACT DESCRIPTIONS AND CALCULATION
N/A
DEEMED O&M COST ADJUSTMENT CALCULATION
N/A
MEASURE CODE: NR-SHL-WINS-V03-210101
SUNSET DATE: 1/1/2024
717
Calculated as the percentage of total savings in the maximum saving day, from models.
718
For weighting factors, see HVAC variable table in section 3.3.
Filed with the Iowa Utilities Board on September 23, 2020, EEP-2018-0002

Iowa Energy Efficiency Statewide Technical Reference Manual –3.7.5 Efficient Windows
Vol.3 Nonresidential Measures July 22, 2020 FINAL Page 345 of 410
3.7.5. Efficient Windows
DESCRIPTION
This measure describes savings realized by the purchase and installation of new windows that have better thermal
insulating properties compared to code requirements. For a comprehensive estimate of impacts, including the
effects of solar gains, computer modeling is recommended.
This measure was developed to be applicable to the following program types: NC, TOS.
If applied to other program types, the measure savings should be verified.
DEFINITION OF EFFICIENT EQUIPMENT
The efficient solution is a window assembly with a U-factor that is better than code and a Solar Heat Gain Coefficient
(SHGC) that is at least equal to but not greater than code requirements (0.4).
DEFINITION OF BASELINE EQUIPMENT
The baseline condition is a window assembly with a U-factor and Solar Heat Gain Coefficient (SHGC) that are equal
to code requirements, IECC 2012.
DEEMED LIFETIME OF EFFICIENT EQUIPMENT
The expected measure life is assumed to be 20 years.
719
DEEMED MEASURE COST
The incremental cost for this measure is assumed to be $1.50 per square foot of window area.
720
LOADSHAPE
NREC01:16 – Nonresidential Cooling (by Building Type)
NREH01:16 – Nonresidential Electric Heat (by Building Type)
NREP01:16 – Nonresidential Electric Heat Pump (by Building Type)
NRGH01:16 – Nonresidential Gas Heating (by Building Type)
Algorithm
CALCULATION OF SAVINGS
The following calculations apply to a single window assembly. Note that the effects of a lower SHGC are not
considered in this characterization. A lower SHGC does not necessarily equate to net savings due to the possible
opposite effects it can have on heating and cooling loads. For optimum design and estimation of impacts from solar
gain, a custom analysis should be performed that takes into account building site and orientation considerations.
ELECTRIC ENERGY SAVINGS
Electric energy savings is calculated as the sum of energy saved when cooling the building and energy saved when
heating the building
719
Consistent with window measure lives specified in the MidAmerican Energy Company Joint Assessment, February 2013.
720
Alliance to Save Energy Efficiency Windows Collaborative Report, December 2007. Consistent with other market reports.
Filed with the Iowa Utilities Board on September 23, 2020, EEP-2018-0002

Iowa Energy Efficiency Statewide Technical Reference Manual –3.7.5 Efficient Windows
Vol.3 Nonresidential Measures July 22, 2020 FINAL Page 346 of 410
If central cooling, the electric energy saved in annual cooling due to the added insulation is
Where:
U
code
= U-factor value of code baseline window assembly (Btu/ft
2
.°F.h)
= Dependent on climate zone and window type. If unknown, assume the most
conservative value, 0.36. See table below for IECC2012 requirements:
Climate Zone
5
6
U-Factor, based on
window type
Fixed
0.38
0.36
Openable
0.45
0.43
U
eff
= U-factor value of the efficient window assembly (Btu/ft
2
.°F.h)
= Actual.
A
window
= Area of insulated window (including visible frame and glass) (ft
2
)
LH
cooling
Load Hours for Cooling [hr] are provided in Section 3.7, Shell end use
ΔT
AVG,cooling
= Average temperature difference [⁰F] during cooling season between outdoor air
temperature and assumed 75⁰F indoor air temperature
Climate Zone
(City based upon)
OA
AVG,cooling
[°F]
721
ΔT
AVG,cooling
[°F]
Zone 5 (Burlington)
80.4
5.4
Zone 6 (Mason City)
75.2
0.2
Average/unknown
78.6
3.6
1,000 = Conversion from Btu to kBtu
η
cooling
= Energy efficiency ratio (EER) of cooling system (kBtu/kWh)
= Actual. If not directly specified, EER may be calculated from other commonly listed
efficiency ratings (kW/ton or COP):
EER = 12 / kW/ton
EER = COP x 3.412
= if unknown, adopt the default baseline efficiency of the relevant HVAC equipment as
defined by the corresponding TRM characterization
If the building is heated with electric heat (resistance or heat pump), the electric energy saved in annual heating
due to the added insulation is:
Where:
721
National Solar Radiation Data Base -- 1991- 2005 Update: Typical Meteorological Year 3
http://rredc.nrel.gov/solar/old_data/nsrdb/1991-2005/tmy3/by_state_and_city.html . Heating Season defined as September
17
th
through April 13
th
, cooling season defined as May 20 through August 15
th
. For cooling season, temperatures from 8AM to
8PM were used to establish average temperatures as this is when cooling systems are expected to be loaded.
Filed with the Iowa Utilities Board on September 23, 2020, EEP-2018-0002

Iowa Energy Efficiency Statewide Technical Reference Manual –3.7.5 Efficient Windows
Vol.3 Nonresidential Measures July 22, 2020 FINAL Page 347 of 410
LH
heating
= Load Hours for Heating [hr] are provided in Section 3.7, Shell end use
ΔT
AVG,heating
= Average temperature difference [⁰F] during heating season between outdoor air
temperature and assumed 55⁰F heating base temperature
Climate Zone
(City based upon)
OA
AVG,heating
[°F]
722
ΔT
AVG,heating
[°F]
Zone 5 (Burlington)
39.6
15.4
Zone 6 (Mason City)
30.1
24.9
Average/unknown
35.9
19.1
3,142 = Conversion from Btu to kWh.
η
heating
= Efficiency of heating system, expressed as COP
= Actual. For equipment with HSPF ratings, use the following conversion to COP:
COP = HSPF/3.413
= if unknown, adopt the default baseline efficiency of the relevant HVAC equipment
as defined by the corresponding TRM characterization
Other factors as defined above.
If the building is heated with a gas furnace, there will be some electric savings in heating the building attributed to
extra insulation since the furnace fans will run less.
∆kWh
heating
= ∆Therms * Fe * 29.3
Where:
∆Therms = Gas savings calculated with equation below.
Fe = Percentage of heating energy consumed by fans, assume 3.14%
723
29.3 = Conversion from therms to kWh
722
National Solar Radiation Data Base -- 1991- 2005 Update: Typical Meteorological Year 3
http://rredc.nrel.gov/solar/old_data/nsrdb/1991-2005/tmy3/by_state_and_city.html . Heating Season defined as September
17
th
through April 13
th
, cooling season defined as May 20 through August 15
th
. For cooling season, temperatures from 8AM to
8PM were used to establish average temperatures as this is when cooling systems are expected to be loaded.
723
F
e
is not one of the AHRI certified ratings provided for furnaces, but can be reasonably estimated from a calculation based
on the certified values for fuel energy (Ef in MMBtu/yr) and Eae (kWh/yr). An average of a 300 record sample (non-random)
out of 1495 was 3.14% for residential units. This is, appropriately, ~50% greater than the Energy Star version 3 criteria for 2%
F
e
. See “Programmable Thermostats Furnace Fan Analysis.xlsx” for reference. Assumed to be consistent with C&I applications.
For example, for a restaurant in Mason City (climate zone 6) installing 15 new identically sized 2’ x 4’ openable
windows with a 0.25 U-Factor, savings with a 12.0 EER AC system and a 1.92 COP Heat Pump system:
ΔkWh = ΔkWh
cooling
+ ΔkWh
heating
= (((0.43 – 0.25) * 8 * 2,217 * 0.2) / (1000 * 12.0)) + (((0.43 – 0.25) *8 * 3,619 * 24.9) / (3,412
* 1.92)) * 15
= (0.053 + 19.8) * 15
= 397.8 kWh
Filed with the Iowa Utilities Board on September 23, 2020, EEP-2018-0002

Iowa Energy Efficiency Statewide Technical Reference Manual –3.7.5 Efficient Windows
Vol.3 Nonresidential Measures July 22, 2020 FINAL Page 348 of 410
SUMMER COINCIDENT PEAK DEMAND SAVINGS
Where:
LH
cooling
=Load hours of air conditioning are provided in Section 3.7, Shell end use
CF = Summer System Peak Coincidence Factor for Cooling (dependent on building type)
Building Type
CF
724
Model Source
Convenience
92.3%
eQuest
Education
96.7%
OpenStudio
Grocery
100.0%
OpenStudio
Health
100.0%
OpenStudio
Hospital
98.6%
OpenStudio
Industrial
44.6%
eQuest
Lodging
97.4%
OpenStudio
Multifamily
100.0%
OpenStudio
Office - Large
98.8%
OpenStudio
Office - Small
100.0%
OpenStudio
Religious
94.3%
eQuest
Restaurant
99.6%
OpenStudio
Retail - Large
87.6%
eQuest
Retail - Small
100.0%
OpenStudio
Warehouse
77.9%
eQuest
Nonresidential Average
725
92.3%
N/A
NATURAL GAS SAVINGS
If building uses a gas heating system, the savings resulting from the insulation is calculated with the following
formula.
Where:
U
code
= U-factor value of code baseline window assembly (Btu/ft
2
.°F.h)
724
This calculation is the total savings in peak hour demand divided by the total savings in absolute peak demand, from models.
725
For weighting factors, see HVAC variable table in section 3.3.
For example, for a restaurant in Mason City (climate zone 6) installing 15 new identically sized 2’ x 4’ openable
windows with a 0.25 U-Factor, savings with a gas furnace with system efficiency of 70%:
ΔkWh = 73.0 * 0.0314 * 29.3
= 67.2 kWh
For example, for a restaurant in Mason City (climate zone 6) installing 15 new identically sized 2’ x 4’ openable
windows with a 0.25 U-Factor, savings with a 12.0 EER AC system:
ΔkW = (0.053 * 15) / 2,217 * 0.996
= 0.0004 kW
Filed with the Iowa Utilities Board on September 23, 2020, EEP-2018-0002

Iowa Energy Efficiency Statewide Technical Reference Manual –3.7.5 Efficient Windows
Vol.3 Nonresidential Measures July 22, 2020 FINAL Page 349 of 410
= Dependent on climate zone and window type. See table below:
Climate Zone
5
6
U-Factor, based on
window type
Fixed
0.38
0.36
Openable
0.45
0.43
U
eff
= U-factor value of the efficient window assembly (Btu/ft
2
.°F.h)
= Actual.
A
window
= Net area of insulated window (ft
2
)
LH
heating
= Load Hours for Heating are provided in Section 3.7, Shell end use
ΔT
AVG,heating
= Average temperature difference [⁰F] during heating season (see above)
100,000 = Conversion from BTUs to Therms
η
heat
= Efficiency of heating system
= Actual
= if unknown, adopt the default baseline efficiency of the relevant HVAC equipment as
defined by the corresponding TRM characterization
PEAK GAS SAVINGS
Where:
ΔTherms = Therm impact calculated above
GCF = Gas Coincidence Factor for Heating
Building Type
GCF
726
Model Source
Convenience
0.016482
eQuest
Education
0.011480
OpenStudio
Grocery
0.013083
OpenStudio
Health
0.010179
OpenStudio
Hospital
0.015543
OpenStudio
Industrial
0.014296
eQuest
Lodging
0.013205
OpenStudio
Multifamily
0.012268
OpenStudio
Office - Large
0.013082
OpenStudio
Office - Small
0.016718
OpenStudio
Religious
0.011964
eQuest
Restaurant
0.015262
OpenStudio
726
Calculated as the percentage of total savings in the maximum saving day, from models.
For example, a restaurant in Mason City (climate zone 6) installing 15 new identically sized 2’ x 4’ openable
windows with a 0.25 U-Factor, savings with a gas furnace with system efficiency of 70%:
ΔTherms = (((0.43 – 0.25) * 21 * 3,6194,767 * 24.9) / (100,000 * 0.70)) * 15
= 73.0
Filed with the Iowa Utilities Board on September 23, 2020, EEP-2018-0002

Iowa Energy Efficiency Statewide Technical Reference Manual –3.7.5 Efficient Windows
Vol.3 Nonresidential Measures July 22, 2020 FINAL Page 350 of 410
Building Type
GCF
726
Model Source
Retail - Large
0.013281
eQuest
Retail - Small
0.014055
OpenStudio
Warehouse
0.015677
eQuest
Nonresidential Average
727
0.014658
N/A
WATER IMPACT DESCRIPTIONS AND CALCULATION
N/A
DEEMED O&M COST ADJUSTMENT CALCULATION
N/A
MEASURE CODE: NR-SHL-WIND-V05-210101
SUNSET DATE: 1/1/2024
727
For weighting factors, see HVAC variable table in section 3.3.
For example, a restaurant in Mason City (climate zone 6) installing 15 new identically sized 2’ x 4’ openable
windows with a 0.25 U-Factor, savings with a gas furnace with system efficiency of 70%:
ΔPeakTherms = 73.0 * 0.015262
= 1.11
therms
Filed with the Iowa Utilities Board on September 23, 2020, EEP-2018-0002

Iowa Energy Efficiency Statewide Technical Reference Manual –3.7.6 Insulated Doors
Vol.3 Nonresidential Measures July 22, 2020 FINAL Page 351 of 410
3.7.6. Insulated Doors
DESCRIPTION
Energy and demand saving are realized through reductions in the building cooling and heating loads.
This measure was developed to be applicable to the following program types: RF
If applied to other program types, the measure savings should be verified.
DEFINITION OF EFFICIENT EQUIPMENT
The efficient condition is an exterior door with insulation levels that exceed code requirements and should be
determined by the program.
DEFINITION OF BASELINE EQUIPMENT
The retrofit baseline condition is the existing condition of the exterior door and requires assessment of the existing
insulation. It should be based on the entire door assembly. If existing condition is unknown, assume IECC 2006.
DEEMED LIFETIME OF EFFICIENT EQUIPMENT
The measure expected useful life (EUL) is assumed to be 25 years.
728
DEEMED MEASURE COST
For retrofit projects, full installation costs should be used.
LOADSHAPE
NREC01:16 – Nonresidential Cooling (by Building Type)
NREH01:16 – Nonresidential Electric Heat (by Building Type)
NREP01:16 – Nonresidential Electric Heat Pump (by Building Type)
NRGH01:16 – Nonresidential Gas Heating (by Building Type)
Algorithm
CALCULATION OF ENERGY SAVINGS
ELECTRIC ENERGY SAVINGS
Electric energy savings is calculated as the sum of energy saved when cooling the building and energy saved when
heating the building
∆kWh = ∆kWh
cooling
+ ∆kWh
heating
If central cooling, the electric energy saved in annual cooling due to the added insulation is
Where:
728
FannieMae Estimated useful life tables for multifamily properties, judged to be applicable to C&I facilities as well.
Filed with the Iowa Utilities Board on September 23, 2020, EEP-2018-0002

Iowa Energy Efficiency Statewide Technical Reference Manual –3.7.6 Insulated Doors
Vol.3 Nonresidential Measures July 22, 2020 FINAL Page 352 of 410
R
existing
= Existing door heat loss coefficient [(hr-⁰F-ft
2
)/Btu]. If unknown, assume 2.7 for
swinging door, 4.75 for nonswinging door.
729
R
new
= New door heat loss coefficient [(hr-⁰F-ft
2
)/Btu]
Area = Area of the door surface in square feet.
LH
cooling
= Load Hours for Cooling [hr] are provided in Section 3.7, Shell end use
ΔT
AVG,cooling
= Average temperature difference [⁰F] during cooling season between outdoor air
temperature and assumed 75⁰F indoor air temperature
Climate Zone
(City based upon)
OA
AVG,cooling
[°F]
730
ΔT
AVG,cooling
[°F]
Zone 5 (Burlington)
80.4
5.4
Zone 6 (Mason City)
75.2
0.2
Average/unknown
78.6
3.6
1,000 = Conversion from Btu to kBtu
η
cooling
= Seasonal energy efficiency ratio (SEER) of cooling system (kBtu/kWh)
= Actual
If the building is heated with electric heat (resistance or heat pump), the electric energy saved in annual heating
due to the added insulation is:
Where:
LH
heating
= Load Hours for Heating [hr] are provided in Section 3.7, Shell end use
ΔT
AVG,heating
= Average temperature difference [⁰F] during heating season between outdoor air
temperature and assumed 55⁰F heating base temperature
Climate Zone
(City based upon)
OA
AVG,heating
[°F]
731
ΔT
AVG,heating
[°F]
Zone 5 (Burlington)
39.6
15.4
Zone 6 (Mason City)
30.1
24.9
Average/unknown
35.9
19.1
3,142 = Conversion from Btu to kWh.
η
heating
= Efficiency of heating system
729
IECC 2012 and 2015 code requirement
730
National Solar Radiation Data Base -- 1991- 2005 Update: Typical Meteorological Year 3
http://rredc.nrel.gov/solar/old_data/nsrdb/1991-2005/tmy3/by_state_and_city.html . Heating Season defined as September
17
th
through April 13
th
, cooling season defined as May 20 through August 15
th
. For cooling season, temperatures from 8AM to
8PM were used to establish average temperatures as this is when cooling systems are expected to be loaded.
731
National Solar Radiation Data Base -- 1991- 2005 Update: Typical Meteorological Year 3
http://rredc.nrel.gov/solar/old_data/nsrdb/1991-2005/tmy3/by_state_and_city.html . Heating Season defined as September
17
th
through April 13
th
, cooling season defined as May 20 through August 15
th
. For cooling season, temperatures from 8AM to
8PM were used to establish average temperatures as this is when cooling systems are expected to be loaded.
Filed with the Iowa Utilities Board on September 23, 2020, EEP-2018-0002

Iowa Energy Efficiency Statewide Technical Reference Manual –3.7.6 Insulated Doors
Vol.3 Nonresidential Measures July 22, 2020 FINAL Page 353 of 410
= Actual. Note: electric resistance heating and heat pumps will have an efficiency
greater than or equal to 100%
If the building is heated with a gas furnace, there will be some electric savings in heating the building attributed to
extra insulation since the furnace fans will run less.
∆kWh
heating
= ∆Therms * Fe * 29.3
Where:
∆Therms = Gas savings calculated with equation below.
Fe = Percentage of heating energy consumed by fans, assume 3.14%
732
29.3 = Conversion from therms to kWh
SUMMER COINCIDENT PEAK DEMAND SAVINGS
∆kW = (∆kWh
cooling
/ LH
cooling
) * CF
Where:
LH
cooling
= Load hours of air conditioning are provided in Section 3.7, Shell end use
CF = Summer System Peak Coincidence Factor for Cooling (dependent on building type)
Building Type
CF
733
Model Source
Convenience
92.3%
eQuest
Education
96.7%
OpenStudio
Grocery
100.0%
OpenStudio
Health
100.0%
OpenStudio
Hospital
98.6%
OpenStudio
Industrial
44.6%
eQuest
Lodging
97.4%
OpenStudio
Multifamily
100.0%
OpenStudio
Office - Large
98.8%
OpenStudio
Office - Small
100.0%
OpenStudio
732
F
e
is not one of the AHRI certified ratings provided for furnaces, but can be reasonably estimated from a calculation based
on the certified values for fuel energy (Ef in MMBtu/yr) and Eae (kWh/yr). An average of a 300 record sample (non-random)
out of 1495 was 3.14% for residential units. This is, appropriately, ~50% greater than the Energy Star version 3 criteria for 2%
F
e
. See “Programmable Thermostats Furnace Fan Analysis.xlsx” for reference. Assumed to be consistent with C&I applications.
733
This calculation is the total savings in peak hour demand divided by the total savings in absolute peak demand.
For example, for a restaurant in Mason City installing a new 21 ft
2
, insulated, swinging door with an R-value of
11, savings with a 10.5 SEER central AC system and a 1.92 COP Heat Pump system:
ΔkWh = ΔkWh
cooling
+ ΔkWh
heating
= (((1/2.7 – 1/11) * 21 * 2,217 * 0.2) / (1000 * 10.5)) + (((1/2.7 – 1/11) *21 * 3,619 * 24.9) /
(3,412 * 1.92))
= 0.2 kWh + 80.7 kWh
= 80.9 kWh
For example, for a restaurant in Mason City installing a new 21 ft
2
, insulated, swinging door with an R-value of
11, savings with a gas furnace with system efficiency of 70%:
ΔkWh = 7.55 * 0.0314 * 29.3
= 6.94 kWh
Filed with the Iowa Utilities Board on September 23, 2020, EEP-2018-0002

Iowa Energy Efficiency Statewide Technical Reference Manual –3.7.6 Insulated Doors
Vol.3 Nonresidential Measures July 22, 2020 FINAL Page 354 of 410
Building Type
CF
733
Model Source
Religious
94.3%
eQuest
Restaurant
99.6%
OpenStudio
Retail - Large
87.6%
eQuest
Retail - Small
100.0%
OpenStudio
Warehouse
77.9%
eQuest
Nonresidential Average
734
92.3%
N/A
NATURAL GAS SAVINGS
If building uses a gas heating system, the savings resulting from the insulation is calculated with the following
formula.
Where:
R
existing
= Existing door heat loss [(hr-⁰F-ft
2
)/Btu]
R
new
= New door heat loss coefficient [(hr-⁰F-ft
2
)/Btu]
Area = Area of the door surface in square feet.
LH
heating
= Load Hours for Heating are provided in Section 3.7, Shell end use
ΔT
AVG,heating
= Average temperature difference [⁰F] during heating season (see above)
100,000 = Conversion from BTUs to Therms
η
heat
= Efficiency of heating system
= Actual
PEAK GAS SAVINGS
Where:
ΔTherms = Therm impact calculated above
734
For weighting factors, see HVAC variable table in section 3.3.
For example, for a restaurant in Mason City installing a new 21 ft
2
, insulated, swinging door with an R-value of
11, savings with a 10.5 SEER central AC system:
ΔkW = 0.2 / 2,2172,176 * 0.996
= 0.00009 kW
For example, for a restaurant in Mason City installing a new 21 ft
2
, insulated, swinging door with an R-value of
11, savings with a gas furnace with system efficiency of 70%:
ΔTherms = (((1/2.7 – 1/11) * 21 * 3,619 * 24.9) / (100,000 * 0.70))
= 7.55
Filed with the Iowa Utilities Board on September 23, 2020, EEP-2018-0002

Iowa Energy Efficiency Statewide Technical Reference Manual –3.7.6 Insulated Doors
Vol.3 Nonresidential Measures July 22, 2020 FINAL Page 355 of 410
GCF = Gas Coincidence Factor for Heating
Building Type
GCF
735
Model Source
Convenience
0.016482
eQuest
Education
0.011480
OpenStudio
Grocery
0.013083
OpenStudio
Health
0.010179
OpenStudio
Hospital
0.015543
OpenStudio
Industrial
0.014296
eQuest
Lodging
0.013205
OpenStudio
Multifamily
0.012268
OpenStudio
Office - Large
0.013082
OpenStudio
Office - Small
0.016718
OpenStudio
Religious
0.011964
eQuest
Restaurant
0.015262
OpenStudio
Retail - Large
0.013281
eQuest
Retail - Small
0.014055
OpenStudio
Warehouse
0.015677
eQuest
Nonresidential Average
736
0.014658
N/A
WATER IMPACT DESCRIPTIONS AND CALCULATION
N/A
DEEMED O&M COST ADJUSTMENT CALCULATION
N/A
MEASURE CODE: NR-SHL-DOOR-V05-210101
SUNSET DATE: 1/1/2024
735
Calculated as the percentage of total savings in the maximum saving day, from models.
736
For weighting factors, see HVAC variable table in section 3.3.
For example, for a restaurant in Mason City installing a new 21 ft
2
, insulated, swinging door with an R-value of
11, savings with a gas furnace with system efficiency of 70%:
ΔPeakTherms = 9.95 * 0.0152620
= 0.152 therms
Filed with the Iowa Utilities Board on September 23, 2020, EEP-2018-0002

Iowa Energy Efficiency Statewide Technical Reference Manual –3.8.1 LED Refrigerator Case Light Occupancy Sensor
Vol.3 Nonresidential Measures July 22, 2020 FINAL Page 356 of 410
3.8. Refrigeration
3.8.1. LED Refrigerator Case Light Occupancy Sensor
DESCRIPTION
Occupancy sensors are devices that reduce lighting levels and/or turn lights on or off in response to the presence
(or absence) of people in a defined area. This measure applies to the installation of occupancy sensors on linear LED
lights on commercial glass-door, reach-in coolers and freezers. Savings result from a reduction in electric energy use
by case lighting and from a reduced cooling load due to less heat gain from the lighting.
This measure applies to the following program types: RF.
DEFINITION OF EFFICIENT EQUIPMENT
To qualify for this measure, the installed equipment must be occupancy sensors meeting program requirements,
installed on linear LED lights on commercial glass-door, reach-in coolers and freezers.
DEFINITION OF BASELINE EQUIPMENT
The baseline equipment is linear LED lights without occupancy controls, installed on commercial glass-door, reach-
in coolers and freezers.
DEEMED LIFETIME OF EFFICIENT EQUIPMENT
The expected measure life is assumed to be 8 years.
737
DEEMED MEASURE COST
When available, the actual cost of the measure shall be used. When not available, use a default value of $60 per
control.
738
LOADSHAPE
Loadshape NREL01 – Nonresidential Lighting – Convenience
Loadshape NREL03 – Nonresidential Lighting – Grocery
Loadshape NREL13 – Nonresidential Lighting – Retail – Large
Loadshape NREL14 – Nonresidential Lighting – Retail – Small
Algorithm
CALCULATION OF SAVINGS
ELECTRIC ENERGY SAVINGS
Custom calculation below, otherwise use 290.8 kWh per control for coolers and 331.4 kWh per control for freezers..
737
2014 Database for Energy-Efficiency Resources (DEER), Version 2014, “Cost Values and Summary Documentation”, California
Public Utilities Commission, January, 2014.
738
Measure cost from Efficiency Vermont No. 2015-90 TRM. Based on information provided by Green Mountain Electric Supply
for a Wattstopper FS705 product.
Filed with the Iowa Utilities Board on September 23, 2020, EEP-2018-0002

Iowa Energy Efficiency Statewide Technical Reference Manual –3.8.1 LED Refrigerator Case Light Occupancy Sensor
Vol.3 Nonresidential Measures July 22, 2020 FINAL Page 357 of 410
Where:
kW
Controlled
= Total lighting load (kW) connected to the control.
= Actual, or if unknown, assume 0.090 kW
739
Hours = Annual case lighting hours of use
= Actual or if unknown, assume 6,575 hours
740
%Controlled = Percentage savings due to the occupancy sensor
= Actual or if unknown, assume 40%
741
0.80 = Percentage of heat from LED lighting assumed to be transferred to the refrigeration
system
COP = Coefficient of performance of cooler or freezer
= Actual or if unknown, use 3.5 for coolers and 2.0 for freezers
742
SUMMER COINCIDENT PEAK DEMAND SAVINGS
Where:
kWh = Electric energy savings, calculated above
CF = Summer peak coincidence factor
= 1.00 for all building types
Other variables as defined above
NATURAL GAS ENERGY SAVINGS
N/A
739
Controlled lighting load from Efficiency Vermont No. 2018 TRM, based on LED Refrig Lighting ERCO_Talking_Pointsv3, PG&E
740
Assumption for a business operating 18 hours per day
741
Case occupancy sensors are based on case studies of controls installed in Wal-Mart and Krogers refrigerator/freezer LED
case lighting controls.
742
COP values from Efficiency Vermont No. 2015-90 TRM, based on the average of standard reciprocating and discus
compressor efficiencies with Saturated Suction Temperatures of -20°F (freezers) and 20°F (coolers), and a condensing
temperature of 90°F.
For example, a cooler with an LED case light occupancy sensor installed, using the defaults above, would save:
ΔkWh = kW
Controlled
* (Hours * %Controlled) * (1 + (0.80 / COP))
ΔkWh
= 0.090 * (6,575 * 0.40) * (1 + (0.80 / 3.5))
= 290.8 kWh per control
For example, a cooler with an LED case light occupancy sensor installed, using the defaults above, would save:
ΔkW = (290.8 / 6,575) * 1.00
= 0.044 kW
Filed with the Iowa Utilities Board on September 23, 2020, EEP-2018-0002

Iowa Energy Efficiency Statewide Technical Reference Manual –3.8.1 LED Refrigerator Case Light Occupancy Sensor
Vol.3 Nonresidential Measures July 22, 2020 FINAL Page 358 of 410
PEAK GAS SAVINGS
N/A
WATER IMPACT DESCRIPTIONS AND CALCULATION
N/A
DEEMED O&M COST ADJUSTMENT CALCULATION
N/A
MEASURE CODE: NR-RFG-CLOS-V01-190101
SUNSET DATE: 1/1/2024
Filed with the Iowa Utilities Board on September 23, 2020, EEP-2018-0002

Iowa Energy Efficiency Statewide Technical Reference Manual –3.8.2 Door Heater Controls for Cooler or Freezer
Vol.3 Nonresidential Measures July 22, 2020 FINAL Page 359 of 410
3.8.2. Door Heater Controls for Cooler or Freezer
DESCRIPTION
This measure applies to door heater controls installed on commercial coolers or freezers. There are two main
categories of commercially available control strategies that achieve “on-off” control of door heaters based on either
(1) the relative humidity of the air in the store or (2) the “conductivity” of the door (which drops when condensation
appears). In the first strategy, the system activates door heaters when the relative humidity in a store rises above a
specific setpoint, and turns them off when the relative humidity falls below that setpoint. In the second strategy, the
sensor activates the door heaters when the door conductivity falls below a certain setpoint, and turns them off when
the conductivity rises above that setpoint. Savings result from a reduction in electric energy use due to heaters not
running continuously and from reduced cooling loads when heaters are off. The assumptions included within this
measure assume that door heater controls which are properly designed and commissioned will achieve
approximately equivalent savings, regardless of control strategy.
This measure applies to the following program types: RF.
DEFINITION OF EFFICIENT EQUIPMENT
To qualify for this measure, the installed equipment must be a door heater control installed on a commercial glass
door cooler or freezer.
DEFINITION OF BASELINE EQUIPMENT
The baseline equipment is a door heater without controls, installed on a commercial glass door cooler or freezer.
DEEMED LIFETIME OF EFFICIENT EQUIPMENT
The expected measure life is assumed to be 12 years.
743
DEEMED MEASURE COST
Actual equipment and labor costs should be used if available. In actual costs are unknown, assume a full installed
cost of $1,266 per heater control.
744
LOADSHAPE
Loadshape NRE01 - Nonresidential Refrigeration – Grocery
Algorithm
CALCULATION OF SAVINGS
ELECTRIC ENERGY SAVINGS
Custom calculation below, otherwise use 838.4 kWh per door for coolers and 1,020.5 kWh per door for freezers.
745
743
2008 Database for Energy-Efficiency Resources (DEER), Version 2008.2.05, “Effective/Remaining Useful Life Values”,
California Public Utilities Commission, December 16, 2008.
744
Measure cost from “Incremental Cost Study, Phase Four Final Report.” Northeast Energy Efficiency Partnerships. June 15,
2015.
745
Algorithm and assumptions from Pennsylvania June 2016 TRM with reference to Wisconsin 2010 Business Programs
Deemed Savings Manual v1.0
Filed with the Iowa Utilities Board on September 23, 2020, EEP-2018-0002

Iowa Energy Efficiency Statewide Technical Reference Manual –3.8.2 Door Heater Controls for Cooler or Freezer
Vol.3 Nonresidential Measures July 22, 2020 FINAL Page 360 of 410
Where:
kWBase = Per door electric energy consumption of door heater without controls
= Assume 0.109 kW for coolers and 0.191 kW for freezers
746
DoorFt = Door length in liner feet
= Actual or if unknown, use 2.5 feet
747
Hours = Annual hours of cooler or freezer operation
= Assume 8,766 hours per year
%Off = Percentage of hours annually that the door heater is powered off due to controls
= Actual or if unknown, assume 74% for coolers and 46% for freezers
748
R
H
= Residual heat fraction: estimated percentage of heat produced by heaters that remains
in the freezer or cooler case and must be removed by the refrigeration unit
= Actual or if unknown, use 0.65
749
COP = Coeffiecint of performance of cooler or freezer
= Actual or if unknown, use 3.5 for coolers and 2.0 for freezers
750
SUMMER COINCIDENT PEAK DEMAND SAVINGS
Where:
kWh = Electric energy savings, calculated above
CF = Summer peak coincidence factor
746
Public Service Commission of Wisconsin, Focus on Energy Evaluation, Business Programs Deemed Savings Manual, March 22,
2010
747
Review of various manufacturers’ web sites yields 2.5’ average door length. Sites include:
https://www.bushrefrigeration.com/refrigerated-display-cases/refrigerated-bakery-display-cases-for-sale,
http://www.brrr.cc/home.php?cat=427, and http://refrigeration-equipment.com/gdm_s_c_series_swing_door_reac.html
748
Values are estimates by Natural Resource Management, an implementer of commercial and industrial refrigeration controls,
based on hundreds of downloads of hours of use data from door heater controllers.
749
Public Service Commission of Wisconsin, Focus on Energy Evaluation, Business Programs Deemed Savings Manual, March 22,
2010
750
COP values from Efficiency Vermont October 22, 2015 TRM, based on the average of standard reciprocating and discus
compressor efficiencies with Saturated Suction Temperatures of -20°F (freezers) and 20°F (coolers), and a condensing
temperature of 90°F.
For example, a cooler with a door heater control would save:
ΔkWh = DoorFt * (kW
Base
/DoorFt * Hours * %Off * (1+R
H
/COP))
ΔkWh
= 2.5 * (0.109/2.5 * 8,766 * 0.74 * (1+0.65
/3.5))
= 838.4 kWh per door
Filed with the Iowa Utilities Board on September 23, 2020, EEP-2018-0002

Iowa Energy Efficiency Statewide Technical Reference Manual –3.8.2 Door Heater Controls for Cooler or Freezer
Vol.3 Nonresidential Measures July 22, 2020 FINAL Page 361 of 410
= 0.964
Other variables as defined above.
NATURAL GAS ENERGY SAVINGS
N/A
PEAK GAS SAVINGS
N/A
WATER IMPACT DESCRIPTIONS AND CALCULATION
N/A
DEEMED O&M COST ADJUSTMENT CALCULATION
N/A
MEASURE CODE: NR-RFG-DHCT-V02-180101
SUNSET DATE: 1/1/2022
For example, a cooler with a door heater control would save:
ΔkW = (838.4/8766) * 0.964
= 0.0922 kW per door
Filed with the Iowa Utilities Board on September 23, 2020, EEP-2018-0002

Iowa Energy Efficiency Statewide Technical Reference Manual –3.8.3 Efficient Motors for Walk-in and Display Case
Coolers / Freezers
Vol.3 Nonresidential Measures July 22, 2020 FINAL Page 362 of 410
3.8.3 Efficient Motors for Walk-in and Display Case Coolers / Freezers
DESCRIPTION
This measure applies to the replacement of an existing permanent split capacitator (PSC) evaporator fan motor with
an electrically commutated motor (ECM) or Q-Sync motor on commercial walk-in or display case coolers or freezers.
Savings result from a reduction in electric energy use from a more efficient fan motor and from a reduced cooling
load due to less heat gain from a more efficient fan motor in the air stream.
This measure applies to the following program types: RF.
DEFINITION OF EFFICIENT EQUIPMENT
To qualify for this measure, the installed equipment must be an ECM or Q-Sync installed on a commercial walk-in or
display case cooler or freezer.
DEFINITION OF BASELINE EQUIPMENT
The baseline equipment is a standard-efficiency PSC fan motor installed on a commercial walk-in or display case
cooler or freezer.
DEEMED LIFETIME OF EFFICIENT EQUIPMENT
The expected measure life is assumed to be 15 years.
751
DEEMED MEASURE COST
Actual equipment and labor costs should be used if available. In actual costs are unknown, the full installed cost for
a brushless DC fan motor is $245 ($185 for the motor, $60 for installation labor including travel time) and $170 ($110
for the motor, $60 for installation labor including travel time) for Q-Sync.
752
LOADSHAPE
Loadshape NRE01 - Nonresidential Refrigeration – Grocery
Algorithm
CALCULATION OF SAVINGS
ELECTRIC ENERGY SAVINGS
Custom calculation below, otherwise use default savings values in table below.
Where:
W
Output
= Output wattage of installed fan motor
751
DEER 2014
752
EC Motor cost is an average of costs from Natural Resource Management ($250) and direct from the manufacturer GE
($120), consistent with the costs reported in a Northeast Energy Efficiency Partnership (NEEP) incremental cost study, Q-
SyncMotors.xlsx. Q-Sync cost also derived from the same study.
Filed with the Iowa Utilities Board on September 23, 2020, EEP-2018-0002

Iowa Energy Efficiency Statewide Technical Reference Manual –3.8.3 Efficient Motors for Walk-in and Display Case
Coolers / Freezers
Vol.3 Nonresidential Measures July 22, 2020 FINAL Page 363 of 410
= Actual; or if unknown, use 14.95 W for display cases
753
or 42 W for walk-ins
754
EFF
Base
= Efficiency of baseline motor
= Actual or if unknown, use 29%
755
EFF
EE
= Efficiency of efficient motor
= Actual or if unknown, use 66% for ECM
756
or 73.1% for Q-Sync
757
1,000 = Conversion factor from watts to kilowatts
Hours = Annual hours of cooler or freezer operation
= Assume 8,766 hours
LF = Load factor of fan motor
= Actual or if unknown, assume 0.90
758
DC = Duty cycle of fan motor
= Custom or if unknown, assume 100% for coolers and 94% for freezers
759
COP = Coefficient of performance of cooler or freezer
= Actual or if unknown, use 3.5 for coolers and 2.0 for freezers
760
Savings for all efficient motor types are presented in the table below:
Refrigeration
Type
Application
Installed
Motor Type
Savings (kWh)
Cooler
Display Case
ECM
293.1
Q-Sync
315.5
753
Weighted average of output motor wattages from invoices submitted to EnergySmart Grocer program. RTF Unit Energy
Savings (UES) Measures and Supporting Documentation: Grocery - ECMs for Display Cases v.3.1
754
The Cadmus Group, Commercial Refrigeration Loadshape Final Report, Northeast Energy Efficiency Partnerships, Regional
Evaluation, Measurement, and Verification Forum, October 2015. Walk-in motor wattage derived using motor type efficiencies
and output ratings. Calculated power consumption comparable to NEEP loadshape reported values for walk-in motors.
755
Chapter 5 of Technical Support Document in support of DOE Notice of Proposed Rulemaking for Commercial Refrigeration
Equipment, 08/28/2013
756
Chapter 5 of Technical Support Document in support of DOE Notice of Proposed Rulemaking for Commercial Refrigeration
Equipment, 08/28/2013
757
Oak Ridge National Laboratory, “Q-Sync Motors in Commercial Refrigeration: Preliminary Test Results and Projected
benefits”, 2015. Reference file “PUB58600.pdf” Table 1, page 7.
758
Public Service Commission of Wisconsin, Focus on Energy Evaluation, Business Programs Deemed Savings Manual, March 22,
2010
759
Duty cycle from Efficiency Vermont October 22, 2015 TRM: “An evaporator fan in a cooler runs all the time, but a freezer
only runs 8,273 hours per year due to defrost cycles (4 20-min defrost cycles per day).”
760
COP values from Efficiency Vermont October 22, 2015 TRM, based on the average of standard reciprocating and discus
compressor efficiencies with Saturated Suction Temperatures of -20°F (freezers) and 20°F (coolers), and a condensing
temperature of 90°F.
For example, a display cooler with an ECM motor installed in place of a PSC motor, using the defaults above,
would save:
kWh = (W
Output
/EFF
Base
– W
Output
/EFF
EE
)/1,000 × Hours × DC × LF × (1 + 1/COP)
ΔkWh
= (14.95/0.29 – 14.95/0.66)/1,000 * 8766 * 1.00 * 0.90 * (1 + 1
/3.5)
= 293.1 kWh
Filed with the Iowa Utilities Board on September 23, 2020, EEP-2018-0002

Iowa Energy Efficiency Statewide Technical Reference Manual –3.8.3 Efficient Motors for Walk-in and Display Case
Coolers / Freezers
Vol.3 Nonresidential Measures July 22, 2020 FINAL Page 364 of 410
Refrigeration
Type
Application
Installed
Motor Type
Savings (kWh)
Walk-in
ECM
823.6
Q-Sync
886.3
Freezer
Display Case
ECM
321.5
Q-Sync
346.0
Walk-in
ECM
903.2
Q-Sync
971.9
SUMMER COINCIDENT PEAK DEMAND SAVINGS
Where:
kWh = Electric energy savings, calculated above
CF = Summer peak coincidence factor
= 0.964
Other variables as defined above.
NATURAL GAS ENERGY SAVINGS
N/A
PEAK GAS SAVINGS
N/A
WATER IMPACT DESCRIPTIONS AND CALCULATION
N/A
DEEMED O&M COST ADJUSTMENT CALCULATION
N/A
MEASURE CODE: NR-RFG-ECMF-V03-190101
SUNSET DATE: 1/1/2024
For example, a display cooler with an ECM motor installed in place of a PSC motor, using the defaults above,
would save:
ΔkW = (293.1/8766) * 0.964
= 0.0322 kW
Filed with the Iowa Utilities Board on September 23, 2020, EEP-2018-0002

Iowa Energy Efficiency Statewide Technical Reference Manual –3.8.4 Night Covers for Open Refrigerated Display
Cases
Vol.3 Nonresidential Measures July 22, 2020 FINAL Page 365 of 410
3.8.4 Night Covers for Open Refrigerated Display Cases
DESCRIPTION
This measure applies to the installation of retractable covers on existing open-type refrigerated and freezer display
cases that are deployed during the facility unoccupied hours. Night covers are designed to reduce refrigeration
energy consumption by reducing the work done by the compressor. Night covers reduce the heat and moisture entry
into the refrigerated space through various heat transfer mechanisms. By fully or partially covering the case opening,
night covers reduce the convective heat transfer into the case through reduced air infiltration. Additionally, they
provide a measure of insulation, reducing conduction into the case, and also decrease radiation into the case by
blocking radiated heat from entering the refrigerated space.
This measure applies to the following program types: RF.
DEFINITION OF EFFICIENT EQUIPMENT
To qualify for this measure, the installed equipment must be retractable covers installed on existing open-type,
commercial refrigerated or freezer display cases.
DEFINITION OF BASELINE EQUIPMENT
The baseline equipment is existing open-type, commercial refrigerated or freezer display cases with no night covers
installed.
DEEMED LIFETIME OF EFFICIENT EQUIPMENT
The measure life is 5 years, based on DEER 2014.
761
DEEMED MEASURE COST
Actual equipment and labor costs should be used if available. In actual costs are unknown, assume a full installed
cost of $42 per linear foot of cover.
762
LOADSHAPE
Loadshape NRE12: Night Covers for Refrigeration Display Cases
Algorithm
CALCULATION OF ENERGY SAVINGS
ELECTRIC ENERGY SAVINGS
Where:
CaseFt = Width (ft) of the case opening protected by night cover
= Actual
761
2014 Database for Energy-Efficiency Resources (DEER), Version 2014, “Cost Values and Summary Documentation”, California
Public Utilities Commission, January, 2014.
762
2014 Database for Energy-Efficiency Resources (DEER), Version 2014, “Cost Values and Summary Documentation”, California
Public Utilities Commission, January, 2014.
Filed with the Iowa Utilities Board on September 23, 2020, EEP-2018-0002

Iowa Energy Efficiency Statewide Technical Reference Manual –3.8.4 Night Covers for Open Refrigerated Display
Cases
Vol.3 Nonresidential Measures July 22, 2020 FINAL Page 366 of 410
SavingsRate = Electric demand savings (kW/ft) from installing a night cover
= Actual; or if unknown, use savings rate from table below depending on display case
temperature:
763
Display Case
Temperature (°F)
SavingsRate (kW/ft)
Low (-35 to -5)
0.03
Medium (0 to 30)
0.02
High (35 to 55)
0.01
Hours = Number of hours per day that the night covers are in use
= Actual or if unknown, use 6 hours per day
764
Days = Number of days per year that night covers are in use
= Actual or if unknown, use 365.25 days per year
SUMMER COINCIDENT PEAK DEMAND SAVINGS
Peak savings are null because savings occur at night only.
NATURAL GAS SAVINGS
N/A
PEAK GAS SAVINGS
N/A
WATER IMPACT DESCRIPTIONS AND CALCULATION
N/A
DEEMED O&M COST ADJUSTMENT CALCULATION
N/A
MEASURE CODE: NR-RFG-NCOV-V02-180101
SUNSET DATE: 1/1/2024
763
“Effects of the Low Emissivity Shields on Performance and Power Use of a Refrigerated Display Case.” Southern California
Edison Refrigeration Technology and Test Center Energy Efficiency Division, August 8, 1997.
764
Assumed 18-hour of uncovered operation of display case, based on a typical operating scenario from "Effects of the Low
Emissivity Shields on Performance and Power Use of a Refrigerated Display Case” Southern California Edison Refrigeration
Technology and Test Center Energy Efficiency Division, August 8, 1997.
For example, a low-temperature display case with night covers installed on a 12-foot wide opening, using the
defaults above, would save:
kWh = CaseFt * SavingsRate * Hours * Days
ΔkWh
= 12 * 0.03 * 6 * 365.25
= 788.9 kWh
Filed with the Iowa Utilities Board on September 23, 2020, EEP-2018-0002

Iowa Energy Efficiency Statewide Technical Reference Manual –3.8.5 Refrigerated Beverage Vending Machine
Vol.3 Nonresidential Measures July 22, 2020 FINAL Page 367 of 410
3.8.5. Refrigerated Beverage Vending Machine
DESCRIPTION
This measure applies to new ENERGY STAR Class A, Class B, Combination A, or Combination B refrigerated vending
machines. A refrigerated beverage vending machine is a commercial refrigerator that cools bottled and/or canned
beverages and dispenses the bottled and/or canned beverages (a beverage in a sealed container) on payment.
ENERGY STAR vending machines incorporate more efficient compressors, fan motors, and lighting systems as well
as a low power mode option that allows the machine to be placed in low-energy lighting and/or low-energy
refrigeration states during times of inactivity.
This measure was developed to be applicable to the following program types: TOS.
DEFINITION OF EFFICIENT EQUIPMENT
To qualify for this measure, the installed equipment must be a new or rebuilt ENERGY STAR Class A, Class B,
Combination A, or Combination B refrigerated vending machine meeting energy consumptions requirements as
determined by equipment type.
Class A Machine: A refrigerated bottled and/or canned beverage vending machine that is not a combination vending
machine and in which 25 percent or more of the surface area on the front side of the beverage vending machine is
transparent.
Class B Machine: Any refrigerated bottled and/or canned beverage vending machine not considered to be Class A,
and is not a combination vending machine.
Combination Vending Machine: A bottled and/or canned beverage vending machine containing two or more
compartments separated by a solid partition, that may or may not share a product delivery chute, in which at least
one compartment is designed to be refrigerated, as demonstrated by the presence of temperature controls, and at
least one compartment is not.
Combination A Machine: A combination vending machine where 25 percent or more of the surface area on the front
side of the beverage vending machine is transparent.
Combination B Machine: A combination vending machine that is not considered to be Combination A.
ENERGY STAR Requirements (Version 4.0, Effective April 29, 2020)
Equipment Type
Maximum Daily Energy
Consumption (kWh/day)
Class A
≤ 0.04836V + 2.2599
Class B
≤ 0.04576V + 1.936
Combination A
≤ 0.07998V + 2.4738
Combination B
≤ 0.09768V + 1.7952
DEFINITION OF BASELINE EQUIPMENT
The baseline equipment is a new or rebuilt, Class A, Class B, Combination A, or Combination B refrigerated vending
machine that is not ENERGY STAR certified, but adheres to Federal Energy Conservation Standards.
765
DEEMED LIFETIME OF EFFICIENT EQUIPMENT
765
10 CFR §431.296 (b) - Energy Conservation Standards for Refrigerated Bottled or Canned Beverage Vending Machines.
Effective for machines manufactured on or after January 8, 2019.
Filed with the Iowa Utilities Board on September 23, 2020, EEP-2018-0002

Iowa Energy Efficiency Statewide Technical Reference Manual –3.8.5 Refrigerated Beverage Vending Machine
Vol.3 Nonresidential Measures July 22, 2020 FINAL Page 368 of 410
The expected measure life is assumed to be 10 years.
766
DEEMED MEASURE COST
The incremental cost of this measure is $199.
767
LOADSHAPE
Loadshape NRE01 - Nonresidential Refrigeration – Grocery
Algorithm
CALCULATION OF SAVINGS
ELECTRIC ENERGY SAVINGS
Custom calculation below.
Where:
kWh
Base
= Maximum daily energy consumption (kWh/day) of baseline vending machine
= Calculated as shown in the table below using the actual refrigerated volume (V)
Equipment Type
kWh
Base
768
Class A
0.052V + 2.43
Class B
0.052V + 2.20
Combination A
0.086V + 2.66
Combination B
0.111V + 2.04
kWh
ESTAR
= Maximum daily energy consumption (kWh/day) of ENERGY STAR vending machine
= Custom or if unknown, calculated as shown in the table below using the actual
refrigerated volume (V)
Equipment Type
kWh
EE
769
Class A
≤ 0.04836V + 2.2599
Class B
≤ 0.04576V + 1.936
Combination A
≤ 0.07998V + 2.4738
Combination B
≤ 0.09768V + 1.7952
V = Refrigerated volume
770
(ft
3
)
= Actual installed
766
Measure life from Final Report: Volume 2, Assessment of Energy and Capacity Savings Potential in Iowa: Appendices. The
Cadmus Group, February 28, 2012
767
Incremental cost from Focus on Energy, Business Programs Incremental Cost Study, PA Consulting Group, October 28, 2009
768
10 CFR §431.296 (b) - Energy Conservation Standards for Refrigerated Bottled or Canned Beverage Vending Machines
769
ENERGY STAR Version 4.0 requirements for maximum daily energy consumption
770
V = the refrigerated volume (ft
3
) of the refrigerated bottled or canned beverage vending machine, as specified in Appendix C
of the American National Standards Institute (ANSI)/American Society of Heating, Refrigerating and Air-Conditioning Engineers
(ASHRAE) Standard 32.1 - 2010, ‘‘Methods of Testing for Rating Vending Machines for Bottled, Canned or Other Sealed
Beverages.” For combination vending machines, the refrigerated volume does not include any non-refrigerated compartments.
Filed with the Iowa Utilities Board on September 23, 2020, EEP-2018-0002

Iowa Energy Efficiency Statewide Technical Reference Manual –3.8.5 Refrigerated Beverage Vending Machine
Vol.3 Nonresidential Measures July 22, 2020 FINAL Page 369 of 410
Days = Days of vending machine operation per year
= 365.25 days per year
SUMMER COINCIDENT PEAK DEMAND SAVINGS
Where:
kWh = Electric energy savings, calculated above
Hours = Hours of vending machine operation per year
= 8,766
771
CF = Summer peak coincidence factor
= 0.964
772
NATURAL GAS ENERGY SAVINGS
N/A
PEAK GAS SAVINGS
N/A
WATER IMPACT DESCRIPTIONS AND CALCULATION
N/A
DEEMED O&M COST ADJUSTMENT CALCULATION
N/A
MEASURE CODE: NR-RFG-ESVE-V03-210101
SUNSET DATE: 1/1/2024
771
Equipment is assumed to operate continuously, 24 hour per day, 365.25 days per year
772
Based on modeling performed by VEIC of Grocery building type. This calculation is the total savings in peak hour demand
divided by the total savings in absolute peak demand.
For example, an ENERGY STAR, Class A vending machine with a volume of 30 ft
3
would save:
ΔkWh = (kWh
Base
– kWh
ESTAR
) * Days
ΔkWh
= [(0.052 * 30 + 2.43) – (0.04836 * 30 + 2.2599)] * 365.25
= 102.0 kWh
For example, an ENERGY STAR vending machine with a volume of 30 ft
3
would save:
ΔkW = (102.0/8,766) * 0.964
= 0.011 kW
Filed with the Iowa Utilities Board on September 23, 2020, EEP-2018-0002

Iowa Energy Efficiency Statewide Technical Reference Manual –3.8.6 Refrigerator and Freezer Recycling
Vol.3 Nonresidential Measures July 22, 2020 FINAL Page 370 of 410
3.8.6. Refrigerator and Freezer Recycling
DESCRIPTION
This measure describes savings from the retirement and recycling of inefficient but operational refrigerators and
freezers. Savings are provided in two ways. First, a regression equation is provided that requires the use of key inputs
describing the retired unit (or population of units) and is based on a 2013 workpaper provided by Cadmus that used
data from a 2012 ComEd metering study and metering data from a Michigan study. The second methodology is a
deemed approach based on an evaluation of 2016 Ameren Illinois Company Appliance Recycling Program.. Note
that since both methods are based on residential units, this program is limited to residential-sized units in
commercial settings. Furthermore, it is assumed that these retired units are not “secondary” units, but that the
program is encouraging the early removal of inefficient units that are ultimately replaced.
The savings are equivalent to the Unit Energy Consumption of the retired unit minus an assumed baseline
replacement unit (any additional savings attributed to purchasing a new high efficiency unit would be claimed
through the Time of Sale measure) and should be claimed for the assumed remaining useful life of that unit. The
user should note that the regression algorithm is designed to provide an accurate portrayal of savings for the
population as a whole and includes those parameters that have a significant effect on the consumption. The
precision of savings for individual units will vary. This measure also includes a section accounting for the interactive
effect of reduced waste heat on the heating and cooling loads.
This measure was developed to be applicable to the following program types: ERET.
DEFINITION OF EFFICIENT EQUIPMENT
The existing inefficient refrigerator is removed from service and replaced.
DEFINITION OF BASELINE EQUIPMENT
The existing inefficient unit must be operational and have a capacity of between 10 and 30 cubic feet.
DEEMED LIFETIME OF EFFICIENT EQUIPMENT
The estimated remaining useful life of the recycling units is 6.5 years.
773
DEEMED MEASURE COST
Measure cost includes the cost of pickup and recycling of the refrigerator and should be based on actual costs of
running the program. If unknown, assume $120 per unit.
774
LOADSHAPE
Loadshape RE09 - Residential Refrigerator
Loadshape RE02 – Residential Freezer
773
DOE refrigerator and freezer survival curves are used to calculate RUL for each equipment age and develop a RUL schedule.
The RUL of each unit in the ARCA database is calculated and the average RUL of the dataset serves as the final measure RUL.
Refrigerator recycling data from ComEd (PY7-PY9) and Ameren (PY6-PY8) were used to determined EUL with the DOE survival
curves from the 2009 TSD. A weighted average of the retailer ComEd data and the Ameren data results in an average of 6.5
years. See Navigant ‘ComEd Effective Useful Life Research Report’, May 2018.
774
Based on similar Efficiency Vermont program.
Filed with the Iowa Utilities Board on September 23, 2020, EEP-2018-0002

Iowa Energy Efficiency Statewide Technical Reference Manual –3.8.6 Refrigerator and Freezer Recycling
Vol.3 Nonresidential Measures July 22, 2020 FINAL Page 371 of 410
Algorithm
CALCULATION OF SAVINGS
ENERGY SAVINGS
Regression analysis: Refrigerators
Energy savings for refrigerators are based upon a linear regression model using the following coefficients:
775
Independent Variable Description
Estimate Coefficient
Intercept
83.324
Age (years)
3.678
Pre-1990 (=1 if manufactured pre-1990)
485.037
Size (cubic feet)
27.149
Dummy: Side-by-Side (= 1 if side-by-side)
406.779
Dummy: Primary Usage Type (in absence of the program)
(= 1 if primary unit)
161.857
Interaction: Located in Unconditioned Space x CDD/365.25
15.366
Interaction: Located in Unconditioned Space x HDD/365.25
-11.067
Where:
Age = Age of retired unit
Pre-1990 = Pre-1990 dummy (=1 if manufactured pre-1990, else 0)
Size = Capacity (cubic feet) of retired unit
Side-by-side = Side-by-side dummy (= 1 if side-by-side, else 0)
Primary Usage = Primary Usage Type (in absence of the program) dummy
(= 1 if Primary, else 0)
CDD = Cooling Degree Days
= Dependent on location:
776
Climate Zone
(City based upon)
CDD 65
CDD/365.25
5 (Burlington)
1209
3.31
6 (Mason City)
616
1.69
775
Coefficients provided in July 30, 2014 memo from Cadmus: “Appliance Recycling Update no single door July 30 2014”. Based
on the specified regression, a small number of units may have negative energy and demand consumption. These are a function
of the unit size and age, and should comprise a very small fraction of the population. While on an individual basis this result is
counterintuitive, it is important that these negative results remain such that as a population the average savings is appropriate.
776
National Climatic Data Center, calculated from 1981-2010 climate normals with a base temp of 65°F.
Filed with the Iowa Utilities Board on September 23, 2020, EEP-2018-0002

Iowa Energy Efficiency Statewide Technical Reference Manual –3.8.6 Refrigerator and Freezer Recycling
Vol.3 Nonresidential Measures July 22, 2020 FINAL Page 372 of 410
Climate Zone
(City based upon)
CDD 65
CDD/365.25
Average/unknown
1,068
2.92
Unconditioned = If unit in unconditioned space = 1, otherwise 0
HDD = Heating Degree Days
= Dependent on location:
777
Climate Zone
(City based upon)
HDD 60
HDD/365.25
5 (Burlington)
4,496
12.31
6 (Mason City)
6,391
17.50
Average/unknown
5,052
13.83
UEC
BaseRefrig
= Assumed consumption of a new baseline residential-sized refrigerator
= 592 kWh
778
Deemed approach: Refrigerators
Where:
UEC
Retired
= Unit Energy Consumption of retired unit
= 1032 kWh
779
ΔkWh
Unit
= 1032 – 592
= 440 kWh
Regression analysis: Freezers
Energy savings for freezers are based upon a linear regression model using the following coefficients:
780
Independent Variable Description
Estimate Coefficient
Intercept
132.122
Age (years)
12.130
Pre-1990 (=1 if manufactured pre-1990)
156.181
Size (cubic feet)
31.839
Chest Freezer Configuration (=1 if chest freezer)
-19.709
Interaction: Located in Unconditioned Space x CDD/365.25
9.778
Interaction: Located in Unconditioned Space x HDD/365.25
-12.755
777
National Climatic Data Center, calculated from 1981-2010 climate normals with a base temp of 60°F.
778
Consistent with Residential Refrigerator measure (based on applying the Federal Standard algorithms for the common
configuration types and applying market weighting). Note that the baseline is used here as any additional delta between
baseline and high efficient units will be captured through the Time of Sale measure.
779
Table 11. PY9 Mean Explanatory Variables, Impact and Process Evaluation of 2016 (PY9) Ameren Illinois Company Appliance
Recycling Program, Opinion Dynamics, October 13, 2017.
780
Coefficients provided in January 31, 2013 memo from Cadmus: “Appliance Recycling Update”. Based on the specified
regression, a small number of units may have negative energy and demand consumption. These are a function of the unit size
and age, and should comprise a very small fraction of the population. While on an individual basis this result is counterintuitive
it is important that these negative results remain such that as a population the average savings is appropriate.
Filed with the Iowa Utilities Board on September 23, 2020, EEP-2018-0002

Iowa Energy Efficiency Statewide Technical Reference Manual –3.8.6 Refrigerator and Freezer Recycling
Vol.3 Nonresidential Measures July 22, 2020 FINAL Page 373 of 410
Where:
Age = Age of retired unit
Pre-1990 = Pre-1990 dummy (=1 if manufactured pre-1990, else 0)
Size = Capacity (cubic feet) of retired unit
Chest Freezer = Chest Freezer dummy (= 1 if chest freezer, else 0)
CDD = Cooling Degree Days (see table in refrigerator section)
Unconditioned = If unit in unconditioned space = 1, otherwise 0
HDD = Heating Degree Days (see table in refrigerator section)
UEC
BaseFreezer
= Assumed consumption of a new baseline residential sized freezer
= 381 kWh
781
Deemed approach: Freezers
Where:
UEC
Retired
= Unit Energy Consumption of retired unit
= 944 kWh
782
ΔkWh
Unit
= 944 - 381
= 563 kWh
Additional Waste Heat Impacts
783
Only for retired units from conditioned spaces in the building (if unknown, assume unit is from conditioned space).
Where:
∆kWh
Unit
= kWh savings calculated from either method above
WHFeHeatElectric = Waste Heat Factor for Energy to account for electric heating increase from removing
waste heat from refrigerator/freezer (if fossil fuel heating – see calculation of heating
penalty in that section).
= - (HF / ηHeat
Electric
) * %ElecHeat
HF = Heating Factor or percentage of reduced waste heat that must now be heated
781
Consistent with Residential Freezer measure (based on applying the Federal Standard algorithms for the common
configuration types and applying market weighting). Note that the baseline is used here as any additional delta between
baseline and high efficient units will be captured through the Time of Sale measure.
782
Table 11. PY9 Mean Explanatory Variables, Impact and Process Evaluation of 2016 (PY9) Ameren Illinois Company Appliance
Recycling Program, Opinion Dynamics, October 13, 2017.
783
The waste heat impacts are relatively small, and with the absence of any clear data on the types of buildings these non-
residential units are being removed from, residential assumptions are provided as a reasonable proxy.
Filed with the Iowa Utilities Board on September 23, 2020, EEP-2018-0002

Iowa Energy Efficiency Statewide Technical Reference Manual –3.8.6 Refrigerator and Freezer Recycling
Vol.3 Nonresidential Measures July 22, 2020 FINAL Page 374 of 410
= 54% for unit in heated space
784
= 0% for unit in heated space
ηHeat
Electric
= Efficiency in COP of Heating equipment
= Actual - If not available, use:
785
System Type
Age of Equipment
HSPF Estimate
ηHeat (COP Estimate)
Heat Pump
Before 2006
6.8
2.00
2006-2014
7.7
2.26
2015 on
8.2
2.40
Resistance
N/A
N/A
1.00
Unknown
N/A
N/A
1.38
786
%ElecHeat = Percentage of businesses with electric heat
Heating fuel
%ElecHeat
Electric
100%
Fossil Fuel
0%
Unknown
30%
787
WHFeCool = Waste Heat Factor for Energy to account for cooling savings from removing waste heat
from refrigerator/freezer.
= (CoolF / ηCool) * %Cool
CoolF = Cooling Factor or percentage of reduced waste heat that no longer needs to be
cooled
= 34% for unit in cooled space
788
= 0% for unit in uncooled space
ηCool = Efficiency in COP of Cooling equipment
= Actual - If not available, assume 2.8 COP
789
%Cool = Percentage of businesses with cooling
AC use
%Cool
Cooling
100%
No Cooling
0%
784
Based on 197 days where HDD 55>0, divided by 365.25.
785
These default system efficiencies are based on the applicable minimum Federal Standards. In 2006 and 2015 the Federal
Standard for Heat Pumps was adjusted. While one would expect the average system efficiency to be higher than this minimum,
the likely degradation of efficiencies over time mean that using the minimum standard is appropriate.
786
Calculation assumes 33% Heat Pump and 67% Resistance, which is based upon data from Energy Information Administration,
2009 Residential Energy Consumption Survey, see “HC6.9 Space Heating in Midwest Region.xls”. Average efficiency of heat
pump is based on the assumption that 50% are units from before 2006 and 50% 2006-2014. Heating assumptions for small
commercial buildings are expected to be similar to assumptions for residential buildings.
787
Based on data for the Midwest, West North Central census division from Energy Information Administration, 2012
Commercial Buildings Energy Consumption Survey, Table B28 (Primary Space-Heating Energy Sources, Number of Buildings).
788
Based on 123 days where CDD 65>0, divided by 365.25.
789
Starting from standard assumption of SEER 10.5 central AC unit, converted to 9.5 EER using algorithm (-0.02 * SEER
2
) + (1.12
* SEER) (from Wassmer, M. (2003); A Component-Based Model for Residential Air Conditioner and Heat Pump Energy
Calculations. Masters Thesis, University of Colorado at Boulder), converted to COP = EER/3.412 = 2.8COP).
Filed with the Iowa Utilities Board on September 23, 2020, EEP-2018-0002

Iowa Energy Efficiency Statewide Technical Reference Manual –3.8.6 Refrigerator and Freezer Recycling
Vol.3 Nonresidential Measures July 22, 2020 FINAL Page 375 of 410
AC use
%Cool
Unknown
74%
790
SUMMER COINCIDENT PEAK DEMAND SAVINGS
Where:
∆kWhUnit = Savings provided in algorithm above (not including ∆kWh
wasteheat
)
HOURS = Equivalent Full Load Hours as calculated using eShapes loadprofile
Refrigerators = 5280
Freezers = 5895
WHFdCool = Waste heat factor for demand to account for cooling savings from removing waste
heat:
791
Refrigerator Location
WHFdCool
Cooled space
1.29
792
Uncooled or unknown space
1.0
Unknown space
1.21
CF = Coincident factor as calculated using eShapes loadprofile
Refrigerators = 70.9%
Freezers = 95.3%
Deemed approach: Refrigerators
ΔkW = 440/5280 * 1.21 * 0.709
= 0.0715 kW
Deemed approach: Freezers
ΔkW = 563/5895 * 1.21* 0.953
= 0.1101 kW
NATURAL GAS SAVINGS
Heating penalty for reduction in waste heat, only for retired units from conditioned space in gas heated businesses
(if unknown, assume unit is from conditioned space).
793
Where:
790
Based on data for the Midwest, West North Central census division from Energy Information Administration, 2012
Commercial Buildings Energy Consumption Survey, Table B30 (Cooling Energy Sources, Number of Buildings and Floorspace.
791
The waste heat impacts are relatively small, and with the absence of any clear data on the types of buildings these non-
residential units are being removed from – the Residential assumptions are provided as a reasonable proxy.
792
The value is estimated at 1.29 (calculated as 1 + (0.798 / 2.8)). See footnote relating to WHFe for details. Note the 79.8%
factor represents the non-residential average cooling coincidence factor.
793
The waste heat impacts are relatively small, and with the absence of any clear data on the types of buildings these non-
residential units are being removed from – the Residential assumptions are provided as a reasonable proxy.
Filed with the Iowa Utilities Board on September 23, 2020, EEP-2018-0002

Iowa Energy Efficiency Statewide Technical Reference Manual –3.8.6 Refrigerator and Freezer Recycling
Vol.3 Nonresidential Measures July 22, 2020 FINAL Page 376 of 410
∆kWh
Unit
= kWh savings calculated from either method above, not including the ∆kWh
WasteHeat
WHFeHeatGas = Waste Heat Factor for Energy to account for gas heating increase from removing waste
heat from refrigerator/freezer
= - (HF / ηHeat
Gas
) * %GasHeat
If unknown, assume 0
HF = Heating Factor or percentage of reduced waste heat that must now be heated
= 54% for unit in heated space
794
= 0% for unit in heated space
ηHeat
Gas
= Efficiency of heating system
=74%
795
%GasHeat = Percentage of businesses with gas heat
Heating fuel
%GasHeat
Electric
0%
Gas
100%
Unknown
70%
796
0.03412 = Converts kWh to Therms
PEAK GAS SAVINGS
Heating penalty for reduction in waste heat, only for retired units from conditioned space in gas heated businesses
For ease of application, savings for this measure is assumed to be evenly spread across the year. The Peak Gas Savings
is therefore assumed to be:
Where:
ΔTherms = Therm impact calculated above
HeatDays = Heat season days per year
= 197
797
794
Based on 197 days where HDD 55>0, divided by 365.25.
795
This has been estimated assuming that natural gas central furnace heating is typical for Iowa residences (the predominant
heating is gas furnace with 49% of Iowa homes - based on Energy Information Administration, 2009 Residential Energy
Consumption Survey). In 2000, 60% of furnaces purchased in Iowa were condensing (based on data from GAMA, provided to
Department of Energy during the federal standard setting process for residential heating equipment - see Furnace
Penetration.xls). Furnaces tend to last up to 20 years and so units purchased 15 years ago provide a reasonable proxy for the
current mix of furnaces in the State. Assuming typical efficiencies for condensing and non-condensing furnaces and duct losses,
the average heating system efficiency is estimated as follows: ((0.60*0.92) + (0.40*0.8)) * (1-0.15) = 0.74. Heating
assumptions for small commercial buildings are expected to be similar to assumptions for residential buildings.
796
Based on data for the Midwest, West North Central census division from Energy Information Administration, 2012
Commercial Buildings Energy Consumption Survey, Table B28 (Primary Space-Heating Energy Sources, Number of Buildings.
797
Number of days where HDD 55 >0.
Filed with the Iowa Utilities Board on September 23, 2020, EEP-2018-0002

Iowa Energy Efficiency Statewide Technical Reference Manual –3.8.6 Refrigerator and Freezer Recycling
Vol.3 Nonresidential Measures July 22, 2020 FINAL Page 377 of 410
WATER IMPACT DESCRIPTIONS AND CALCULATION
N/A
DEEMED O&M COST ADJUSTMENT CALCULATION
N/A
MEASURE CODE: NR-REF-RFRC-V02-200101
SUNSET DATE: 1/1/2022
Filed with the Iowa Utilities Board on September 23, 2020, EEP-2018-0002

Iowa Energy Efficiency Statewide Technical Reference Manual –3.8.7 Scroll Refrigeration Compressor
Vol.3 Nonresidential Measures July 22, 2020 FINAL Page 378 of 410
3.8.7. Scroll Refrigeration Compressor
DESCRIPTION
This measure applies to scroll refrigerant compressors utilized in commercial refrigeration including supermarkets,
foodservices and convenience store applications.
798
Super market refrigeration systems typically operate at two
temperatures, medium and low. Medium temperatures are typically used for walk-in coolers where as low-
temperature cases are used for walk-in freezers.
Scroll compressors have fewer moving parts than reciprocating compressors and as such operate more smoothly,
quietly, and continuously.
799
In addition the scroll compressor design allows them to be nearly 100% volumetrically
efficient in pumping the trapped fluid.
This measure applies to one-for-one replacement of 1.0-10 horsepower refrigeration compressors and was
developed to be applicable to retrofit (RF) opportunities only where an existing reciprocating compressor is being
replaced with an equivalent efficient refrigeration scroll compressor.
DEFINITION OF EFFICIENT EQUIPMENT
In order for this characterization to apply, the efficient system is assumed to be a scroll refrigeration compressor
replacing a reciprocating compressor.
800
DEFINITION OF BASELINE EQUIPMENT
The baseline equipment is assumed to be the existing reciprocating compressor.
DEEMED LIFETIME OF EFFICIENT EQUIPMENT
The expected measure life for scroll compressors is 12 years.
801
DEEMED MEASURE COST
As a retrofit measure, when available, the actual cost of the measure installation and equipment shall be used. For
a default range, see the incremental capital cost listed in the reference table.
LOADSHAPE
Loadshape NRE01 - Non-Residential Refrigeration – Grocery
798
Scroll compressors using R22 refrigerant are not eligible for this measure. In 2012 the U.S. government enacted a policy
requiring all air conditioners and heat pumps no longer use the ozone-depleting R22 refrigerant (AC Freon). See ozone layer
protection regulatory programs under www.epa.gov for more information.
799
Reciprocating compressors have multiple cylinders while scroll compressors only have one compression element made up of
two identical, concentric scrolls, one inserted within the other. One scroll remains stationary as the other orbits around it. This
movement draws gas into the compression chamber and moves it through successively smaller pockets formed by the scroll’s
rotation, until it reaches maximum pressure at the center of the chamber. At this point, the required discharge pressure has been
achieved. There, it is released through a discharge port in the fixed scroll. During each orbit, several pockets are compressed
simultaneously, making the operation continuous – this factor also reduces pulsation levels – lower sound, vibration of attached
piping.
800
Following the expansion of highly efficient motors rules effective March 2015, the US DOE Code of Federal Regulations also
regulates and has appliance/code standards for the efficiency level of pumps, fans and compressors in order to improve overall
system efficiency. The final ruling for compressors and walk-in coolers/freezers refrigeration systems was made effective in
September 2017 with compliance required on July 10, 2020.
801
2014 Database for Energy-Efficiency Resources (DEER), Version 2014.2.5, “Effective/Remaining Useful Life Values”, California
Public Utilities Commission. See “DEER2014-EUL-table-update_2014-02-05.xlsx”
Filed with the Iowa Utilities Board on September 23, 2020, EEP-2018-0002

Iowa Energy Efficiency Statewide Technical Reference Manual –3.8.7 Scroll Refrigeration Compressor
Vol.3 Nonresidential Measures July 22, 2020 FINAL Page 379 of 410
Algorithm
CALCULATION OF SAVINGS
ELECTRIC ENERGY SAVINGS
Where:
Avg Cap = compressor capacity in Btu/h. See reference table for values. For prescriptive measures
the average capacity for each range of size is used.
802
EER
Base
= Cooling efficiency of existing compressor in Btu/watt-hour. See reference tables for
values.
EER
ee
= Cooling efficiency of efficient scroll compressor in Btu/watt-hour. See reference tables
for values
FLH = Full load hours. The refrigeration is assumed to be in operation every day of the year,
but because of compressor cycling the full load hours are as follows for the different
refrigeration temperature applications.
803
Refrigeration Application
Full Load Hours
Medium Temperature
3,910
Low Temperature
4,139
Units = Number of units
= Actual number of units installed
SUMMER COINCIDENT PEAK DEMAND SAVINGS
Where:
kW = gross customer connected load kW savings for the measure (kW)
FLH = Full load hours. The refrigeration is assumed to be in operation every day of the year,
but because of compressor cycling the full load hours are 3910 hours for medium
temperature applications and 4139 hours for low temperature applications.
804
CF
= System Peak Coincidence Factor. Assume non-residential average of 96.4%
NATURAL GAS ENERGY SAVINGS
N/A
802
Given this measure characterizes 1.5-10 HP the BTU/hr range is calculated as 1 Btu/Hr to Horsepower = 0.0004. This
presenting a valid range of 1- 25199 BTU/hr for Avg. Cap.
803
Based on run time estimates from “Performance Standards for Walk-In Refrigerator and Freezer Systems,” AHRTI Report No.
09002-01, by Bryan R. Becker, et al., January 2012, Tables 30-33
804
Based on run time estimates from “Performance Standards for Walk-In Refrigerator and Freezer Systems,” AHRTI Report No.
09002-01, by Bryan R. Becker, et al., January 2012, Tables 30-33
Filed with the Iowa Utilities Board on September 23, 2020, EEP-2018-0002
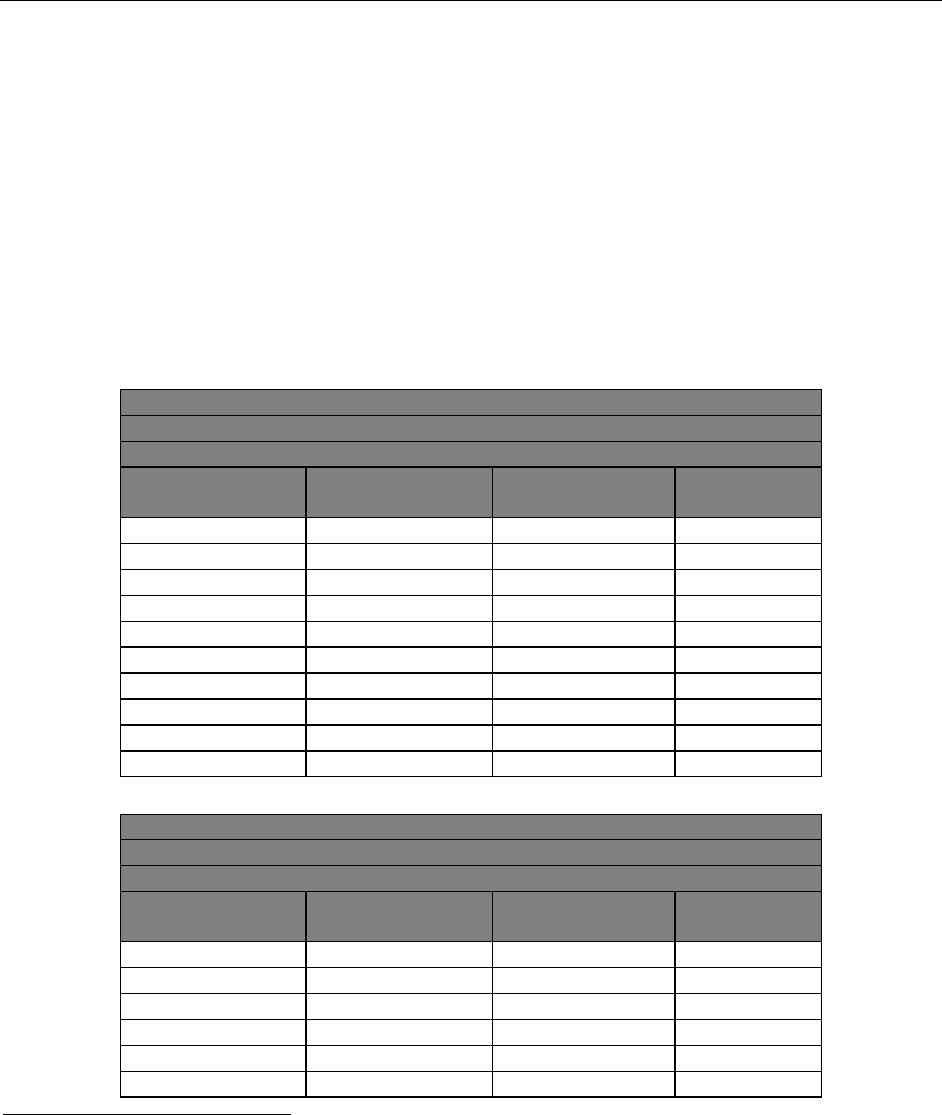
Iowa Energy Efficiency Statewide Technical Reference Manual –3.8.7 Scroll Refrigeration Compressor
Vol.3 Nonresidential Measures July 22, 2020 FINAL Page 380 of 410
PEAK GAS SAVINGS
N/A
WATER IMPACT DESCRIPTIONS AND CALCULATION
N/A
DEEMED O&M COST ADJUSTMENT CALCULATION
N/A
REFERENCE TABLES
805
Baseline and Qualifying EER Values by Capacity, and Temperature Application
806
Low Temperature
Baseline and Qualifying EER
Condensing temp 90°F, Evap Temp -25°F
Capacity Bins in
BTU/Hr
HP equivalent
807
Average EERbase
Average EERee
0-4200
1
3.85
4.39
4200-8399
2
4.83
5.21
8400-12599
3
5.06
5.37
12600-16799
4
5.26
5.59
16800-20999
5
5.36
5.80
21000-25199
6
5.69
6.06
25200-29399
7
5.71
6.15
29400-33599
8
6.14
6.39
33600-37800
9
5.64
6.06
37800-42000
10
5.73
6.06
Medium Temperature
Baseline and Qualifying EER
Condensing temp 90°F, Evap Temp 20°F
Capacity Bins in
BTU/Hr
HP equivalent
Average EERbase
Average EERee
0-7500
1
8.14
9.03
7500-14999
2
9.28
10.86
15000-22499
3
10.64
11.83
22500-29999
4
11.18
12.15
30000-37499
5
11.12
12.39
37500-44999
6
11.74
12.70
805
Baseline EERs and Qualifying EERs calculations come from available modeling and installation data provided by Efficiency
Vermont referred in the 2014 TRM and supported by referenced document “TRM compressor efficiency analysis.xlsx” for
averaging of data for IA TRM.
806
Supermarket refrigeration systems typically operate at two evaporator temperatures, medium temperature and low
temperature. Medium temperature cases vary from 10˚F to 35˚F with a typical mean evaporating temperature of 20˚F. Medium
temperature cases are typically used for meats, dairy, beverages and walk-in coolers. Low-temperature cases vary from -15˚F to
- 25˚F and are used for frozen foods, ice cream, and walk-in freezers. A typical mean low temperature evaporating temperature
is -25˚F.
807
At low temperatures the standard calculation for Compressor HP vs. Btu/Hr is 4226 Btu/hr per HP. Round numbers to 4200
for ease of binning.
Filed with the Iowa Utilities Board on September 23, 2020, EEP-2018-0002

Iowa Energy Efficiency Statewide Technical Reference Manual –3.8.7 Scroll Refrigeration Compressor
Vol.3 Nonresidential Measures July 22, 2020 FINAL Page 381 of 410
Medium Temperature
Baseline and Qualifying EER
Condensing temp 90°F, Evap Temp 20°F
Capacity Bins in
BTU/Hr
HP equivalent
Average EERbase
Average EERee
45000-52499
7
11.68
12.52
52500-59999
8
12.54
13.12
60000-67499
9
12.46
13.13
67500-75000
10
11.44
12.37
MEASURE CODE: MEASURE CODE: NR-RFG-SCR-V02-190101
SUNSET DATE: 1/1/2023
Filed with the Iowa Utilities Board on September 23, 2020, EEP-2018-0002

Iowa Energy Efficiency Statewide Technical Reference Manual –3.8.8 Strip Curtain for Walk-in Coolers and Freezers
Vol.3 Nonresidential Measures July 22, 2020 FINAL Page 382 of 410
3.8.8. Strip Curtain for Walk-in Coolers and Freezers
DESCRIPTION
This measure applies to the installation of infiltration barriers (strip curtains) on walk-in coolers or freezers. Strip
curtains impede heat transfer from adjacent warm and humid spaces into walk-ins when the main door is opened,
thereby reducing the cooling load. As a result, compressor run time and energy consumption are reduced.
This measure was developed to be applicable to the following program types: RF.
DEFINITION OF EFFICIENT EQUIPMENT
To qualify for this measure, the installed equipment must be a strip curtain added to a walk-in cooler or freezer.
DEFINITION OF BASELINE EQUIPMENT
The baseline equipment is a walk-in cooler or freezer that previously had no strip curtain installed.
DEEMED LIFETIME OF EFFICIENT EQUIPMENT
The expected measure life is 4 years.
808
DEEMED MEASURE COST
Actual equipment and labor costs should be used if available. In actual costs are unknown, assume a full installed
cost of $10.22 per square foot.
809
LOADSHAPE
Loadshape NRE01 - Nonresidential Refrigeration – Grocery
Algorithm
CALCULATION OF SAVINGS
ELECTRIC ENERGY SAVINGS
Custom calculation below,
810
otherwise use deemed values within the table that follows:
Where:
Q
Base
= Total infiltration load (Btu/hr) of cooler or freezer with no strip curtain installed
= Use value from table below as determined by building type
Q
EE
= Total infiltration load (Btu/hr) of cooler or freezer with strip curtain installed
= 561 Btu/hr for coolers and 898 Btu/hr for freezers
808
DEER 2014 Effective Useful Life
809
2008 Database for Energy-Efficiency Resources (DEER), Version 2008.2.05, “Cost Values and Summary Documentation”,
California Public Utilities Commission, December 16, 2008.
810
Algorithms and assumptions from Regional Technical Forum (RTF) Unit Energy Savings (UES) Measures and Supporting
Documentation: Grocery – Strip Curtains v.1.4
Filed with the Iowa Utilities Board on September 23, 2020, EEP-2018-0002

Iowa Energy Efficiency Statewide Technical Reference Manual –3.8.8 Strip Curtain for Walk-in Coolers and Freezers
Vol.3 Nonresidential Measures July 22, 2020 FINAL Page 383 of 410
Grocery Store
Restaurant
Convenience Store
Unknown Building
Type
Cooler
Freezer
Cooler
Freezer
Cooler
Freezer
Cooler
Freezer
Q
Base
4,661
7,464
1,054
2,136
895
485
2,012
3,128
Q
EE
559
896
211
406
188
82
355
500
EER
= Energy efficiency ratio of cooler or freezer
= Custom or if unknown, use value from table below as determined by building type
Grocery Store
Restaurant or
Convenience Store
Unknown Building
Type
Cooler
Freezer
Cooler
Freezer
Cooler
Freezer
EER
10.6
4.1
9.8
4.0
10.2
4.0
1,000 = Conversion factor from watts to kilowatts
EFLH = Equivalent full load hours of cooler or freezer
= Custom or if unknown, use 7,693 for coolers and 8,121 for freezers
A = Area (ft
2
) of cooler or freezer covered by strip curtains
= Custom or if unknown, assume 21 ft
2
Savings for grocery stores, restaurants, convenient stores, and unknown building types are presented in the table
below.
811
Grocery Store
Restaurant
Convenience Store
Unknown Building Type
(kWh/ft
2
)
(kWh/
Case)
(kWh/ft
2
)
(kWh/
Case)
(kWh/ft
2
)
(kWh/
Case)
(kWh/ft
2
)
(kWh/
Case)
Cooler
142.3
2,988.1
31.4
659.9
26.3
553.2
59.5
1,249.7
Freezer
619.3
13,005.4
168.1
3,529.1
39.1
820.9
251.4
5,278.9
SUMMER COINCIDENT PEAK DEMAND SAVINGS
Where:
kWh = Electric energy savings, calculated above
CF = Summer peak coincidence factor
= 0.964
811
Savings for unknown building types represent the average of grocery store, restaurant, and convenience store savings.
For example, a cooler with strip curtains installed at a grocery store, using the defaults from above, would save:
kWh = ((Q
Base
/EER × 1000) - (Q
EE
/EER × 1000)) × EFLH/A × A
ΔkWh
= ((4,661/10.6 × 1000) - (559/10.6 × 1000)) × 7,693/21 × 21
= 2,977.0 kWh
Filed with the Iowa Utilities Board on September 23, 2020, EEP-2018-0002

Iowa Energy Efficiency Statewide Technical Reference Manual –3.8.8 Strip Curtain for Walk-in Coolers and Freezers
Vol.3 Nonresidential Measures July 22, 2020 FINAL Page 384 of 410
Other variables as defined above.
NATURAL GAS ENERGY SAVINGS
N/A
PEAK GAS SAVINGS
N/A
WATER IMPACT DESCRIPTIONS AND CALCULATION
N/A
DEEMED O&M COST ADJUSTMENT CALCULATION
N/A
MEASURE CODE: NR-RFG-STCR-V03-190101
SUNSET DATE: 1/1/2021*
* This measure is overdue for a reliability review due to no utility currently offering the measure. If a utility plans to
start using this measure again, it should be reviewed accordingly.
For example, a cooler with strip curtains installed at a restaurant, using the defaults above, would save:
ΔkW = (2,977.0/7,693) * 0.964
= 0.3730 kW
Filed with the Iowa Utilities Board on September 23, 2020, EEP-2018-0002

Iowa Energy Efficiency Statewide Technical Reference Manual –3.8.9 Ice Maker
Vol.3 Nonresidential Measures July 22, 2020 FINAL Page 385 of 410
3.8.9. Ice Maker
DESCRIPTION
This measure relates to the installation of a new ENERGY STAR certified commercial ice maker. The ENERGY STAR
label applies to air-cooled, batch-type and continuous-type machines including ice-making head (IMH), remote-
condensing units (RCU), and self-contained units (SCU). ENERGY STAR ice makers are approximately 15% more
efficient than standard ice makers.
This measure was developed to be applicable to the following program types: TOS.
DEFINITION OF EFFICIENT EQUIPMENT
To qualify for this measure, the efficient equipment must be an ENERGY STAR certified commercial ice maker
meeting energy consumption rate and potable water use limits, as determined by equipment type and for batch-
type ice makers, ice harvest rate range.
812
ENERGY STAR Requirements (Version 3.0, Effective January 28, 2018)
ENERGY STAR Requirements for Air-Cooled Batch-Type Ice Makers
Equipment Type
Applicable Ice Harvest
Rate Range (lbs of ice/24
hrs)
ENERGY STAR Energy
Consumption Rate (kWh/100
lbs ice)
Potable Water Use
(gal/100 lbs ice)
IMH
H < 300
≤ 9.20 - 0.01134H
≤ 20.0
300 ≤ H < 800
≤ 6.49 - 0.0023H
800 ≤ H < 1500
≤ 5.11 - 0.00058H
1500 ≤ H ≤ 4000
≤ 4.24
RCU
H < 988
≤ 7.17 – 0.00308H
≤ 20.0
988 ≤ H ≤ 4000
≤ 4.13
SCU
H < 110
≤ 12.57 - 0.0399H
≤ 25.0
110 ≤ H < 200
≤ 10.56 - 0.0215H
200 ≤ H ≤ 4000
≤ 6.25
ENERGY STAR Requirements for Air-Cooled Continuous-Type Ice Makers
Equipment Type
Applicable Ice Harvest
Rate Range (lbs of
ice/24 hrs)
ENERGY STAR Energy
Consumption Rate (kWh/100
lbs ice)
Potable Water Use
(gal/100 lbs ice)
IMH
H < 310
≤ 7.90 – 0.005409H
≤ 15.0
310 ≤ H < 820
≤ 7.08 – 0.002752H
820 ≤ H ≤ 4000
≤ 4.82
RCU
H < 800
≤ 7.76 – 0.00464H
≤ 15.0
800 ≤ H ≤ 4000
≤ 4.05
SCU
H < 200
≤ 12.37 – 0.0261H
≤ 15.0
200 ≤ H < 700
≤ 8.24 – 0.005429H
700 ≤ H ≤ 4000
≤ 4.44
DEFINITION OF BASELINE EQUIPMENT
The baseline equipment is a new commercial ice maker that is not ENERGY STAR certified.
DEEMED LIFETIME OF EFFICIENT EQUIPMENT
812
https://www.energystar.gov/sites/default/files/Final%20V3.0%20ACIM%20Specification%205-17-17_1_0.pdf
Filed with the Iowa Utilities Board on September 23, 2020, EEP-2018-0002

Iowa Energy Efficiency Statewide Technical Reference Manual –3.8.9 Ice Maker
Vol.3 Nonresidential Measures July 22, 2020 FINAL Page 386 of 410
The expected measure life is assumed to be 8 years.
813
DEEMED MEASURE COST
When available, the actual cost of the measure installation and equipment shall be used. The incremental capital
cost for this measure is $0 for Batch-Type and $222 for Continuous-Type ice makers.
814
LOADSHAPE
Loadshape NRE01 - Nonresidential Electric Refrigeration – Restaurant
Algorithm
CALCULATION OF SAVINGS
ELECTRIC ENERGY SAVINGS
Custom calculation below, otherwise use deemed values from the table that follows.
815
Where:
kWh
Base
= Energy consumption rate (kWh / 100 pounds of ice) of baseline ice maker
= Calculated as shown in the table below using the ice harvest rate (H)
kWh
ESTAR
= Energy consumption rate (kWh / 100 pounds of ice) of ENERGY STAR ice maker
= Calculated as shown in the table below using the ice harvest rate (H)
813
Measure life from ENERGY STAR Commercial Kitchen Equipment Savings Calculator
http://www.energystar.gov/buildings/sites/default/uploads/files/commercial_kitchen_equipment_calculator.xlsx
814
Incremental costs from ENERGY STAR Commercial Kitchen Equipment Savings Calculator. Calculator cites EPA research using
AutoQuotes, 2016.
815
Algorithms and assumptions derived from ENERGY STAR Commercial Kitchen Equipment Savings Calculator
Filed with the Iowa Utilities Board on September 23, 2020, EEP-2018-0002

Iowa Energy Efficiency Statewide Technical Reference Manual –3.8.9 Ice Maker
Vol.3 Nonresidential Measures July 22, 2020 FINAL Page 387 of 410
Energy Consumption of Air-Cooled Batch-Type Ice Makers
Ice Maker
Type
Applicable Ice Harvest Rate Range
(lbs of ice/24 hrs)
kWh
Base
kWh
ESTAR
IMH
H < 300
10-0.01233H
≤ 9.20 - 0.01134H
300 ≤ H < 800
7.05-0.0025H
≤ 6.49 - 0.0023H
800 ≤ H < 1500
5.55-0.00063H
≤ 5.11 - 0.00058H
1500 ≤ H ≤ 4000
4.61
≤ 4.24
RCU
H < 988
7.97-0.00342H
≤ 7.17 – 0.00308H
988 ≤ H ≤ 4000
4.59
≤ 4.13
SCU
H < 110
14.79-0.0469H
≤ 12.57 - 0.0399H
110 ≤ H < 200
12.42-0.02533H
≤ 10.56 - 0.0215H
200 ≤ H ≤ 4000
7.35
≤ 6.25
Energy Consumption of Air-Cooled Continuous-Type Ice Makers
Equipment
Type
Applicable Ice Harvest Rate Range
(lbs of ice/24 hrs)
kWh
Base
kWh
ESTAR
IMH
H < 310
9.19-0.00629H
≤ 7.90 – 0.005409H
310 ≤ H < 820
8.23-0.0032H
≤ 7.08 – 0.002752H
820 ≤ H ≤ 4000
5.61
≤ 4.82
RCU
H < 800
9.7-0.0058H
≤ 7.76 – 0.00464H
800 ≤ H ≤ 4000
5.06
≤ 4.05
SCU
H < 200
14.22-0.03H
≤ 12.37 – 0.0261H
200 ≤ H < 700
9.47-0.00624H
≤ 8.24 – 0.005429H
700 ≤ H ≤ 4000
5.1
≤ 4.44
100 = Factor to convert kWh
Base
and kWh
ESTAR
into energy consumption per pound of ice
Duty = Duty cycle (%) of ice maker
= Custom or if unknown, use 0.75
H = Ice harvest rate (pounds of ice/day)
= Custom or if unknown, use value from table below as determined by equipment type
Ice Harvest Rate (H) of Air-Cooled Batch-Type Ice Makers
IMH
RCU
SCU
650
1,150
170
Ice Harvest Rate (H) of Air-Cooled Continuous-Type Ice Makers
IMH
RCU
SCU
680
1,170
240
Days = Annual days of operation
= Custom or if unknown, use 365.25 days per year
For example, an air-cooled, batch-type ice maker with an ice-making head producing 650 pounds of ice would
save:
ΔkWh = [((7.05 – 0.0025*650) – (6.49 – 0.0023 * 650)) / 100] * (0.75 * 650) * 365.25
= [((5.425) – (4.995)) / 100] * (0.75 * 650) * 365.25
= 765.7 kWh
Filed with the Iowa Utilities Board on September 23, 2020, EEP-2018-0002

Iowa Energy Efficiency Statewide Technical Reference Manual –3.8.9 Ice Maker
Vol.3 Nonresidential Measures July 22, 2020 FINAL Page 388 of 410
Savings for all ice maker types are presented in the table below.
Energy Consumption of Air-Cooled Batch-Type Ice Makers
Ice Maker Type
kWh
Base
kWh
ESTAR
Savings (kWh)
IMH
9,659.7
8,894.1
765.7
RCU
14,459.8
13,010.7
1,449.1
SCU
3,778.6
3,215.6
563.0
Energy Consumption of Air Cooled Continuous-Type Ice Makers
Ice Maker Type
kWh
Base
kWh
ESTAR
Savings (kWh)
IMH
11,277.2
9,702.5
1,574.7
RCU
16,217.6
12,980.5
3,237.1
SCU
5,241.5
4,560.8
680.7
SUMMER COINCIDENT PEAK DEMAND SAVINGS
Where:
kWh = Electric energy savings, calculated above
Hours = Average daily hours of operation
= Custom or if unknown, use 12 hours per day
CF = Summer peak coincidence factor
= 0.964
Other variables as defined above.
NATURAL GAS ENERGY SAVINGS
N/A
PEAK GAS SAVINGS
N/A
WATER IMPACT DESCRIPTIONS AND CALCULATION
While the ENERGY STAR labeling criteria require that certified commercial ice machines meet certain “maximum
potable water use per 100 pounds of ice made” requirements, such requirements are intended to prevent
equipment manufacturers from gaining energy efficiency at the cost of water consumptions. A review of the AHRI
Certification Directory indicates that all of air-cooled, cube-type machines meet the ENERGY STAR potable water use
requirement.
816
Therefore, there are no assumed water impacts for this measure.
816
AHRI Certification Directory, Accessed on 3/21/2018
For example, an air-cooled, batch-type ice maker with an ice-making head producing 650 pounds of ice would
save:
ΔkW = 765.7 / (12 * 365.25) * 0.964
= 0.1684kW
Filed with the Iowa Utilities Board on September 23, 2020, EEP-2018-0002

Iowa Energy Efficiency Statewide Technical Reference Manual –3.8.9 Ice Maker
Vol.3 Nonresidential Measures July 22, 2020 FINAL Page 389 of 410
DEEMED O&M COST ADJUSTMENT CALCULATION
N/A
MEASURE CODE: NR-RFG-ESIM-V02-190101
SUNSET DATE: 1/1/2024
Filed with the Iowa Utilities Board on September 23, 2020, EEP-2018-0002

Iowa Energy Efficiency Statewide Technical Reference Manual –3.8.10 Efficient Motor Controls for Walk-In and
Display Case Coolers/Freezers
Vol.3 Nonresidential Measures July 22, 2020 FINAL Page 390 of 410
3.8.10. Efficient Motor Controls for Walk-In and Display Case Coolers/Freezers
DESCRIPTION
This measure is for the installation of controls for efficient motors – defined as electrically commutated motors
(ECM) or Q-Sync motors, per measure 3.8.3 – in existing walk-in and display case coolers or freezers. The controller
reduces airflow of the evaporator fans when there is no refrigerant flow.
This measure achieves savings by controlling the motor(s) to run at lower speeds (or shut off entirely) when there is
no refrigerant flow, the result of which produces less waste heat that the cooling system must reject.
If eligible, this measure may be claimed in combination with 3.8.3 Efficient Motor for Walk-in and Display Case
Coolers / Freezers.
This measure was developed to be applicable to the following program types: RF.
If applied to other program types, the measure savings should be verified.
DEFINITION OF EFFICIENT EQUIPMENT
The measure must control a minimum of 16 Watts where fans operate continuously at full speed. This measure is
limited to motors that are rated equal to or less than 3/4 HP output capacity. The measure also must reduce fan
motor power by at least 75% during the off cycle. This measure is not applicable if any of the following conditions
apply:
• The compressor runs more than 4380 hours annually
• The evaporator fan does not run at full speed all the time
• The evaporator fan motor runs on poly-phase power
• Evaporator does not use off-cycle or time-off defrost.
DEFINITION OF BASELINE EQUIPMENT
In order for this characterization to apply, the existing condition must be a reach-in or walk-in freezer or cooler with
continuously running evaporator fans driven by electrically commutated motors (ECM) or Q-Sync motors.
DEEMED LIFETIME OF EFFICIENT EQUIPMENT
The expected measure life is assumed to be 16 years.
817
DEEMED MEASURE COST
The measure cost is assumed to be $291.
818
LOADSHAPE
Loadshape NRE01 - Nonresidential Refrigeration – Grocery
Algorithm
CALCULATION OF SAVINGS
Savings are estimated using a trend fit based on a measure created by Energy & Resource Solutions for the California
Municipal Utilities Association
819
and supported by a PGE workpaper. Note that climate differences across all
817
Source: DEER
818
Source: DEER
819
See ‘Evap Fan Control.xlsx’.
Filed with the Iowa Utilities Board on September 23, 2020, EEP-2018-0002

Iowa Energy Efficiency Statewide Technical Reference Manual –3.8.10 Efficient Motor Controls for Walk-In and
Display Case Coolers/Freezers
Vol.3 Nonresidential Measures July 22, 2020 FINAL Page 391 of 410
California climate zones result in negligible savings differences, which indicates that the average savings for the
California study should apply equally as well to Iowa. Savings found in the aforementioned source are presented in
combination with savings from an ECM upgrade, however for the purposes of this measure only those associated
with the controller are considered.
ELECTRIC ENERGY SAVINGS
Where:
kW
Output
= Output wattage of installed fan motor, in kW
= Actual or if unknown, use 0.01495 kW
820
#Motors = number of fan motors controlled
SUMMER COINCIDENT PEAK DEMAND SAVINGS
Where:
kWh = Electric energy savings, calculated above
Hours = Annual hours of cooler or freezer operation
= Assume 8,766 hours
CF = Summer peak coincidence factor
= 0.964
821
NATURAL GAS ENERGY SAVINGS
N/A
PEAK GAS SAVINGS
N/A
820
Weighted average of output motor wattages from invoices submitted to EnergySmart Grocer program. RTF Unit Energy
Savings (UES) Measures and Supporting Documentation: Grocery - ECMs for Display Cases v.3.1.
821
Based on modeling performed by VEIC of Grocery building type. This calculation is the total savings in peak hour demand
divided by the total savings in absolute peak demand.
For example, a cooler with ECM motor controls for three 0.15 kW evaportor fans would save:
kWh = ((5988.5 * kW
Output
) + 63.875) * #Motors
ΔkWh
= ((5988.5 * 0.15) + 63.875) * 3
= 2886.5 kWh
For example, a cooler with ECM motor controls for three 0.15 kW evaportor fans would save:
kW =
ΔkW
= ((2886.5/8766) * 0.964
= 0.32 kW
Filed with the Iowa Utilities Board on September 23, 2020, EEP-2018-0002

Iowa Energy Efficiency Statewide Technical Reference Manual –3.8.10 Efficient Motor Controls for Walk-In and
Display Case Coolers/Freezers
Vol.3 Nonresidential Measures July 22, 2020 FINAL Page 392 of 410
WATER IMPACT DESCRIPTIONS AND CALCULATION
N/A
DEEMED O&M COST ADJUSTMENT CALCULATION
N/A
MEASURE CODE: NR-RFG-ECMC-V01-190101
SUNSET DATE: 1/1/2024
Filed with the Iowa Utilities Board on September 23, 2020, EEP-2018-0002

Iowa Energy Efficiency Statewide Technical Reference Manual –3.8.11 Adding Doors to Open Refrigeration Display
Cases
Vol.3 Nonresidential Measures July 22, 2020 FINAL Page 393 of 410
3.8.11. Adding Doors to Open Refrigeration Display Cases
DESCRIPTION
Open display cases are typically found in grocery and convenience stores and have been a preference of store owners
because they allow customers a clear view and easy access to refrigerated products. This measure is retrofitting
existing, open, refrigerated display cases by adding and installing doors. The baseline equipment is an open vertical
or horizontal display case with no doors or covering. The efficient equipment is the installation of solid doors on the
existing display case. Replacement of open display cases with new display cases with doors is not covered under this
measure characterization.
Energy savings are based on air infiltration reduction from the addition of doors to the open display cases. The air
infiltration reductions assume a reduced heat gain and subsequent reduced load on the refrigeration compressors.
Both radiant and conduction heat losses were factored into the analysis as well. Energy savings are based on a per
linear foot of display case.
Interactive HVAC energy savings were also included in the measure savings analysis. The HVAC interactive effects
calculation assesses the measure's impact on the heating and cooling equipment. With adding a door to an open
refrigerated display case, excess cold air leaking into the conditioned space no longer has to be treated by the heating
system, resulting in additive savings. Similarly, the reduction in cold air from the open refrigerated display case no
longer supplements the efforts of the space cooling equipment, which results in an overall increase in its
consumption.
High, medium, and low temperature cases are eligible for this measure; however, the measure assumptions detailed
in this characterization are based on medium temperature display cases, with the installation of zero energy doors,
as it was deemed the most likely candidate for participation in this measure.
This measure was developed to be applicable to the following program types: RF.
If applied to other program types, the measure savings should be verified.
DEFINITION OF EFFICIENT EQUIPMENT
The efficient condition is retrofitting an existing open, refrigerated, display case by adding doors.
DEFINITION OF BASELINE EQUIPMENT
The baseline condition is an open, refrigerated, display case without any covering.
DEEMED LIFETIME OF EFFICIENT EQUIPMENT
The expected measure life is 12 years.
822
DEEMED MEASURE COST
The incremental cost, which includes both material and labor, is $522 per linear foot.
823
LOADSHAPE
Loadshape NRE01 - Nonresidential Refrigeration – Grocery
822
The measure life is sourced from the PG&E Workpaper, “Add Doors to Open Medium Temperature Cases – PGE3PREF116”,
April 2014
823
The incremental cost is sourced from the PG&E Workpaper, “Add Doors to Open Medium Temperature Cases –
PGE3PREF116”, April 2014
Filed with the Iowa Utilities Board on September 23, 2020, EEP-2018-0002

Iowa Energy Efficiency Statewide Technical Reference Manual –3.8.11 Adding Doors to Open Refrigeration Display
Cases
Vol.3 Nonresidential Measures July 22, 2020 FINAL Page 394 of 410
Loadshape NREC01:16 - Nonresidential Cooling (by Building Type)
Loadshape NRGH01:16 – Nonresidential Gas Heating (by Building Type)
Algorithm
CALCULATION OF ENERGY SAVINGS
ELECTRIC ENERGY SAVINGS
Where:
∆kWh = gross customer annual kWh savings
ΔHG = Heat Gain, the decreased load or the reduced heat gain on the open refrigerated display
case with the installation of a door (Btu/hr-linear foot)
= 1,148 Btu/h-ft
824
CL = Case Length, refrigerated case length in feet
= Actual
EER = Energy Efficiency Ratio; display case compressor efficiency (Btu/hr-watt)
= Actual. If unknown, use 11.36
825
1000 = Conversion from watts to kilowatts (W / kW)
8760 = Annual operating hours of the refrigerated display case
826
MMBtu
HVAC Cool
= Total cooling load increase on the HVAC equipment per linear foot of display case
= -2.789 MMBtu/ft
827
824
The change in heat gain is sourced as the typical value for a medium temperature display case adding doors from the PG&E
Workpaper, "Add Doors to Open Medium Temperature Cases - PGE3PREF116", April 2014. The workpaper assumes a net
reduction in heat gain with the installation of doors on open refrigerated display cases. The primary benefits account for the
decrease in excess heat entering the display case from air infiltration. Radiation and conduction heat gains were also included
in the derivation of this value. Additionally, the net heat gain has built in assumptions on how often the refrigerated case doors
will be used and the display case accessed by customers and site associates, reducing some of the air infiltration benefits of the
new door.
825
Average EER values were calculated as the average of standard reciprocating and discus compressor efficiencies, using a
typical condensing temperature of 90°F and saturated suction temperatures (SST) of 20°F for medium temperature
applications. The efficiency analysis and product review is sourced from the Efficiency Vermont TRM, which utilizes data from
Emerson Climate Technology software. Medium temperature cases have an EER value of 11.36.
826
The measure assumes the baseline equipment is not employing night covers or any other covering but is in fact left open for
the duration of its operation.
827
The MMBtu increase on the HVAC cooling equipment is based on an outdoor air temperature bin analysis, the total hours of
operation of the cooling system, and the building's overall loss of additional cooling as a result of the installation of the doors
on the open refrigerated display case. The analysis assumes a certain amount of conditioned air has to be treated to replace the
air previously cooled by the display case. Furthermore, the analysis assumes an increased load on the cooling system, at
outdoor temperatures above 62.5°F. A 25% disabling factor was also applied to account for some of the cold air pouring out of
the display case and subcooling the site's conditioned space, which will not trigger a thermostatic response from the HVAC
equipment. For more information on the analysis used to derive the load increase on the HVAC cooling equipment per linear
foot of display case, please see the 'HVAC IE' tab in the "IA TRM_Add Doors_Analysis_Apr 2020_v3.xlsx"
Filed with the Iowa Utilities Board on September 23, 2020, EEP-2018-0002

Iowa Energy Efficiency Statewide Technical Reference Manual –3.8.11 Adding Doors to Open Refrigeration Display
Cases
Vol.3 Nonresidential Measures July 22, 2020 FINAL Page 395 of 410
SEER = Seasonal Energy Efficiency Ratio; HVAC equipment operating efficiency (Btu/hr-watt)
= Actual. If unknown, use 13.00
828
SUMMER COINCIDENT PEAK DEMAND SAVINGS
Where:
Hours
Cool
= Total combined hours the site is providing cooling
= 3,329 hours
829
CF
Refrigeration
= Summer peak coincidence factor for the refrigerated display case
= 0.964
CF
Cool
= Summer peak coincidence factor for the HVAC cooling system (dependent on building
type)
Building Type
CF
Cool
830
Model Source
Convenience
92.3%
eQuest
Education
96.7%
OpenStudio
Grocery
100.0%
OpenStudio
Health
100.0%
OpenStudio
Hospital
98.6%
OpenStudio
Industrial
44.6%
eQuest
Lodging
97.4%
OpenStudio
Multifamily
100.0%
OpenStudio
Office - Large
98.8%
OpenStudio
Office - Small
100.0%
OpenStudio
Religious
94.3%
eQuest
Restaurant
99.6%
OpenStudio
Retail - Large
87.6%
eQuest
Retail - Small
100.0%
OpenStudio
Warehouse
77.9%
eQuest
Nonresidential Average
831
92.3%
N/A
828
In light of limited existing market data for the efficiency of commercial air condition equipment in Iowa grocery and
convenience stores, SEER assumptions are conservatively sourced from IECC 2012
829
The total combined hours in which the site is providing cooling is based on an outdoor air temperature bin analysis, where
the site is conditioning cold air at outdoor temperatures of 62.5°F and above. Weather data was sourced from TMY3 data for
Des Moines, IA. For more information on the derivation of these hours, please see 'HVAC IE' tab in the "IA TRM_Add
Doors_Analysis_Apr 2020_v3.xlsx"
830
This calculation is the total savings in peak hour demand divided by the total savings in absolute peak demand.
831
For weighting factors, see HVAC variable table in section 3.3.
For example, a grocery store installed doors on four open refrigerated cases, which amounted to 12 linear feet
of retrofitted display cases, savings the site:
ΔkWh = ((1148 x 12) / (11.36 x 1000) x 8760) + (-2.789 x 12 x (1 / 13) x 1000)
= 8,049 kWh
Filed with the Iowa Utilities Board on September 23, 2020, EEP-2018-0002

Iowa Energy Efficiency Statewide Technical Reference Manual –3.8.11 Adding Doors to Open Refrigeration Display
Cases
Vol.3 Nonresidential Measures July 22, 2020 FINAL Page 396 of 410
NATURAL GAS SAVINGS
Where:
∆Therms = gross customer annual therms savings
MMBtu
HVAC Heat
= Total heating load decrease on the HVAC equipment per linear foot of display case
= 4.754 MMBtu/ft
832
CL = Case Length, refrigerated case length in feet
= Actual
AFUE = 80%
833
10 = Conversion from MMBtu to therms
PEAK GAS SAVINGS
Where:
ΔTherms = Therm impact calculated above
GCF = Gas Coincidence Factor for Heating
Building Type
GCF
834
Model Source
Convenience
0.016482
eQuest
Education
0.011480
OpenStudio
Grocery
0.013083
OpenStudio
Health
0.010179
OpenStudio
Hospital
0.015543
OpenStudio
Industrial
0.014296
eQuest
Lodging
0.013205
OpenStudio
Multifamily
0.012268
OpenStudio
Office - Large
0.013082
OpenStudio
Office - Small
0.016718
OpenStudio
Religious
0.011964
eQuest
Restaurant
0.015262
OpenStudio
832
The MMBtu decrease on the HVAC heating equipment is based on an outdoor air temperature bin analysis, the total hours
of operation in which the site is providing heat, and the building's overall reduced heating load as a result of the installation of
the doors on the open refrigerated display case. The analysis assumes a certain reduction of conditioned air that had to be
treated to make up for the air previously cooled by the display case. The reduced heat gain on the refrigerated display case
equals the reduced heat loss by the site and a heating load that no longer has to be provided by the HVAC system.
Furthermore, the analysis assumes a decrease load on the heating system, at outdoor temperatures below 62.5°F. A 25%
disabling factor was also applied to account for some of the cold air pouring out of the display case and subcooling the site's
conditioned space, which will not trigger a thermostatic response from the HVAC equipment. For more information on the
analysis used to derive the load decrease on the HVAC heating equipment per linear foot of display case, please see the 'HVAC
IE' tab in the "IA TRM_Add Doors_Analysis_Apr 2020_v3.xlsx"
833
Typical heating system efficiency of 80%, consistent with current heating efficiency assumptions for lighting HVAC
interactive effects for commercial fossil fuel-fired systems.
834
Calculated as the percentage of total savings in the maximum saving day, from models.
Filed with the Iowa Utilities Board on September 23, 2020, EEP-2018-0002

Iowa Energy Efficiency Statewide Technical Reference Manual –3.8.11 Adding Doors to Open Refrigeration Display
Cases
Vol.3 Nonresidential Measures July 22, 2020 FINAL Page 397 of 410
Building Type
GCF
834
Model Source
Retail - Large
0.013281
eQuest
Retail - Small
0.014055
OpenStudio
Warehouse
0.015677
eQuest
Nonresidential Average
835
0.014658
N/A
WATER IMPACT DESCRIPTIONS AND CALCULATION
N/A
DEEMED O&M COST ADJUSTMENT CALCULATION
N/A
MEASURE CODE: NR-RFR-DOOR-V01-210101
SUNSET DATE: 1/1/2026
835
For weighting factors, see HVAC variable table in section 3.3.
Filed with the Iowa Utilities Board on September 23, 2020, EEP-2018-0002

Iowa Energy Efficiency Statewide Technical Reference Manual –3.8.12 Refrigeration Economizers
Vol.3 Nonresidential Measures July 22, 2020 FINAL Page 398 of 410
Refrigeration Economizers
DESCRIPTION
This measure applies to commercial walk in refrigeration systems and may include outside air economizers as well
as evaporator fan controllers. Economizers save energy by bringing in outside air when weather conditions allow,
rather than operating the compressor to satisfy a cooling load. Typically, walk-in refrigeration systems evaporator
fans run not only during times the compressor is operating, but also when there is no cooling load to provide air
circulation. Evaporator fans can be an inefficient method of providing air circulation since they can be oversized for
the sole function of circulation. Therefore, installing an auxiliary circulator fan and using it instead to meet circulation
needs can offer additional energy savings. Energy is not only saved from a lower circulation power requirement, but
also from the fact that there is less waste heat from the motors that the system would have to subsequently remove.
This measure allows for economizer systems with evaporator fan controls plus a circulation fan or without the option
of a circulation fan.
This measure was designed to best characterize walk in refrigeration systems with compressors that are less than 8
horsepower in size individually and operate at a temperature setpoint within the range of 15-55 degrees
Fahrenheit. Systems not meeting these specifications should be considered on a custom basis.
This measure was developed to be applicable to the following program types: RF.
If applied to other program types, the measure savings should be verified. IECC code requires economizers in certain
instances and therefore projects relying on code baseline definitions must verify eligibility.
DEFINITION OF EFFICIENT EQUIPMENT
A commissioned economizer system installed on a walk-in refrigeration system.
DEFINITION OF BASELINE EQUIPMENT
The baseline condition is a walk-in refrigeration system without an economizer.
DEEMED LIFETIME OF EFFICIENT EQUIPMENT
The estimated life of this measure is 15 years.
836
DEEMED MEASURE COST
Installation costs can vary considerably depending on system size (larger systems may require multiple economizer
units), physical site layouts (locating economizer intakes and ductwork), and controls elected. Therefore, actual site-
specific costs should be used as a custom cost input.
LOADSHAPE
Loadshape NRE17 – Refrigeration Economizer
Algorithm
CALCULATION OF ENERGY SAVINGS
ELECTRIC ENERGY SAVINGS
Electric energy savings is dependent on whether the economizer system is installed with an auxiliary circulator fan
836
Estimated life from Efficiency Vermont TRM
Filed with the Iowa Utilities Board on September 23, 2020, EEP-2018-0002

Iowa Energy Efficiency Statewide Technical Reference Manual –3.8.12 Refrigeration Economizers
Vol.3 Nonresidential Measures July 22, 2020 FINAL Page 399 of 410
and controls necessary to turn off evaporator fans when the compressor is not operating.
With Auxiliary Circulator Fan and Controls Installed
Without Auxiliary Circulator Fan and Controls Installed
Where:
HP = Horsepower of Compressor
= actual installed
kWhCond = Condensing unit savings, per hp. Based on climate zone and compressor type (value
from savings table):
837
Climate Zone
(City based upon)
Hermetic /
Semi-
Hermetic
Scroll
Discus
Zone 5 (Burlington)
758
665
629
Zone 6 (Mason City)
1149
1009
995
Average/unknown
815
716
667
Hours = Number of annual hours that economizer operates:
838
.
Climate Zone
(City based upon)
Hours
Zone 5 (Burlington)
1,877
Zone 6 (Mason City)
2,848
Average/unknown
2,020
DCComp = Duty cycle of the compressor
= 50%
839
kWEvap = Connected load kW of each evaporator fan,
= If known, actual installed. Otherwise assume 0.123 kW
840
kWCirc = Connected load kW of the circulating fan
= If known, actual installed. Otherwise assume 0.035 kW
841
837
See Iowa Economizer Calc.xls for derivation and details. 5HP compressor size used to develop kWh/Hp value. Assumes no
floating head pressure controls and compressor is located outdoors.
838
Based on TMY3 data for respective cities. Assumes a cooler setpoint of 38 degrees and economizer deadband setting of 5
degrees (economizer won’t begin operation until temperature is 33 degrees or lower).
839
A 50% duty cycle is assumed based on examination of duty cycle assumptions from Richard Travers (35%-65%), Cooltrol
(35%-65%), Natural Cool (70%), Pacific Gas & Electric (58%). Also, manufacturers typically size equipment with a built-in 67%
duty factor and contractors typically add another 25% safety factor, which results in a 50% overall duty factor.
840
Based on a weighted average of 80% shaded pole motors at 132 watts and 20% PSC motors at 88 watts
841
Wattage of fan used by Freeaire and Cooltrol. This fan is used to circulate air in the cooler when the evaporator fan is
turned off. As such, it is not used when fan control is not present
Filed with the Iowa Utilities Board on September 23, 2020, EEP-2018-0002

Iowa Energy Efficiency Statewide Technical Reference Manual –3.8.12 Refrigeration Economizers
Vol.3 Nonresidential Measures July 22, 2020 FINAL Page 400 of 410
nFans = Number of evaporator fans
= actual number of evaporator fans
DCEcon = Duty cycle of the economizer fan on days that are cool enough for the economizer to
be working
= If known, actual installed. Otherwise assume 63%
842
BF = Bonus factor for reduced cooling load attributed to removing waste heat from
evaporator fans. Dedicated high-efficiency circulator fans require less power and use high
efficiency motors, resulting in less waste heat.
= 1.3
843
kWEcon = Connected load kW of the economizer fan(s)
= If known, actual installed. Otherwise assume 0.227 kW.
844
SUMMER COINCIDENT PEAK DEMAND SAVINGS
No savings are expected since all savings occur during the winter months.
NATURAL GAS SAVINGS
N/A
WATER IMPACT DESCRIPTIONS AND CALCULATION
N/A
DEEMED O&M COST ADJUSTMENT CALCULATION
N/A
MEASURE CODE: NR-RFG-ECON-V01-210101
SUNSET DATE: 1/1/2024
842
Average of two manufacturer estimates of 50% and 75%.
843
Bonus factor (1+ 1/3.5) assumes COP of 3.5, based on the average of standard reciprocating and discus compressor
efficiencies with a Saturated Suction Temperature of 20°F and a condensing temperature of 90°F
844
The 227 watts for an economizer is calculated from the average of three manufacturers: Freeaire (186 Watts), Cooltrol (285
Watts), and Natural Cool (218 Watts).
For example, adding an outdoor air economizer with an efficient circulator fan and controls in climate zone 5 to
a 5 hp walk in refrigeration unit with 3 evaporator fans and a scroll compressor would annually save (assuming
other default assumptions):
ΔkWh = [HP * kWhCond] + [((kWEvap * nFans * DCComp * BF) – kWCirc – (kWEcon * DCEcon)) * Hours]
= [5 * 665] + [((0.123 * 3 * .5 * 1.3) – 0.035 – (0.227 * 0.63)) * 1877]
= 3208.9 kWh
Filed with the Iowa Utilities Board on September 23, 2020, EEP-2018-0002

Iowa Energy Efficiency Statewide Technical Reference Manual –3.9.1 Air Compressor with Integrated VSD
Vol.3 Nonresidential Measures July 22, 2020 FINAL Page 401 of 410
3.9. Compressed Air
3.9.1. Air Compressor with Integrated VSD
DESCRIPTION
This measure applies to the installation of an air compressor with an integrated variable frequency drive, load/no
load controls, or variable displacement controls. Baseline compressors choke off the inlet air to modulate the
compressor output, which is not an efficient response operation. Efficient compressors use a variable speed drive
on the motor to match output to the load. Savings are calculated using representative baseline and efficient demand
numbers for compressor capacities according to the facility’s load shape, and the number of hours the compressor
runs at that capacity. Demand curves are sourced from DOE data in which variable speed compressor are compared
to modulating compressors. This measure applies only to an individual compressor ≤ 200 hp. Only one compressor
per compressed air distribution system is eligible.
This measure was developed to be applicable to the following program types: TOS.
If applied to other program types, the measure savings should be verified.
DEFINITION OF EFFICIENT EQUIPMENT
The high efficiency equipment is a compressor ≤ 200 hp with variable speed controls.
DEFINITION OF BASELINE EQUIPMENT
The baseline equipment is either an oil-flooded compressor ≤ 200 hp with inlet modulating with blowdown or
load/no-load controls.
DEEMED LIFETIME OF EFFICIENT EQUIPMENT
The expected measure life is 13 years.
845
DEEMED MEASURE COST
Incremental cost = ($127 x
) + $1,446.
846
Where:
$127 and $1,446 = compressor motor nominal hp to incremental cost conversion factor and offset
= compressor motor nominal hp
LOADSHAPE
NRE13 – Indust. 1-shift (8/5)
NRE14 – Indust. 2-shift (16/5)
NRE15 – Indust. 3-shift (24/5)
NRE16 – Indust. 4-shift (24/7)
845
“Technical Support Document: Energy Efficiency Program For Consumer Products and Commercial and Industrial
Equipment: Air Compressors”, U.S. Department of Energy, December 2016 (pg. 8-12)
846
Conversion factor and offset based on a linear regression analysis of the relationship between air compressor motor
nominal horsepower and incremental cost. Values as derived from a survey conducted by several vendors to determine
equipment cost, as sourced from the Efficiency Vermont TRM, December 2018.
Filed with the Iowa Utilities Board on September 23, 2020, EEP-2018-0002

Iowa Energy Efficiency Statewide Technical Reference Manual –3.9.1 Air Compressor with Integrated VSD
Vol.3 Nonresidential Measures July 22, 2020 FINAL Page 402 of 410
Algorithm
CALCULATION OF ENERGY SAVINGS
ELECTRIC ENERGY SAVINGS
Where:
∆kWh = gross customer annual kWh savings
0.9
847
= compressor motor nominal hp to full load kW conversion factor
hp
compressor
= compressor motor nominal hp
Hours = compressor total hours of operation depending on shift, listed in the table below
Shift
Hours
Single shift (8/5)
1,976 hours
(7 AM – 3 PM, weekdays, minus three-weekday
holidays and 10 days of scheduled down time)
2-shift (16/5)
3,952 hours
(7 AM – 11 PM, weekdays, minus three-weekday
holidays and 10 days of scheduled down time)
3-shift (24/5)
5,928 hours
(24 hours per day, weekdays, minus three-weekday
holidays and 10 days of scheduled down time)
4-shift (24/7)
8,320 hours
(24 hours per day, 7 days a week, minus three-weekday
holidays and 10 days of scheduled down time)
Unknown / Weighted average
848
5,680 hours
CF
b
= baseline compressor factor
Baseline Compressor
Compressor Factor (≤ 40 hp)
849
Compressor Factor (50 - 200 hp)
850
Modulating w/ Blowdown
0.890
0.863
Load/No Load w/ 1 Gallon/CFM
0.909
0.887
847
Conversion factor based on a review of CAGI data sheets from 200 compressors. The survey and the resulting factor are
sourced from the Illinois TRM, version 8.0, October 2019 analysis file “IL TRM VSD Air Compressor – Supporting Information.xls”
(4.7.1 VSD Air Compressor).
848
Weighting of 16.1% single shift, 23.2% two-shift, 25.3% three-shift, and 35.4% four-shift as sourced from, “Evaluation of the
Compressed Air Challenge Training Program”, U.S. Department of Energy, March 2004 (section 2.1.5 Facility Operating
Schedules)
849
Compressor factors for this size range were developed using U.S. Department of Energy part load data for different
compressor control types as well as load profiles from 50 facilities employing air compressors less than or equal to 40 hp, as
sourced from the Efficiency Vermont TRM. (The “variable speed drive” compressor factor has been adjusted up from the 0.675
presented in the analysis to 0.705 to account for the additional power draw of the VSD).
850
Compressor factors for this size range were developed using U.S. Department of Energy part-load data for different
compressor control types as well as load profiles from 45 compressors and 20 facilities. This data comes from the ComEd
Custom and Industrial Systems program. The compressors were filtered to reflect only rotary screw compressors, between 50
and 200 hp, and operating a minimum of 4 hour per day. Additionally, compressors with clear and consistent baseload profiles
were excluded from this analysis. The evaluation and analysis are sourced from the Illinois TRM, version 8.0, October 2019
analysis file “IL TRM VSD Air Compressor – Supporting Information.xls” (4.7.1 VSD Air Compressor).
Filed with the Iowa Utilities Board on September 23, 2020, EEP-2018-0002

Iowa Energy Efficiency Statewide Technical Reference Manual –3.9.1 Air Compressor with Integrated VSD
Vol.3 Nonresidential Measures July 22, 2020 FINAL Page 403 of 410
Baseline Compressor
Compressor Factor (≤ 40 hp)
849
Compressor Factor (50 - 200 hp)
850
Load/No Load w/ 3 Gallon/CFM
0.831
0.811
Load/No Load w/ 5 Gallon/CFM
0.806
0.786
CF
e
= efficient compressor factor
= 0.705 for compressor ≤ 40 hp
= 0.658 for compressors 50 – 200 hp
SUMMER COINCIDENT PEAK DEMAND SAVINGS
Where:
CF = Summer peak coincidence factor for this measure
Shift
Coincidence Factor
Single shift (8/5)
0.00
2-shift (16/5)
0.95
3-shift (24/5)
0.95
4-shift (24/7)
0.95
Unknown / Weighted average
851
0.80
NATURAL GAS SAVINGS
N/A
PEAK GAS SAVINGS
N/A
WATER IMPACT DESCRIPTIONS AND CALCULATION
N/A
DEEMED O&M COST ADJUSTMENT CALCULATION
N/A
MEASURE CODE: NR-MSC-VSDA-V01-210101
SUNSET DATE: 1/1/2026
851
Weighting of 16.1% single shift, 23.2% two-shift, 25.3% three-shift, and 35.4% four-shift as sourced from, “Evaluation of the
Compressed Air Challenge Training Program”, U.S. Department of Energy, March 2004 (section 2.1.5 Facility Operating
Schedules)
For example, a 20-horsepower compressor with inlet modulating with blowdown controls is integrated with a
VSD, operating a single-shift facility would save:
ΔkWh = 0.9 x 20 x 1,976 x (0.890 – 0.705)
= 6,580 kWh
Filed with the Iowa Utilities Board on September 23, 2020, EEP-2018-0002

Iowa Energy Efficiency Statewide Technical Reference Manual –3.9.2 High Efficiency Air Nozzles
Vol.3 Nonresidential Measures July 22, 2020 FINAL Page 404 of 410
3.9.2. High Efficiency Air Nozzles
DESCRIPTION
This measure is for the replacement of standard air nozzles with high efficiency air nozzles used in a compressed air
system. High efficiency air nozzles reduce the amount of air required to blow off parts or for drying; pulling in free
air to accomplish tasks with significantly less compressed air. These nozzles often replace simple copper tubes in a
production application or on handheld guns and have added benefits of noise reduction and improved safety in
systems with greater than 30 psig.
This measure was developed to be applicable to the following program types: RF.
If applied to other program types, the measure savings should be verified.
DEFINITION OF EFFICIENT EQUIPMENT
The high efficiency air nozzle must replace continuous open blow-offs and meet the following SCFM ratings (or
less) at an operating pressure of 80 psig for the following orifice diameters:
Orifice Diameter
SCFM
1/8"
11
1/4"
29
5/16"
56
1/2"
140
DEFINITION OF BASELINE EQUIPMENT
The baseline equipment is a standard air nozzle, such as an open copper tube or an inefficient air gun.
DEEMED LIFETIME OF EFFICIENT EQUIPMENT
The expected measure life is 15 years.
852
DEEMED MEASURE COST
The incremental cost, depending on the orifice diameter, is as follows:
Orifice Diameter
Incremental Cost
1/8"
$42
1/4"
$57
5/16"
$87
1/2"
$121
LOADSHAPE
NRE13 – Indust. 1-shift (8/5)
NRE14 – Indust. 2-shift (16/5)
NRE15 – Indust. 3-shift (24/5)
NRE16 – Indust. 4-shift (24/7)
852
PA Consulting Group Inc. “State of Wisconsin Public Service Commission of Wisconsin Focus on Energy Evaluation Business
Programs: Measure Life Study Final Report.” August 25, 2009.
Filed with the Iowa Utilities Board on September 23, 2020, EEP-2018-0002
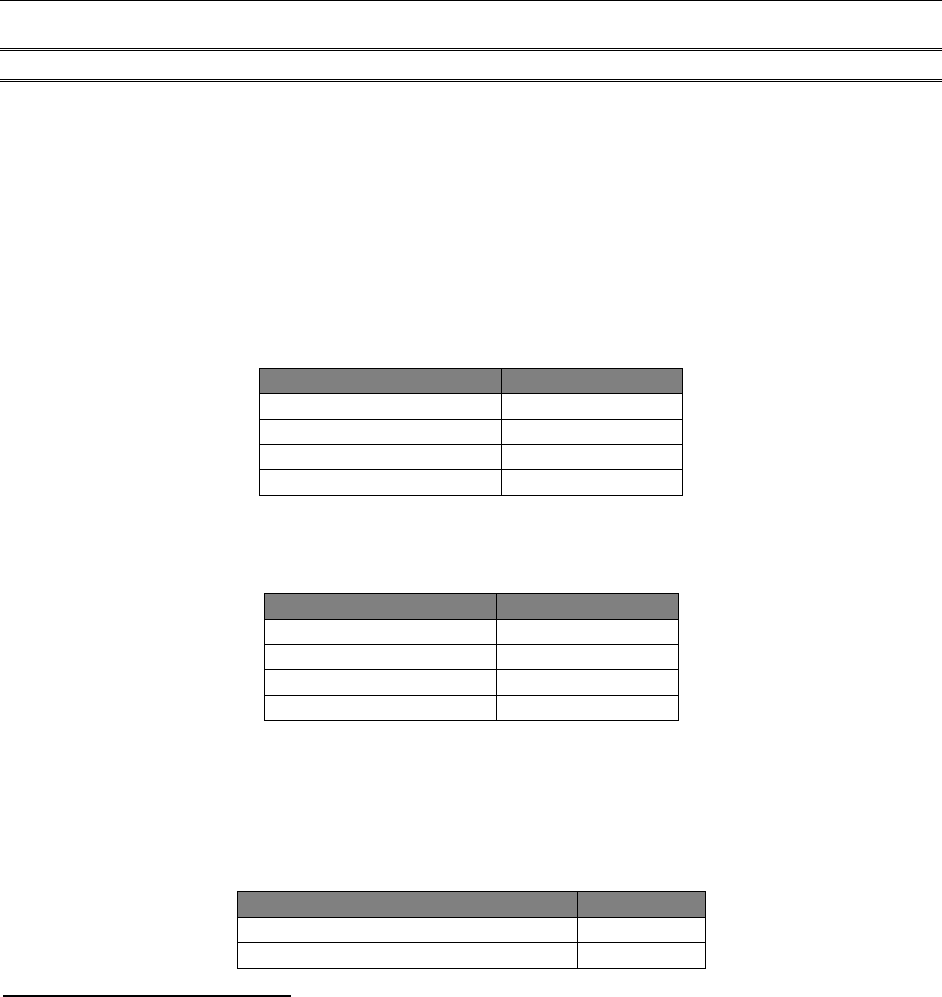
Iowa Energy Efficiency Statewide Technical Reference Manual –3.9.2 High Efficiency Air Nozzles
Vol.3 Nonresidential Measures July 22, 2020 FINAL Page 405 of 410
Algorithm
CALCULATION OF ENERGY SAVINGS
ELECTRIC ENERGY SAVINGS
Where:
∆kWh = gross customer annual kWh savings
SCFM
Baseline
= Air flow through baseline nozzle. Use actual rated flow at 80 psi if known. If unknown,
please see table below, which includes air flow in SCFM by orifice diameter:
853
Baseline Orifice Diameter
SCFM
Baseline
1/8"
21
1/4"
58
5/16"
113
1/2"
280
SCFM
Efficient
= Air flow through the efficient nozzle. Use actual rated flow rate at 80 psi if known. If
unknown, please see table below which includes air flow in SCFM by orifice diameter:
854
Efficient Orifice Diameter
SCFM
Efficient
1/8"
10.5
1/4"
29.0
5/16"
56.5
1/2"
140
%Use = Percent of the compressor total operating hours that the nozzle is in use
= 5%
855
kW/CFM
Saved
= System power reduction per reduced air demand (kW/CFM), depending on the type of
air compressor listed in the table below:
856
Air Compressor Type
kW/CFM
Saved
Reciprocating – On/Off Control
0.184
Reciprocating – Load/Unload
0.136
853
Review of manufacturer’s information and data as sourced from “Technical Reference Manual (TRM) for Ohio, Senate Bill
221: Energy Efficiency and Conservation Program”, October 15, 2019 (pg. 170-171)
854
The default efficient air flow is based on an assumed 50% reduction factor on the default baseline air flow, as sourced as a
conservative estimate based on average values provided by the Compressed Air Challenge Training Program, Machinery’s
Handbook 25
th
Edition and manufacturer’s catalogue
855
The 5 % percent use of the total compressor operating hours is based on an estimate that nozzles are used, on average, for
3 seconds per minute of operation. Manual air guns tend to be used less than stationary air nozzles, and a conservative
estimate of 1 second of blow-off per minute of compressor run time is assumed. Stationary air nozzles are commonly more
wasteful as they are often mounted on machine tools and can be manually operated resulting in the possibility of a long-term
open blow situation. An assumption of 3 seconds of blow-off per minute of compressor run time is used, assuming a weighting
of 50% handheld air guns and 50% stationary air nozzles.
856
Calculated based on the type of compressor control. This assumes the compressor will be between 40% and 100% capacity
before and after the changes to the system demand. The calculation and analysis are sourced from the Illinois TRM, version 8.0,
October 2019 analysis file “Industrial System Standard Deemed Savings Analysis.xls” (4.7.4 Efficient Compressed Air Nozzles).
Filed with the Iowa Utilities Board on September 23, 2020, EEP-2018-0002

Iowa Energy Efficiency Statewide Technical Reference Manual –3.9.2 High Efficiency Air Nozzles
Vol.3 Nonresidential Measures July 22, 2020 FINAL Page 406 of 410
Air Compressor Type
kW/CFM
Saved
Screw – Load/Unload
0.152
Screw – Inlet Modulation
0.055
Screw – Inlet Modulation w/ Unloading
0.055
Screw – Variable Displacement
0.153
Screw - VFD
0.178
Unknown / Weighted average
857
0.107
= Compressor total hours of operation. Use actual if known, otherwise, assume values
depending on shift, listed in the table below:
Shift
Hours
Single shift (8/5)
1,976 hours
(7 AM – 3 PM, weekdays, minus three-weekday
holidays and 10 days of scheduled down time)
2-shift (16/5)
3,952 hours
(7 AM – 11 PM, weekdays, minus three-weekday
holidays and 10 days of scheduled down time)
3-shift (24/5)
5,928 hours
(24 hours per day, weekdays, minus three-weekday
holidays and 10 days of scheduled down time)
4-shift (24/7)
8,320 hours
(24 hours per day, 7 days a week, minus three-weekday
holidays and 10 days of scheduled down time)
Unknown / Weighted average
858
5,680 hours
SUMMER COINCIDENT PEAK DEMAND SAVINGS
Where:
CF = Summer peak coincidence factor for this measure
Shift
Coincidence Factor
Single shift (8/5)
0.00
2-shift (16/5)
0.95
3-shift (24/5)
0.95
4-shift (24/7)
0.95
Unknown / Weighted average
859
0.80
NATURAL GAS SAVINGS
857
If compressor control type is unknown, a weighted average based on market share can be used as a default. The weighted
average is based on the following market share estimates: 40% reciprocating compressor with load/unload controls; 40%
modulation compressor with unloading controls; and 20% variable displacement control compressors
858
Weighting of 16.1% single shift, 23.2% two-shift, 25.3% three-shift, and 35.4% four-shift as sourced from, “Evaluation of the
Compressed Air Challenge Training Program”, U.S. Department of Energy, March 2004 (section 2.1.5 Facility Operating
Schedules)
859
Weighting of 16.1% single shift, 23.2% two-shift, 25.3% three-shift, and 35.4% four-shift as sourced from, “Evaluation of the
Compressed Air Challenge Training Program”, U.S. Department of Energy, March 2004 (section 2.1.5 Facility Operating
Schedules)
Filed with the Iowa Utilities Board on September 23, 2020, EEP-2018-0002

Iowa Energy Efficiency Statewide Technical Reference Manual –3.9.2 High Efficiency Air Nozzles
Vol.3 Nonresidential Measures July 22, 2020 FINAL Page 407 of 410
N/A
PEAK GAS SAVINGS
N/A
WATER IMPACT DESCRIPTIONS AND CALCULATION
N/A
DEEMED O&M COST ADJUSTMENT CALCULATION
N/A
MEASURE CODE: NR-MSC-ACNZ-V01-210101
SUNSET DATE: 1/1/2026
Filed with the Iowa Utilities Board on September 23, 2020, EEP-2018-0002

Iowa Energy Efficiency Statewide Technical Reference Manual –3.9.3 No Loss Condensate Drains
Vol.3 Nonresidential Measures July 22, 2020 FINAL Page 408 of 410
3.9.3. No Loss Condensate Drains
DESCRIPTION
When air is compressed, water in the form of condensation squeezes out of the compressed air and collects in piping
and storage tanks. The water must be drained so as not to interfere with the flow of compressed air, as well as to
reduce the potential for corrosion to the piping or tank. Many drains are controlled by a timer and open an orifice
for a programmed set amount of time, regardless of the level of the condensate. As a result, compressed air is
allowed to escape after the condensate has drained. Timed drains typically continue to operate even when the
compressor is down, effectively bleeding off useful stored air that must be remade when the compressor is restarted.
No loss condensate drains are controlled by a sensor and only open and close when there is a need to drain
condensate, effectively closing before compressed air can escape.
This measure was developed to be applicable to the following program types: RF.
If applied to other program types, the measure savings should be verified.
DEFINITION OF EFFICIENT EQUIPMENT
The high efficiency equipment is a no loss condensate drain that is controlled by a sensor and only opens when
there is a need to drain condensate, closing before any compressed air is vented.
DEFINITION OF BASELINE EQUIPMENT
The baseline equipment is a standard condensate drain (open valve, timer, or both) that operates according to a
preset schedule regardless of the amount or presence of condensate.
DEEMED LIFETIME OF EFFICIENT EQUIPMENT
The expected measure life is 13 years.
860
DEEMED MEASURE COST
The average equipment cost per drain is $194 with an installation labor cost of $50 for a total incremental cost of
$244 per drain.
861
LOADSHAPE
NRE03 – Industrial Motor
Algorithm
CALCULATION OF ENERGY SAVINGS
ELECTRIC ENERGY SAVINGS
860
“Measure Life Study”, prepared for the Massachusetts Joint Utilities, Energy & Resources Solutions, 2005. Value is based on
C&I compressor retrofit effective useful lives.
861
Based on empirical project data from ComEd Comprehensive Compressed Air Study program and VEIC review of pricing
data. The cost analysis and product review is sourced from the Illinois TRM, version 8.0, October 2019 analysis file “CAS Cost
Data.xls” (4.7.3 Compressed Air No-Loss Condensate Drains)
Filed with the Iowa Utilities Board on September 23, 2020, EEP-2018-0002

Iowa Energy Efficiency Statewide Technical Reference Manual –3.9.3 No Loss Condensate Drains
Vol.3 Nonresidential Measures July 22, 2020 FINAL Page 409 of 410
Where:
∆kWh = gross customer annual kWh savings
CFM
reduced
= Reduced air consumption per drain
= 3 CFM
862
kW/CFM
saved
= System power reduction per reduced air demand (kW/CFM), depending on the type of
air compressor listed in the table below:
863
Air Compressor Type
kW/CFM
Saved
Reciprocating – On/Off Control
0.184
Reciprocating – Load/Unload
0.136
Screw – Load/Unload
0.152
Screw – Inlet Modulation
0.055
Screw – Inlet Modulation w/ Unloading
0.055
Screw – Variable Displacement
0.153
Screw - VFD
0.178
Unknown / Weighted average
864
0.107
Hours = Compressed air system pressurized hours
= 6,136 hours
865
SUMMER COINCIDENT PEAK DEMAND SAVINGS
Where:
CF = Summer peak coincidence factor for this measure
= 0.95
NATURAL GAS SAVINGS
N/A
PEAK GAS SAVINGS
N/A
862
Reduced CFM consumption is based on a timer drain opening 10 seconds every 300 seconds as the baseline. This value is
sourced from the Illinois TRM, version 8.0, October 2019 analysis file “Industrial System Standard Deemed Savings Analysis.xls”
(4.7.3 Compressed Air No-Loss Condensate Drains).
863
Calculated based on the type of compressor control. This assumes the compressor will be between 40% and 100% capacity
before and after the changes to the system demand. The calculation and analysis are sourced from the Illinois TRM, version 8.0,
October 2019 analysis file “Industrial System Standard Deemed Savings Analysis.xls” (4.7.3 Compressed Air No-Loss Condensate
Drains).
864
If compressor control type is unknown, a weighted average based on market share can be used as a default. The weighted
average is based on the following market share estimates: 40% reciprocating compressor with load/unload controls; 40%
modulation compressor with unloading controls; and 20% variable displacement control compressors
865
“Evaluation of the Compressed Air Challenge Training Program”, U.S. Department of Energy, March 2004 (pg. 19). The hours
are based on an average of 118 hours per week.
Filed with the Iowa Utilities Board on September 23, 2020, EEP-2018-0002

Iowa Energy Efficiency Statewide Technical Reference Manual –3.9.3 No Loss Condensate Drains
Vol.3 Nonresidential Measures July 22, 2020 FINAL Page 410 of 410
WATER IMPACT DESCRIPTIONS AND CALCULATION
N/A
DEEMED O&M COST ADJUSTMENT CALCULATION
N/A
MEASURE CODE: NR-MSC-NLCD-V01-210101
SUNSET DATE: 1/1/2026
Filed with the Iowa Utilities Board on September 23, 2020, EEP-2018-0002
