
Monitoring and alerting tools and best practices for Amazon RDS for MySQL
and MariaDB
AWS Prescriptive Guidance
Copyright © 2024 Amazon Web Services, Inc. and/or its affiliates. All rights reserved.

AWS Prescriptive Guidance Monitoring and alerting tools and best practices for Amazon RDS for
MySQL and MariaDB
AWS Prescriptive Guidance: Monitoring and alerting tools and best
practices for Amazon RDS for MySQL and MariaDB
Copyright © 2024 Amazon Web Services, Inc. and/or its affiliates. All rights reserved.
Amazon's trademarks and trade dress may not be used in connection with any product or service
that is not Amazon's, in any manner that is likely to cause confusion among customers, or in any
manner that disparages or discredits Amazon. All other trademarks not owned by Amazon are
the property of their respective owners, who may or may not be affiliated with, connected to, or
sponsored by Amazon.

AWS Prescriptive Guidance Monitoring and alerting tools and best practices for Amazon RDS for
MySQL and MariaDB
Table of Contents
Introduction ..................................................................................................................................... 1
Overview .......................................................................................................................................... 2
Targeted business outcomes ...................................................................................................................... 3
General best practices ..................................................................................................................... 5
Monitoring tools .............................................................................................................................. 7
Tools included in Amazon RDS .................................................................................................................. 8
CloudWatch namespaces ............................................................................................................................ 8
CloudWatch alarms and dashboards ........................................................................................................ 9
Amazon RDS Performance Insights ........................................................................................................ 11
Enhanced Monitoring ................................................................................................................................ 12
Additional AWS services ........................................................................................................................... 13
Third-party monitoring tools ................................................................................................................... 14
Prometheus and Grafana .................................................................................................................... 14
Percona .................................................................................................................................................... 16
DB instance monitoring ................................................................................................................ 17
Performance Insights metrics for DB instances ................................................................................... 18
Database load ........................................................................................................................................ 18
Dimensions ............................................................................................................................................. 19
Counter metrics ..................................................................................................................................... 20
SQL statistics ......................................................................................................................................... 23
CloudWatch metrics for DB instances .................................................................................................... 24
Publishing Performance Insights metrics to CloudWatch .................................................................. 24
OS monitoring ............................................................................................................................... 26
Events, logs, and audit trails ........................................................................................................ 33
Amazon RDS events .................................................................................................................................. 33
Database logs .............................................................................................................................................. 37
Audit trails ................................................................................................................................................... 39
Example ................................................................................................................................................... 40
Additional CloudTrail and CloudWatch Logs features ................................................................... 43
Alerting .......................................................................................................................................... 44
CloudWatch alarms .................................................................................................................................... 44
EventBridge rules ....................................................................................................................................... 47
Specifying actions, enabling, and disabling alarms ............................................................................ 49
Next steps and resources .............................................................................................................. 50
iii

AWS Prescriptive Guidance Monitoring and alerting tools and best practices for Amazon RDS for
MySQL and MariaDB
Document history .......................................................................................................................... 51
Glossary .......................................................................................................................................... 52
# ..................................................................................................................................................................... 52
A ..................................................................................................................................................................... 53
B ..................................................................................................................................................................... 56
C ..................................................................................................................................................................... 58
D ..................................................................................................................................................................... 61
E ..................................................................................................................................................................... 65
F ..................................................................................................................................................................... 67
G ..................................................................................................................................................................... 68
H ..................................................................................................................................................................... 69
I ...................................................................................................................................................................... 70
L ..................................................................................................................................................................... 73
M .................................................................................................................................................................... 74
O .................................................................................................................................................................... 78
P ..................................................................................................................................................................... 80
Q .................................................................................................................................................................... 83
R ..................................................................................................................................................................... 83
S ..................................................................................................................................................................... 86
T ..................................................................................................................................................................... 90
U ..................................................................................................................................................................... 91
V ..................................................................................................................................................................... 92
W .................................................................................................................................................................... 92
Z ..................................................................................................................................................................... 93
iv

AWS Prescriptive Guidance Monitoring and alerting tools and best practices for Amazon RDS for
MySQL and MariaDB
Monitoring and alerting tools and best practices for
Amazon RDS for MySQL and MariaDB
Igor Obradovic, Amazon Web Services (AWS)
June 2024 (document history)
Database monitoring is the process of measuring, tracking, and assessing the availability,
performance, and functionality of a database. Monitoring and alerting solutions help organizations
ensure that their database services, and therefore their associated applications and workloads,
are secure, high-performing, resilient, and efficient. On AWS, you can collect and analyze your
workload logs, metrics, events, and traces in order to understand the health of your workload and
to gain insights from operations over time.
You can monitor your resources to ensure that they are performing as expected, and to detect and
remediate any issues before they impact your customers. You should use the metrics, logs, events,
and traces that you monitor to raise alarms when thresholds are breached.
This guide describes database observability and monitoring tools and best practices for Amazon
Relational Database Service (Amazon RDS) databases. The guide focuses on MySQL and MariaDB
databases, although most of the information also applies to other Amazon RDS database engines.
This guide is for solutions architects, database architects, DBAs, senior DevOps engineers, and
other team members who engage in designing, implementing, and managing monitoring and
observability solutions for their database workloads running in the AWS Cloud.
Contents
• Overview
• General best practices
• Monitoring tools
• DB instance monitoring
• OS monitoring
• Events, logs, and audit trails
• Alerting
• Next steps and resources
1

AWS Prescriptive Guidance Monitoring and alerting tools and best practices for Amazon RDS for
MySQL and MariaDB
Overview
Monitoring and alerting are included in four pillars of the AWS Well-Architected Framework.
• The operational excellence pillar prescribes that your workload should be designed to include
telemetry and monitoring. AWS services such as Amazon Relational Database Service (Amazon
RDS) provide the information necessary for you to understand your workload's internal state (for
example, metrics, logs, events, and traces). When you operate your Amazon RDS databases, you
will want to understand the health of your databases instances, detect operational events, and
be able to respond to both planned and unplanned events. AWS provides monitoring tools that
help you determine when organizational and business outcomes are at risk, or potentially might
be at risk, so you can take the appropriate actions at the right time.
• The performance efficiency pillar prescribes that you should monitor the performance of
your resources such as Amazon RDS DB instances by gathering, aggregating, and processing
performance-related metrics in real time. You can identify performance degradation and
remediate the factors―for example, unoptimized SQL queries or inadequate configuration
parameters―that caused it. You can raise alarms automatically when measurements are outside
expected boundaries. We recommend that you use alarms not only for notifications, but also to
initiate automated actions in response to the detected events. You can evaluate the metrics you
collect against predefined thresholds or use machine learning algorithms to identify anomalous
behavior. For example, to detect a trend of increased CPU utilization, you can gather and
analyze the cpuUtilization.total metric over a period of time. Alerting on that anomaly
proactively, before CPU utilization hits the hard limit, can help you remediate the issue before it
impacts your customers.
• The reliability pillar defines monitoring and alerting as critical to ensure that you are meeting
your availability requirements. Your monitoring solution must be able to detect failures
effectively. When it detects problems or failures, its primary objective is to alert on those issues.
Implementing continuous observability and monitoring practices is imperative for resilient
architectures in the cloud. To improve your workloads, you must be able to measure them and
understand their state and health. Design principles for automatic recovery from a failure,
horizontal scalability, and capacity provisioning depend on accurate monitoring and alerting
services.
• The security pillar discusses detection and prevention of unexpected or unwanted configuration
changes, and unexpected behavior. You can configure your Amazon RDS for MySQL and MariaDB
DB instances with the MariaDB Audit Plugin to record database activity such as user logins and
2

AWS Prescriptive Guidance Monitoring and alerting tools and best practices for Amazon RDS for
MySQL and MariaDB
specific operations run against the database. The plugin stores the record of database activity in
a log file, which can be integrated and imported into monitoring and alerting tools. The log file
is analyzed in real time for unexpected or suspicious behavior in your database. Such unexpected
or suspicious behavior can indicate that your Amazon RDS DB instance has been compromised,
which signals potential risks to your business. If the monitoring tool detects such an event, it
activates an alarm to initiate a response to the security incident, which helps address suspicious
and malicious activities.
Targeted business outcomes
Implementing best practices in monitoring and alerting mechanisms helps you ensure a high-
performing, resilient, efficient, secure, and cost-optimized infrastructure for your applications and
workloads. You can use observability tools that gather, store, and visualize metrics, events, traces,
and logs in real time to observe and analyze the bigger picture of the health and performance of
your databases, and thus prevent the degradation or disruption of your associated IT services. If
unplanned degradation or service disruption still occurs, monitoring and alerting tools help you
with timely detection of the problem, escalation, reaction, and quick investigation and resolution.
A comprehensive monitoring and alerting solution for your cloud database workloads helps you
achieve the following business outcomes:
• Improve customer experience. Reliable service improves your customers' experiences. Databases
are often a key component of digital services such as web and mobile applications, media
streaming, payments, business-to-business (B2B) APIs, and integration services. If you can
monitor and set up alerts on your databases to detect problems quickly, investigate them
efficiently, and remediate them as soon as possible to minimize downtime and other disruptions,
you can enhance the availability, security, and performance of the digital service for your
customers.
• Build customer trust. Better performance and a smoother user experience help you win your
customers' trust, which can result in more business on your platform. For example, a payment
processing service provider that offers a reliable online service can expect high customer
trust and loyalty, which results in more customers and better retention, an increase in billable
transactions, and new, innovative services that generate more revenue.
• Avoid financial losses. Any unexpected downtime in your database infrastructure can impact
the business transactions that your customers perform by using your application. This can lead
to substantial financial losses in some cases. Breaching service-level agreements (SLAs) might
result in loss of customer trust, and, consequently, a loss of revenue. It can also become a legal
Targeted business outcomes 3

AWS Prescriptive Guidance Monitoring and alerting tools and best practices for Amazon RDS for
MySQL and MariaDB
basis for expensive trials, where customers might demand compensation based on your liability
and warranty contracts. According to a study by Atlassian Corporation, a software company, the
average costs of service outage are in the range of $140K‒$540K per hour, depending on the
type and size of the business. A stable database environment is key to preventing long outages
and loss of business.
• Expand value. Monitoring and alerting mechanisms can help you design, develop, and operate
a highly available, resilient, reliable, performant, cost-effective, and secure digital service, but
it's only the beginning. You will want your organization to scale and thrive over time, enhance
existing cloud workloads, and introduce new services. New services provide additional value to
your customers and more revenue to your business, creating a flywheel effect on the growth of
your business.
• Improve developer productivity. Developers who are productive and efficient, and who don't
encounter issues and bottlenecks in their development tasks, can deliver high-quality products in
a shorter time. However, software engineering and IT operations often have complex challenges,
and this complexity increases with the scale of workloads and their architectures. To analyze
performance and consistency across distributed applications, developers need tools that
can provide correlated metrics and traces. These help identify defective code artifacts and
infrastructure components as quickly as possible, and help determine impacts on end users. The
right suite of monitoring and alerting tools can help developers code and test better and faster.
• Improve operational effectiveness and efficiency. When you operate cloud workloads at
scale, even a small percentage of performance improvements can result in millions of dollars in
savings. By monitoring your databases and analyzing metrics, events, logs, and traces, you can
understand and predict your future capacity needs, and can take advantage of the cost savings
available in the AWS Cloud. Understanding your Amazon RDS workloads and operational health
can help you respond to events, fix issues, and plan improvements.
Targeted business outcomes 4

AWS Prescriptive Guidance Monitoring and alerting tools and best practices for Amazon RDS for
MySQL and MariaDB
General best practices
The following best practices help you gain sufficient visibility into the health of your Amazon RDS
workload and take appropriate actions in response to operational events and monitoring data.
• Identify KPIs.Identify key performance indicators (KPIs) based on desired business outcomes.
Evaluate KPIs to determine workload success. For example, if your core business is ecommerce,
one of your desired business outcomes could be that your e-shop is available 24/7 for your
customers to do their shopping. To achieve that business outcome, you define the availability KPI
for the backend Amazon RDS database that your e-shop application uses, and set the baseline
KPI to 99.99% on a weekly basis. Evaluating the actual availability KPI against the baseline value
helps you determine if you are meeting the desired database availability of 99.99% and thus
achieving the business outcome of having a 24/7 service.
• Define workload metrics.Define workload metrics to measure the quantities and qualities
of your Amazon RDS workload. Evaluate metrics to determine if the workload is achieving
desired outcomes, and to understand the health of the workload. For example, to evaluate the
availability KPI for your Amazon RDS DB instance, you should measure metrics such as uptime
and downtime for the DB instance. You can then use those metrics to calculate the availability
KPI as follows:
availability = uptime / (uptime + downtime)
Metrics represent time-ordered sets of data points. Metrics can also include dimensions, which
are useful in categorization and analysis.
• Collect and analyze workload metrics.Amazon RDS generates different metrics and logs,
depending on your configuration. Some of these represent DB instance events, counters, or
statistics such as db.Cache.innoDB_buffer_pool_hits. Other metrics come from the
operating system, such as memory.Total, which measures the total amount of memory of
the host Amazon Elastic Compute Cloud (Amazon EC2) instance. The monitoring tool should
perform regular, proactive analysis of collected metrics to identify trends and determine if any
appropriate responses are needed.
• Establish workload metrics baselines.Establish baselines for metrics to define expected
values and to identify good or bad thresholds. For example, you might define the baseline for
ReadIOPS to be up to 1,000 under normal database operations. You can then use this baseline
for comparison and to identify over-utilization. If your new metrics consistently show that
5

AWS Prescriptive Guidance Monitoring and alerting tools and best practices for Amazon RDS for
MySQL and MariaDB
read IOPS are in the range of 2,000‒3,000, you have identified a deviation that could trigger a
response for investigation, intervention, and improvement.
• Alert when workload outcomes are at risk.When you determine that the business outcome
is at risk, raise an alert. You can then either address issues proactively, before they affect your
customers, or mitigate the impact of the incident in a timely manner.
• Identify the expected patterns of activity for your workload.Based on your metrics baselines,
establish patterns of workload activity to identify unexpected behavior and respond with
appropriate actions if necessary. AWS provides monitoring tools that apply statistical and
machine learning algorithms to analyze metrics and detect anomalies.
• Alert when workload anomalies are detected.When anomalies are detected in the operations
of Amazon RDS workloads, raise an alert so that you can respond with appropriate actions if
necessary.
• Review and revise KPIs and metrics. Confirm that your Amazon RDS databases meet your
defined requirements and identify areas of potential improvements to reach your business
goals. Validate the effectiveness of the measured metrics and evaluated KPIs, and revise them
if necessary. For example, let's say that you set a KPI for the optimal number of concurrent
database connections, and you monitor metrics regarding attempted and failed connections
as well as user threads that were created and are running. You might have more database
connections than those defined by your KPI baseline. By analyzing your current metrics, you can
detect the outcome but you might not be able to determine the root cause. If so, you should
revise your metrics and include additional monitoring measures, such as counters for table locks.
The new metrics would help determine if the increased number of database connections is
caused by unexpected table locks.
6

AWS Prescriptive Guidance Monitoring and alerting tools and best practices for Amazon RDS for
MySQL and MariaDB
Monitoring tools
We recommend that you use observability, monitoring, and alerting tools to:
• Gain insights into the performance of your Amazon RDS environment
• Detect unexpected and suspicious behavior
• Plan capacity and make educated decisions about allocating Amazon RDS instances
• Analyze metrics and logs to predict potential issues proactively
• Generate alerts when thresholds are breached in order to troubleshoot and resolve problems
before your users are affected
You have different options and solutions to choose from, including AWS-provided, cloud-native
observability and monitoring tools and services; free, open-source software solutions; and
commercial third-party solutions for monitoring Amazon RDS DB instances. Some of these tools
are discussed in the sections that follow.
To determine which tool best suits your needs, compare each tool's features and capabilities
against your organization's requirements. We also recommend that you evaluate the tools for ease
of deployment, configuration and integration, software updates and maintenance, method of
deployment (for example, hardware or serverless), licensing, price, and any other factors that are
specific to your organization.
Sections
• Tools included in Amazon RDS
• CloudWatch namespaces
• CloudWatch alarms and dashboards
• Amazon RDS Performance Insights
• Enhanced Monitoring
• Additional AWS services
• Third-party monitoring tools
7

AWS Prescriptive Guidance Monitoring and alerting tools and best practices for Amazon RDS for
MySQL and MariaDB
Tools included in Amazon RDS
Amazon Relational Database Service (Amazon RDS) is a managed database service in the AWS
Cloud. Because Amazon RDS is a managed service, it frees you from most management tasks, such
as database backups, operating system (OS) and database software installations, OS and software
patching, high availability setup, hardware lifecycle, and data center operations. AWS also provides
a comprehensive set of tools that enable you to build a complete observability solution for your
Amazon RDS DB instances.
Some of the monitoring tools are included, preconfigured, and automatically enabled in the
Amazon RDS service. Two automated tools are available to you as soon as you start your new
Amazon RDS instance:
• Amazon RDS instance status provides details about the current health of your DB instance. For
example, status codes include Available, Stopped, Creating, Backing-up, and Failed. You can use
the Amazon RDS console, the AWS Command Line Interface (AWS CLI), or the Amazon RDS API
to see instance status. For more information, see Viewing Amazon RDS DB instance status in the
Amazon RDS documentation.
• Amazon RDS recommendations provide automated recommendations for DB instances,
read replicas, and DB parameter groups. These recommendations are provided by analyzing
DB instance usage, performance data, and configuration, and are delivered as guidance. For
example, the Engine version outdated recommendation suggests that your DB instances aren't
running the latest version of the database software and that you should upgrade your DB
instance to benefit from the latest security fixes and other improvements. For more information,
see Viewing Amazon RDS recommendations in the Amazon RDS documentation.
CloudWatch namespaces
Amazon RDS integrates with Amazon CloudWatch, which is a monitoring and alerting service for
cloud resources and applications that run on AWS. Amazon RDS automatically collects metrics, log
files, traces, and events about the operation, utilization, performance, and health of DB instances,
and sends them to CloudWatch for long-term storage, analysis, and alerting.
Amazon RDS for MySQL and Amazon RDS for MariaDB automatically publish a default set of
metrics to CloudWatch in one-minute intervals without additional charge. Those metrics are
collected into two namespaces, which are containers for metrics:
Tools included in Amazon RDS 8

AWS Prescriptive Guidance Monitoring and alerting tools and best practices for Amazon RDS for
MySQL and MariaDB
• The AWS/RDS namespace includes DB instance-level metrics. Examples include
BinLogDiskUsage (the amount of disk space occupied by binary logs), CPUUtilization
(the percentage of CPU utilization), DatabaseConnections (the number of client network
connections to the DB instance), and many more.
• The AWS/Usage namespace includes account-level usage metrics, which are used to determine if
you are operating within your Amazon RDS service quotas. Examples include DBInstances (the
number of DB instances in your AWS account or Region), DBSubnetGroups (the number of DB
subnet groups in your AWS account or Region), and ManualSnapshots (the number of manually
created database snapshots in your AWS account or Region).
CloudWatch retains metric data as follows:
• 3 hours: High-resolution custom metrics with a period of less than 60 seconds are retained for 3
hours. After 3 hours, the data points are aggregated into 1-minute period metrics and kept for
15 days.
• 15 days: Data points with a period of 60 seconds (1 minute) are retained for 15 days. After 15
days, the data points are aggregated into 5-minute period metrics and kept for 63 days.
• 63 days: Data points with a period of 300 seconds (5 minutes) are retained for 63 days. After 63
days, the data points are aggregated into 1-hour period metrics and kept for 15 months.
• 15 months: Data points with a period of 3,600 seconds (1 hour) are available for 15 months (455
days).
For more information, see Metrics in the CloudWatch documentation.
CloudWatch alarms and dashboards
You can use Amazon CloudWatch alarms to watch a specific Amazon RDS metric over a period of
time. For example, you can monitor FreeStorageSpace, and then perform one or more actions
if the value of the metric breaches the threshold that you set. If you set the threshold to 250 MB
and the free storage space is 200 MB (less than the threshold), the alarm will be activated and can
trigger an action to automatically provision additional storage for the Amazon RDS DB instance.
The alarm can also send a notification SMS to the DBA by using Amazon Simple Notification
Service (Amazon SNS). The following diagram illustrates this process.
CloudWatch alarms and dashboards 9

AWS Prescriptive Guidance Monitoring and alerting tools and best practices for Amazon RDS for
MySQL and MariaDB
CloudWatch also provides dashboards, which you can use to create, customize, interact with, and
save customized views (graphs) of the metrics. You can also use CloudWatch Logs Insights to create
a dashboard for monitoring the slow query log and error log, and to receive alerts if a specific
pattern has been detected in those logs. The following screen shows an example CloudWatch
dashboard.
CloudWatch alarms and dashboards 10

AWS Prescriptive Guidance Monitoring and alerting tools and best practices for Amazon RDS for
MySQL and MariaDB
Amazon RDS Performance Insights
Amazon RDS Performance Insights is a database performance tuning and monitoring tool that
expands Amazon RDS monitoring features. It helps you analyze the performance of your database
by visualizing the DB instance load and filtering the load by waits, SQL statements, hosts, or users.
The tool combines multiple metrics into a single interactive graph that helps you identify the
type of bottleneck your DB instance might have, such as lock waits, high CPU consumption, or I/
O latency, and determine which SQL statements are creating the bottleneck. The following screen
shows an example visualization.
Amazon RDS Performance Insights 11

AWS Prescriptive Guidance Monitoring and alerting tools and best practices for Amazon RDS for
MySQL and MariaDB
You have to enable Performance Insights during the DB instance creation process to collect metrics
for the Amazon RDS DB instances in your account. The free tier includes seven days of performance
data history and one million API requests per month. Optionally, you can purchase longer retention
periods. For complete pricing information, see Performance Insights Pricing.
For information about how you can use Performance Insights to monitor your DB instances, see the
DB instance monitoring section later in this guide.
Performance Insights automatically publishes metrics to CloudWatch. In addition to using the
Performance Insights tool, you can take advantage of the additional features that CloudWatch
provides. You can examine the Performance Insights metrics by using the CloudWatch console, the
AWS CLI, or the CloudWatch API. You can also add CloudWatch alarms, as with any other metrics.
For example, you might want to trigger an SMS notification to DBAs or take a corrective action
if the DBLoad metric breaches the threshold value you set. You can also add the Performance
Insights metrics to your existing CloudWatch dashboards.
Enhanced Monitoring
Enhanced Monitoring is a tool that captures metrics in real time for the operating system (OS)
that your Amazon RDS DB instance runs on. These metrics provide up to one second granularity
for CPU, memory, Amazon RDS and OS processes, file system, and disk I/O data, among others.
You can access and analyze these metrics in the Amazon RDS console. As with Performance
Insights, Enhanced Monitoring metrics are delivered from Amazon RDS to CloudWatch, where you
can benefit from additional features such as the long-term preservation of metrics for analysis,
creating metrics filters, displaying graphs on the CloudWatch dashboard, and setting up alarms.
By default, Enhanced Monitoring is disabled when you create a new Amazon RDS DB instance. You
can enable the feature when you create or modify a DB instance. Pricing is based on the amount
of data transferred from Amazon RDS to CloudWatch Logs, and storage rates. Depending on the
granularity and the number of DB instances where Enhanced Monitoring is enabled, some portion
of monitoring data can be included within the CloudWatch Logs free tier. For complete pricing
details, see Amazon CloudWatch Pricing . For more information about the tool, see the Amazon
RDS documentation and the Enhanced Monitoring FAQ.
Enhanced Monitoring 12

AWS Prescriptive Guidance Monitoring and alerting tools and best practices for Amazon RDS for
MySQL and MariaDB
Additional AWS services
AWS provides several supporting services, which also integrate with Amazon RDS and CloudWatch,
to further enhance the observability of your databases. These include Amazon EventBridge,
Amazon CloudWatch Logs, and AWS CloudTrail.
• Amazon EventBridge is a serverless event bus that can receive, filter, transform, route, and
deliver events from your applications and AWS resources, including your Amazon RDS DB
instances. An Amazon RDS event indicates a change in the Amazon RDS environment. For
example, when a DB instance changes its status from Available to Stopped, Amazon RDS
generates the event RDS-EVENT-0087 / The DB instance has been stopped. Amazon
RDS delivers events to CloudWatch Events and EventBridge in near real time. Using EventBridge
and CloudWatch Events, you can define rules to send alerts on specific Amazon RDS events of
interest and automate actions to be taken when an event matches the rule. A variety of targets
are available in response to an event, such as an AWS Lambda function that can perform a
corrective action, or an Amazon SNS topic that can send an email or SMS to notify DBAs or
DevOps engineers about the event.
• Amazon CloudWatch Logs is a service that centralizes the storage of log files from all your
applications, systems, and AWS services, including Amazon RDS for MySQL and MariaDB DB
instances and AWS CloudTrail. If you enable the feature for your DB instances, Amazon RDS
automatically publishes the following logs to CloudWatch Logs:
• Error log
• Slow query log
• General log
• Audit log
You can use CloudWatch Logs Insights to query and analyze the log data. The feature
includes a purpose-built query language that helps you search for log events that match
patterns, which you define. For example, you can track table corruption in your MySQL DB
instance by monitoring the error log file for the following pattern: "ERROR 1034 (HY000):
Incorrect key file for table '*'; try to repair it OR Table * is marked
as crashed". Filtered log data can be converted into CloudWatch metrics. You can then use
the metrics to create dashboards with graphs or tabular data, or set an alarm if the defined
threshold value is breached. This is particularly useful when using the audit log, because you can
automatically monitor, send alerts, and take corrective actions if any unexpected or suspicious
Additional AWS services 13

AWS Prescriptive Guidance Monitoring and alerting tools and best practices for Amazon RDS for
MySQL and MariaDB
behavior is detected. You can access and manage database logs by using the AWS Management
Console, the AWS CLI, the Amazon RDS API, or the AWS SDK for CloudWatch Logs.
• AWS CloudTrail logs and continuously monitors user and API activity in your AWS account.
It helps you with auditing, security monitoring, and operational troubleshooting of
your Amazon RDS for MySQL or MariaDB DB instances. CloudTrail is integrated with
Amazon RDS. All actions can be logged, and CloudTrail provides a record of actions
taken by a user, role, or AWS service in Amazon RDS. For example, when a user creates
a new Amazon RDS DB instance, an event is detected, and the log includes information
about the requested action ("eventName": "CreateDBInstance"), the date and
time of the action ("eventTime": "2022-07-30T22:14:06Z"), request parameters
("requestParameters": {"dBInstanceIdentifier": "test-instance", "engine":
"mysql", "dBInstanceClass": "db.m6g.large"}), and so on. Events that are logged by
CloudTrail include both calls from the Amazon RDS console and calls from code that uses the
Amazon RDS API.
Third-party monitoring tools
In some scenarios, in addition to the full suite of cloud-native observability and monitoring tools
that AWS provides for Amazon RDS, you might want to use monitoring tools from other software
vendors. Such scenarios include hybrid deployments, where you might have a number of databases
running in your on-premises data center and another set of databases running in the AWS Cloud.
If you have already established your corporate observability solution, you might want to continue
using your existing tools and extend them to your AWS Cloud deployments. The challenge in
setting up a third-party monitoring solution often lies in the safeguards imposed by Amazon RDS
as a cloud-managed service. For example, you cannot install agent software on the host operating
system that runs the DB instance, because access to the database host machine is denied. However,
you can integrate many third-party monitoring solutions with Amazon RDS by building on top of
CloudWatch and other AWS Cloud services. For example, Amazon RDS metrics, logs, events, and
traces can be exported and then imported into the third-party monitoring tool for further analysis,
visualization, and alerting. Some of these third-party solutions include Prometheus, Grafana, and
Percona.
Prometheus and Grafana
Prometheus is an open-source monitoring solution that collects metrics from configured targets
at given intervals. It is a general-purpose monitoring solution that can monitor any application
Third-party monitoring tools 14

AWS Prescriptive Guidance Monitoring and alerting tools and best practices for Amazon RDS for
MySQL and MariaDB
or service. When you monitor Amazon RDS DB instances, CloudWatch collects the metrics from
Amazon RDS. The metrics are then exported to the Prometheus server by using an open-source
exporter such as YACE exporter or CloudWatch Exporter.
• YACE exporter optimizes data export tasks by retrieving several metrics in a single request to the
CloudWatch API. After the metrics are stored on the Prometheus server, the server evaluates rule
expressions and can generate alerts when specified conditions are observed.
• CloudWatch Exporter is officially maintained by Prometheus. It retrieves CloudWatch metrics
through the CloudWatch API and stores them on the Prometheus server in a format that's
compatible with Prometheus, by using REST API requests to the HTTP endpoint.
When you choose an exporter, design your deployment model, and configure exporter instances,
consider CloudWatch and CloudWatch Logs service and API quotas, because the export of
CloudWatch metrics to a Prometheus server is implemented on top of the CloudWatch API.
For example, deploying multiple instances of CloudWatch Exporter in a single AWS account
and Region to monitor hundreds of Amazon RDS DB instances could result in a throttling error
(ThrottlingException) and code 400 errors. To overcome such limitations, consider using YACE
exporter, which is optimized to collect up to 500 different metrics in a single request. Additionally,
to deploy a large number of Amazon RDS DB instances, you should consider using multiple AWS
accounts, instead of centralizing the workload into a single AWS account, and limiting the number
of exporter instances in each AWS account.
Alerts are generated by the Prometheus server and handled by Alertmanager. This tool takes care
of deduplicating, grouping, and routing alerts to the correct receiver such as email, SMS, or Slack,
or initiating an automated response action. Another open-source tool called Grafana displays
visualizations for these metrics. Grafana provides rich visualization widgets, such as advanced
graphs, dynamic dashboards, and analytics features such as ad-hoc queries and dynamic drilldown.
It can also search and analyze logs, and includes alerting features to continuously evaluate metrics
and logs, and send notifications when the data matches alert rules.
Prometheus and Grafana 15
AWS Prescriptive Guidance Monitoring and alerting tools and best practices for Amazon RDS for
MySQL and MariaDB
Percona
Percona Monitoring and Management (PMM) is a free, open-source database monitoring,
management, and observability solution for MySQL and MariaDB. PMM collects thousands of
performance metrics from DB instances and their hosts. It provides a web UI to visualize data in
dashboards and additional features such as automatic advisors for database health assessments.
You can use PMM to monitor Amazon RDS. However, the PMM client (agent) isn't installed on
the underlying hosts of the Amazon RDS DB instances, because it doesn't have access to the
hosts. Instead, the tool connects to the Amazon RDS DB instances, queries server statistics,
INFORMATION_SCHEMA, sys schema, and Performance Schema, and uses the CloudWatch API to
acquire metrics, logs, events, and traces. PMM requires an AWS Identity and Access Management
(IAM) user access key (IAM role) and automatically discovers the Amazon RDS DB instances that
are available for monitoring. The PMM tool is profiled for database monitoring and collects
more database-specific metrics than Prometheus. To use the PMM Query Analytics dashboard,
you must configure the Performance Schema as the query source, because the Query Analytics
agent isn't installed for Amazon RDS and can't read the slow query log. Instead, it queries the
performance_schema from the MySQL and MariaDB DB instances directly to obtain metrics. One
of the prominent features of PMM is its ability to alert and advise DBAs on issues that the tool
identifies in their databases. PMM offers sets of checks that can detect common security threats,
performance degradation, data loss, and data corruption.
In addition to these tools, there are several commercial observability and monitoring solutions
available on the market that can integrate with Amazon RDS. Examples include Datadog Database
Monitoring, Dynatrace Amazon RDS monitoring, and AppDynamics Database Monitoring.
Percona 16

AWS Prescriptive Guidance Monitoring and alerting tools and best practices for Amazon RDS for
MySQL and MariaDB
DB instance monitoring
A DB instance is the basic building block of Amazon RDS. It is an isolated database environment
that runs in the cloud. For MySQL and MariaDB databases, the DB instance is the mysqld program,
also known as the MySQL server, which includes multiple threads and components such as the SQL
parser, the query optimizer, thread/connection handler, system and status variables, and one or
more pluggable storage engines. Each storage engine is designed to support a specialized use case.
The default and recommended storage engine is InnoDB, which is a transactional, general-purpose,
relational database engine that complies with the atomicity, consistency, isolation, durability (ACID)
model. InnoDB features in-memory structures (buffer pool, change buffer, adaptive hash index, log
buffer) as well as on-disk structures (tablespaces, tables, indexes, undo log, redo log, doublewrite
buffer files). To ensure that your database adheres closely to the ACID model, the InnoDB storage
engine implements numerous capabilities to protect your data, including transactions, commit,
rollback, crash-recovery, row-level locking, and multiversion concurrency control (MVCC).
All these internal components of a DB instance work jointly to help maintain the availability,
integrity, and security of your data at the expected and satisfactory performance level. Depending
on your workload, each component and feature might impose resource demands on CPU, memory,
network, and storage subsystems. When a surge in demand for a specific resource exceeds the
provisioned capacity or the software limits for that resource (imposed either by configuration
parameters or by software design), the DB instance can experience performance degradation
or complete unavailability and corruption. Therefore, it is critical to measure and monitor these
internal components, compare them against defined baseline values, and generate alerts if the
monitored values deviate from the expected values.
As described previously, you can use different tools to monitor your MySQL and MariaDB instances.
We recommend that you use the Amazon RDS Performance Insights and CloudWatch tools for
monitoring and alerting, because these tools are integrated with Amazon RDS, gather high-
resolution metrics, present the latest performance information in near real time, and generate
alarms.
Regardless of your preferred monitoring tool, we recommend that you turn on the Performance
Schema in your MySQL and MariaDB DB instances. The Performance Schema is an optional feature
for monitoring the operation of the MySQL server (the DB instance) at a low level, and is designed
to have minimal impact on overall database performance. You can manage this feature by using
the performance_schema parameter. Although this parameter is optional, you must use it to
collect high-resolution (one second) per-SQL metrics, active session metrics, wait events, and
17

AWS Prescriptive Guidance Monitoring and alerting tools and best practices for Amazon RDS for
MySQL and MariaDB
other detailed, low-level monitoring information, which is collected by Amazon RDS Performance
Insights.
Sections
• Performance Insights metrics for DB instances
• CloudWatch metrics for DB instances
• Publishing Performance Insights metrics to CloudWatch
Performance Insights metrics for DB instances
Performance Insights monitors different types of metrics, as discussed in the following sections.
Database load
Database load (DBLoad) is a key metric in Performance Insights that measures the level of activity
in your database. It is collected every second and automatically published to Amazon CloudWatch.
It represents the activity of the DB instance in average active sessions (AAS), which are the number
of sessions that are concurrently running SQL queries. The DBLoad metric is different from other
time-series metrics, because it can be interpreted by using any of these five dimensions: waits, SQL,
hosts, users, and databases. These dimensions are subcategories of the DBLoad metric. You can
use them as slice by categories to represent different characteristics of the database load. For a
detailed description of how we compute the database load, see Database load in the Amazon RDS
documentation.
The following screen illustration shows the Performance Insights tool.
Performance Insights metrics for DB instances 18

AWS Prescriptive Guidance Monitoring and alerting tools and best practices for Amazon RDS for
MySQL and MariaDB
Dimensions
• Wait events are conditions that a database session waits for a resource or another operation to
complete in order to continue its processing. If you run an SQL statement such as SELECT *
FROM big_table and if this table is much bigger than the allocated InnoDB buffer pool, your
session will most likely wait for wait/io/file/innodb/innodb_data_file wait events,
which are caused by physical I/O operations on the data file. Wait events are an important
dimension for database monitoring, because they indicate possible performance bottlenecks.
Wait events indicate the resources and operations that the SQL statements you're running
within sessions spend the most time waiting for. For example, the wait/synch/mutex/
innodb/trx_sys_mutex event occurs when there is high database activity with a large
number of transactions, and the wait/synch/mutex/innodb/buf_pool_mutex event occurs
when a thread has acquired a lock on the InnoDB buffer pool to access a page in memory. For
information about all MySQL and MariaDB wait events, see Wait Event Summary Tables in the
MySQL documentation. To understand how to interpret instrument names, see Performance
Schema Instrument Naming Conventions in the MySQL documentation.
Dimensions 19

AWS Prescriptive Guidance Monitoring and alerting tools and best practices for Amazon RDS for
MySQL and MariaDB
• SQL shows which SQL statements are contributing the most to the total database load. The Top
dimensions table, which is located under the Database load chart in Amazon RDS Performance
Insights, is interactive. You can obtain a detailed list of wait events associated with the SQL
statement by clicking the bar in the Load by waits (AAS) column. When you select an SQL
statement in the list, Performance Insights displays the associated wait events in the Database
load chart and the SQL statement text in the SQL text section. SQL statistics are displayed on
the right side of the Top dimensions table.
• Hosts show the host names of the connected clients. This dimension helps you identify which
client hosts are sending most of the load to the database.
• Users group the DB load by users who are logged in to the database.
• Databases group the DB load by the name of the database the client is connected to.
Counter metrics
Counter metrics are cumulative metrics whose values can only increase or reset to zero when the
DB instance restarts. The value of a counter metric cannot be reduced to its previous value. These
metrics represent a single, monotonically increasing counter.
• Native counters are metrics that are defined by the database engine and not by Amazon RDS. For
example:
•
SQL.Innodb_rows_inserted represents the number of rows inserted into InnoDB tables.
•
SQL.Select_scan represents the number of joins that completed a full scan of the first
table.
•
Cache.Innodb_buffer_pool_reads represents the number of logical reads that the
InnoDB engine couldn't retrieve from the buffer pool and had to read directly from disk.
•
Cache.Innodb_buffer_pool_read_requests represents the number of logical read
requests.
For definitions of all native metrics, see Server Status Variables in the MySQL documentation.
• Non-native counters are defined by Amazon RDS. You can obtain these metrics either by using
a specific query or derive them by using two or more native metrics in calculations. Non-native
counter metrics can represent latencies, ratios, or hit rates. For example:
•
Cache.innoDB_buffer_pool_hits represents the number of read operations that InnoDB
could retrieve from the buffer pool without utilizing the disk. It is calculated from the native
counter metrics as follows:
Counter metrics 20

AWS Prescriptive Guidance Monitoring and alerting tools and best practices for Amazon RDS for
MySQL and MariaDB
db.Cache.Innodb_buffer_pool_read_requests - db.Cache.Innodb_buffer_pool_reads
•
IO.innoDB_datafile_writes_to_disk represents the number of InnoDB data file write
operations to disk. It captures only operations on data files―not doublewrite or redo logging
write operations. It is calculated as follows:
db.IO.Innodb_data_writes - db.IO.Innodb_log_writes - db.IO.Innodb_dblwr_writes
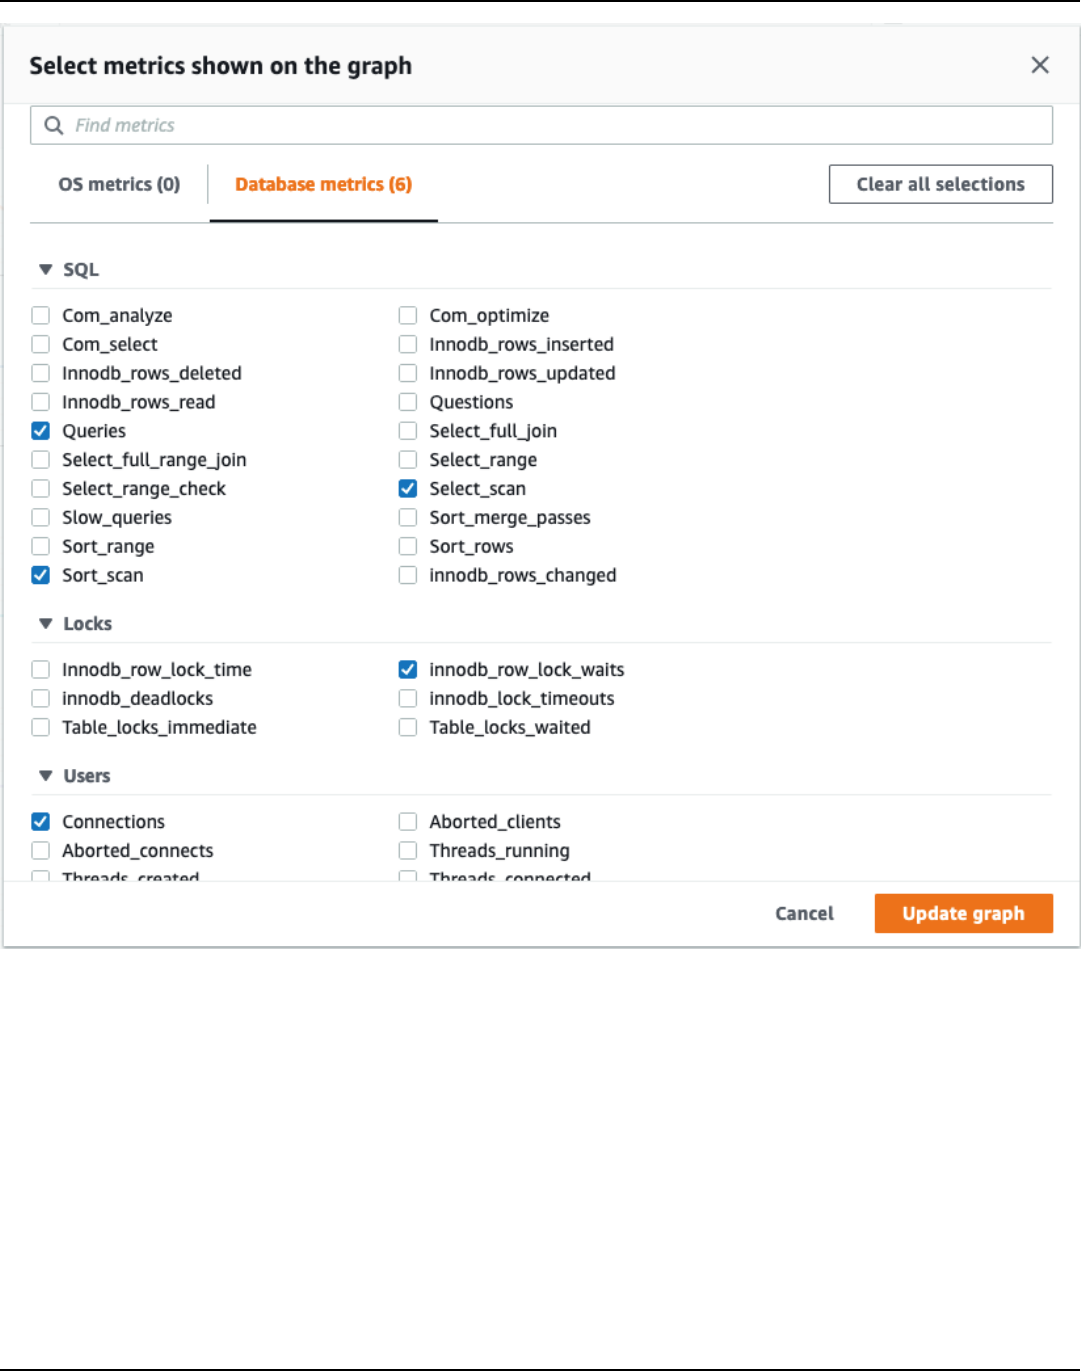
You can visualize DB instance metrics directly in the Performance Insights dashboard. Choose
Manage Metrics, choose the Database metrics tab, and then select the metrics of interest, as
shown in the following illustration.
Counter metrics 21
AWS Prescriptive Guidance Monitoring and alerting tools and best practices for Amazon RDS for
MySQL and MariaDB
Choose the Update graph button to display the metrics you selected, as shown in the following
illustration.
Counter metrics 22

AWS Prescriptive Guidance Monitoring and alerting tools and best practices for Amazon RDS for
MySQL and MariaDB
SQL statistics
Performance Insights gathers performance-related metrics about SQL queries for each second that
a query is running and for each SQL call. In general, Performance Insights collects SQL statistics
at the statement and digest levels. However, for MariaDB and MySQL DB instances, statistics are
collected only at the digest level.
• Digest statistics is a composite metric of all queries that have the same pattern but eventually
have different literal values. The digest replaces specific literal values with a variable; for
example:
SELECT department_id, department_name FROM departments WHERE location_id = ?
• There are metrics that represent statistics per second for each digested SQL statement. For
example, sql_tokenized.stats.count_star_per_sec represents calls per second (that is,
how many times per second the SQL statement has been run).
SQL statistics 23

AWS Prescriptive Guidance Monitoring and alerting tools and best practices for Amazon RDS for
MySQL and MariaDB
• Performance Insights also includes metrics that provide per call statistics for an SQL statement.
For example, sql_tokenized.stats.sum_timer_wait_per_call shows the average
latency of the SQL statement per call, in milliseconds.
SQL statistics are available in the Performance Insights dashboard, in the Top SQL tab of the Top
dimensions table.
CloudWatch metrics for DB instances
Amazon CloudWatch also contains metrics that Amazon RDS publishes automatically. The metrics
that reside in the AWS/RDS namespace are instance-level metrics, which refers to the Amazon
RDS (service) instance (that is, the isolated database environment running in the cloud) rather
than the DB instance in the strict sense of the mysqld process. Therefore, most of those default
metrics fall under the category of OS metrics, in the strict definition of the term. Examples include:
CPUUtilization, WriteIOPS, SwapUsage, and others. Nevertheless, there are some DB instance
metrics that are applicable to MariaDB and MySQL:
•
BinLogDiskUsage – The amount of disk space occupied by binary logs.
•
DatabaseConnections – The number of client network connections to the DB instance.
•
ReplicaLag – The amount of time a read replica DB instance lags behind the source DB
instance.
Publishing Performance Insights metrics to CloudWatch
Amazon RDS Performance Insights monitors most of the DB instance metrics and dimensions
and makes them available through the Performance Insights dashboard in the AWS Management
Console. This dashboard is well-suited for database troubleshooting and root cause analysis.
CloudWatch metrics for DB instances 24

AWS Prescriptive Guidance Monitoring and alerting tools and best practices for Amazon RDS for
MySQL and MariaDB
However, it is not possible to create alarms in Performance Insights for performance-related
metrics. To create alarms based on Performance Insights metrics, you have to move those metrics
to CloudWatch. Having the metrics in CloudWatch also gives you access to advanced monitoring
features such as CloudWatch anomaly detection, metric math, and statistics, and you can export
the metrics to external monitoring tools such as Prometheus and Grafana.
Performance Insights metrics aren't automatically published to CloudWatch (except for the DBLoad
metric). To publish the DB instance metrics from Performance Insights to CloudWatch, you can
use the Performance Insights API to retrieve metrics, and the CloudWatch API to publish metrics
to CloudWatch. To automate the process, you can create a Lambda function and schedule it in
Amazon EventBridge to run at specified time periods―for example, every two minutes. You can
specify which Performance Insights metrics you want to publish to CloudWatch. The Lambda
function gets those metrics from all the Amazon RDS instances that have Performance Insights
enabled, and saves the metrics in CloudWatch. For more information about this process, see the
blog post about delivering Performance Insights counter metrics to CloudWatch.
Publishing Performance Insights metrics to CloudWatch 25

AWS Prescriptive Guidance Monitoring and alerting tools and best practices for Amazon RDS for
MySQL and MariaDB
OS monitoring
A DB instance in Amazon RDS for MySQL or MariaDB runs on the Linux operating system, which
uses underlying system resources: CPU, memory, network and storage.
MySQL [(none)]> SHOW variables LIKE 'version%';
+-------------------------+---------------------+
| Variable_name | Value |
+-------------------------+---------------------+
| version | 8.0.28 |
| version_comment | Source distribution |
| version_compile_machine | aarch64 |
| version_compile_os | Linux |
| version_compile_zlib | 1.2.11 |
+-------------------------+---------------------+
5 rows in set (0.00 sec)
The overall performance of your database and the underlying operating system strongly depend
on the utilization of system resources. For example, the CPU is the key component to the
performance of your system, because it runs the database software instructions and manages
other system resources. If the CPU is over-utilized (that is, if the load requires more CPU power
than was provisioned for your DB instance), this issue would impact the performance and the
stability of your database and consequently your application.
The database engine dynamically allocates and frees memory. When there is not enough memory
in the RAM to do the current work, the system writes memory pages to the swap memory, which
resides on the disk. Because the disk is much slower than memory, even if the disk is based on
SSD NVMe technology, excessive allocation of memory leads to performance degradation. High
memory utilization causes increased latency of database responses, because the size of a page
file grows to support additional memory. If the memory allocation is so high that it depletes both
the RAM and the swap memory spaces, the database service might become unavailable and users
could observe errors such as [ERROR] mysqld: Out of memory (Needed xyz bytes).
MySQL and MariaDB database management systems utilize the storage subsystem, which consists
of disks that store on-disk structures such as tables, indexes, binary logs, redo logs, undo logs,
and doublewrite buffer files. Therefore, the database, in contrast to other types of software, must
perform a lot of disk activity. For the optimal operation of your database, it is important that you
monitor and tune the disk I/O utilization and the disk space allocation. Database performance can
26

AWS Prescriptive Guidance Monitoring and alerting tools and best practices for Amazon RDS for
MySQL and MariaDB
be affected when the database hits the limitations of maximum IOPS or throughput supported
by the disk. For example, bursts of random access caused by an index scan might cause a large
number of I/O operations per second, which eventually might hit the limitations of the underlying
storage. Full table scans might not hit the IOPS limit, but they could cause high throughput that's
measured in megabytes per second. It is critical to monitor and generate alerts on disk space
allocation, because errors such as OS error code 28: No space left on device can cause
unavailability and corruption of the database.
Amazon RDS provides metrics in real time for the operating system that your DB instance runs
on. Amazon RDS automatically publishes one set of OS metrics to CloudWatch. Those metrics
are available to you for display and analysis in the Amazon RDS console and the CloudWatch
dashboards, and you can set alarms on the selected metrics in CloudWatch. Examples include:
•
CPUUtilization – The percentage of CPU utilization.
•
BinLogDiskUsage – The amount of disk space that's occupied by binary logs.
•
FreeableMemory – The amount of available random access memory. This represents the value
of the MemAvailable field of /proc/meminfo.
•
ReadIOPS – The average number of disk read I/O operations per second.
•
WriteThroughput – The average number of bytes written to disk per second for local storage.
•
NetworkTransmitThroughput – The outgoing network traffic on the DB node, which
combines both the database traffic and Amazon RDS traffic used for monitoring and replication.
For a complete reference of all metrics that are published by Amazon RDS to CloudWatch, see
Amazon CloudWatch metrics for Amazon RDS in the Amazon RDS documentation.
The following chart shows examples of CloudWatch metrics for Amazon RDS that are displayed on
the Amazon RDS console.
27

AWS Prescriptive Guidance Monitoring and alerting tools and best practices for Amazon RDS for
MySQL and MariaDB
The following chart shows similar metrics displayed in the CloudWatch dashboard.
28

AWS Prescriptive Guidance Monitoring and alerting tools and best practices for Amazon RDS for
MySQL and MariaDB
The other set of OS metrics is collected by Enhanced Monitoring for Amazon RDS. This tool gives
you deeper visibility into the health of your Amazon RDS for MariaDB and Amazon RDS for MySQL
DB instances, by providing real-time system metrics and OS process information. When you enable
Enhanced Monitoring on your DB instance and set the desired granularity, the tool collects the
operating system metrics and process information, which you can display and analyze on the
Amazon RDS console, as shown in the following screen.
29

AWS Prescriptive Guidance Monitoring and alerting tools and best practices for Amazon RDS for
MySQL and MariaDB
Some of the key metrics provided by Enhanced Monitoring are:
•
cpuUtilization.total – The total percentage of the CPU in use.
•
cpuUtilization.user – The percentage of CPU in use by user programs.
•
memory.active – The amount of assigned memory, in kilobytes.
•
memory.cached – The amount of memory used for caching file system-based I/O.
•
loadAverageMinute.one – The number of processes that requested CPU time during the last
minute.
For a complete list of metrics, see OS metrics in Enhanced Monitoring in the Amazon RDS
documentation.
On the Amazon RDS console, the OS process list provides details for each process that's running in
your DB instance. The list is organized into three sections:
30

AWS Prescriptive Guidance Monitoring and alerting tools and best practices for Amazon RDS for
MySQL and MariaDB
• OS processes ‒ This section represents an aggregated summary of all kernel and system
processes. These processes generally have minimal impact on database performance.
• RDS processes – This section represents a summary of the AWS processes that are required to
support an Amazon RDS DB instance. For example, it includes the Amazon RDS management
agent, monitoring and diagnostics processes, and similar processes.
• RDS child processes – This section represents a summary of the Amazon RDS processes that
support the DB instance―in this case, the mysqld process and its threads. The mysqld threads
appear nested beneath the parent mysqld process.
The following screen illustration shows the OS process list in the Amazon RDS console.
Amazon RDS delivers the metrics from Enhanced Monitoring into your CloudWatch Logs account.
The monitoring data that is shown on the Amazon RDS console is retrieved from CloudWatch Logs.
You can also retrieve the metrics for a DB instance as a log stream from CloudWatch Logs. These
metrics are stored in JSON format. You can consume the Enhanced Monitoring JSON output from
CloudWatch Logs in a monitoring system of your choice.
In order to display graphs on the CloudWatch dashboard and create alarms that would initiate an
action if a metric breaches the defined threshold, you must create metric filters in CloudWatch
31

AWS Prescriptive Guidance Monitoring and alerting tools and best practices for Amazon RDS for
MySQL and MariaDB
from CloudWatch Logs. For detailed instructions, see the AWS re:Post article on how to filter
Enhanced Monitoring CloudWatch Logs to generate automated custom metrics for Amazon RDS.
The following example illustrates the custom metric CPU.User in the Custom/RDS namespace.
This custom metric is created by filtering the cpuUtilization.user Enhanced Monitoring metric
from CloudWatch Logs.
When the metric is available in the CloudWatch repository, you can display and analyze it in
CloudWatch dashboards, apply further math and query operations, and set an alarm to monitor
this specific metric and generate alerts if the observed values are not in line with the defined alarm
conditions.
32

AWS Prescriptive Guidance Monitoring and alerting tools and best practices for Amazon RDS for
MySQL and MariaDB
Events, logs, and audit trails
Monitoring DB instance metrics and OS metrics, analyzing the trends and comparing metrics to
baseline values, and generating alerts when values breach defined thresholds are all necessary
and best practices that help you achieve and maintain the reliability, availability, performance,
and security of your Amazon RDS DB instances. However, a complete solution must also monitor
database events, log files, and audit trails of MySQL and MariaDB databases.
Sections
• Amazon RDS events
• Database logs
• Audit trails
Amazon RDS events
An Amazon RDS event indicates a change in the Amazon RDS environment. For example, when
the DB instance status changes from Starting to Available, Amazon RDS generates the event RDS-
EVENT-0088 The DB instance has been started. Amazon RDS delivers events to Amazon
EventBridge in near real time. You can access events though the Amazon RDS console, the AWS CLI
command describe-events, or the Amazon RDS API operation DescribeEvents. The following screen
illustration shows events and logs displayed on the Amazon RDS console.
Amazon RDS events 33

AWS Prescriptive Guidance Monitoring and alerting tools and best practices for Amazon RDS for
MySQL and MariaDB
Amazon RDS events 34

AWS Prescriptive Guidance Monitoring and alerting tools and best practices for Amazon RDS for
MySQL and MariaDB
Amazon RDS emits different types of events, including DB instance events, DB parameter
group events, DB security group events, DB snapshot events, RDS Proxy events, and blue/green
deployment events. The information includes:
•
Source name and source type; for example: "SourceIdentifier": "database-1",
"SourceType": "db-instance"
•
Date and time of the event; for example: "Date": "2022-12-01T09:20:28.595000+00:00"
•
Message associated with the event; for example: "Message": "Finished updating DB
parameter group"
•
Event category; for example: "EventCategories": ["configuration change"]
For a complete reference, see Amazon RDS event categories and event messages in the Amazon
RDS documentation.
We recommend that you monitor Amazon RDS events, because these events indicate status
changes in the availability of DB instances, configuration changes, read replica status changes,
backup and recovery events, failover actions, failure events, modifications to security groups, and
many other notifications. For example, if you have set up a read replica DB instance to provide
enhanced performance and durability for your database, we recommend that you monitor Amazon
RDS events for the read replica event category associated with DB instances. This is because events
such as RDS-EVENT-0057 Replication on the read replica was terminated indicate
that your read replica is no longer synchronizing with the primary DB instance. A notification to
the responsible team that such an event has happened could help timely mitigation of the issue.
Amazon EventBridge and additional AWS services, such as AWS Lambda, Amazon Simple Queue
Service (Amazon SQS), and Amazon Simple Notification Service (Amazon SNS), can help you
automate responses to system events such as database availability issues or resource changes.
On the Amazon RDS console, you can retrieve events from the past 24 hours. If you use the AWS
CLI or the Amazon RDS API to view events, you can retrieve events from the past 14 days by using
the describe-events command as follows.
$ aws rds describe-events --source-identifier database-1 --source-type db-instance
{
"Events": [
{
"SourceIdentifier": "database-1",
"SourceType": "db-instance",
Amazon RDS events 35

AWS Prescriptive Guidance Monitoring and alerting tools and best practices for Amazon RDS for
MySQL and MariaDB
"Message": "CloudWatch Logs Export enabled for logs [audit, error, general,
slowquery]",
"EventCategories": [],
"Date": "2022-12-01T09:20:28.595000+00:00",
"SourceArn": "arn:aws:rds:eu-west-3:111122223333:db:database-1"
},
{
"SourceIdentifier": "database-1",
"SourceType": "db-instance",
"Message": "Finished updating DB parameter group",
"EventCategories": [
"configuration change"
],
"Date": "2022-12-01T09:22:40.413000+00:00",
"SourceArn": "arn:aws:rds:eu-west-3:111122223333:db:database-1"
}
]
}
If you want to store events for the long term, either until the specified expiration period or
permanently, you can use CloudWatch Logs to log the information about the events that were
generated by Amazon RDS. To implement this solution, you can use an Amazon SNS topic to
receive Amazon RDS event notifications and then call a Lambda function to log the event in
CloudWatch Logs.
1. Create a Lambda function that will be called on the event and log the information from
the event to CloudWatch Logs. CloudWatch Logs is integrated with Lambda and provides a
convenient way to log event information, by using the print function to stdout.
2. Create an SNS topic with a subscription to a Lambda function (set Protocol to Lambda), and set
the Endpoint to the Amazon Resource Name (ARN) of the Lambda function that you created in
the previous step.
3. Configure your SNS topic to receive Amazon RDS event notifications. For detailed instructions,
see the AWS re:Post article on how to get your Amazon SNS topic to receive Amazon RDS
notifications.
4. On the Amazon RDS console, create a new event subscription. Set Target to the ARN, and then
select the SNS topic you previously created. Set Source type and Event categories to include
according to your requirements. For more information, see Subscribing to Amazon RDS event
notification in the Amazon RDS documentation.
Amazon RDS events 36

AWS Prescriptive Guidance Monitoring and alerting tools and best practices for Amazon RDS for
MySQL and MariaDB
Database logs
MySQL and MariaDB databases generate logs that you can access for auditing and troubleshooting.
Those logs are:
• Audit – The audit trail is a set of records that log the server's activity. For each client session, it
records who connected to the server (user name and host), which queries were run, which tables
were accessed, and which server variables were changed.
•
Error – This log contains the server's (mysqld) startup and shutdown times, and diagnostic
messages such as errors, warnings, and notes that occur during server startup and shutdown,
and while the server is running.
•
General – This log records the activity of mysqld, including the connect and disconnect activity
for each client, and SQL queries received from clients. The general query log can be very useful
when you suspect an error and want to know exactly what the client sent to mysqld.
• Slow query – This log provides a record of SQL queries that took a long time to perform.
As a best practice, you should publish database logs from Amazon RDS to Amazon CloudWatch
Logs. With CloudWatch Logs, you can perform real-time analysis of the log data, store the data
in highly durable storage, and manage the data with the CloudWatch Logs agent. You can access
and watch your database logs from the Amazon RDS console. You can also use CloudWatch Logs
Insights to interactively search and analyze your log data in CloudWatch Logs. The following
example illustrates a query on the audit log that checks how many times CONNECT events appear
in the log, who connected, and which client (IP address) they connected from. The excerpt from the
audit log could look like this:
20221201 14:07:05,ip-10-22-1-51,rdsadmin,localhost,821,0,CONNECT,,,0,SOCKET
20221201 14:07:05,ip-10-22-1-51,rdsadmin,localhost,821,0,DISCONNECT,,,0,SOCKET
20221201 14:12:20,ip-10-22-1-51,rdsadmin,localhost,822,0,CONNECT,,,0,SOCKET
20221201 14:12:20,ip-10-22-1-51,rdsadmin,localhost,822,0,DISCONNECT,,,0,SOCKET
20221201 14:17:35,ip-10-22-1-51,rdsadmin,localhost,823,0,CONNECT,,,0,SOCKET
20221201 14:17:35,ip-10-22-1-51,rdsadmin,localhost,823,0,DISCONNECT,,,0,SOCKET
20221201 14:22:50,ip-10-22-1-51,rdsadmin,localhost,824,0,CONNECT,,,0,SOCKET
20221201 14:22:50,ip-10-22-1-51,rdsadmin,localhost,824,0,DISCONNECT,,,0,SOCKET
The example Log Insights query shows that rdsadmin connected to the database from
localhost every 5 minutes, for a total of 22 times, as shown in the following illustration. These
Database logs 37

AWS Prescriptive Guidance Monitoring and alerting tools and best practices for Amazon RDS for
MySQL and MariaDB
results indicate that the activity originated from internal Amazon RDS processes such as the
monitoring system itself.
Database logs 38

AWS Prescriptive Guidance Monitoring and alerting tools and best practices for Amazon RDS for
MySQL and MariaDB
Log events frequently include important messages that you want to count, such as warnings or
errors about operations associated with MySQL and MariaDB DB instances. For example, if an
operation fails, an error may occur and be recorded to the error log file as follows: ERROR 1114
(HY000): The table zip_codes is full. You might want to monitor these entries to
understand the trend of your errors. You can create custom CloudWatch metrics from Amazon
RDS logs by using filters to enable automatic monitoring of Amazon RDS database logs to
monitor a specific log for specific patterns, and to generate an alarm if there are violations of
expected behavior. For example, create a metric filter for the log group /aws/rds/instance/
database-1/error that would monitor the error log and search for the specific pattern, such
as ERROR. Set the Filter Pattern to ERROR and Metric Value to 1. The filter will detect every log
record that has the keyword ERROR, and it will increment the count by 1 for every log event that
contains "ERROR". After you create the filter, you can set an alarm to notify you in case errors are
detected in the MySQL or MariaDB error log.
To learn more about monitoring the slow query log and error log by creating a CloudWatch
dashboard and using CloudWatch Logs Insights, see the blog post Creating an Amazon CloudWatch
dashboard to monitor Amazon RDS and Amazon Aurora MySQL.
Audit trails
The audit trail (or audit log) provides a security-relevant, chronological record of events in your
AWS account. It includes events for Amazon RDS, which provide documentary evidence of the
sequence of activities that have affected your database or your cloud environment. In Amazon RDS
for MySQL or MariaDB, using the audit trail involves:
• Monitoring the DB instance audit log
• Monitoring Amazon RDS API calls in AWS CloudTrail
For an Amazon RDS DB instance, the objectives of auditing typically include:
• Enabling accountability for the following:
• Modifications performed on the parameter or security configuration
• Actions performed in a database schema, table, or row, or actions that affect specific content
• Intrusion detection and investigation
• Suspicious activity detection and investigation
Audit trails 39

AWS Prescriptive Guidance Monitoring and alerting tools and best practices for Amazon RDS for
MySQL and MariaDB
• Detection of authorization problems; for example, to identify access rights abuses by regular or
privileged users
The database audit trail tries to answer these typical questions: Who viewed or modified sensitive
data inside your database? When did this happen? Where did a specific user access the data from? Did
privileged users abuse their unlimited access rights?
Both MySQL and MariaDB implement the DB instance audit trail feature by using the MariaDB
Audit Plugin. This plugin records database activity such as users logging on to the database
and queries running against the database. The record of database activity is stored in a
log file. To access the audit log, the DB instance must use a custom option group with the
MARIADB_AUDIT_PLUGIN option. For more information, see MariaDB Audit Plugin support for
MySQL in the Amazon RDS documentation. The records in the audit log are stored in a specific
format, as defined by the plugin. You can find more details about the audit log format in the
MariaDB Server documentation.
The AWS Cloud audit trail for your AWS account is provided by the AWS CloudTrail service.
CloudTrail captures API calls for Amazon RDS as events. All Amazon RDS actions are logged.
CloudTrail provides a record of actions in Amazon RDS performed by a user, role, or another AWS
service. Events include actions taken in the AWS Management Console, AWS CLI, and AWS SDKs
and APIs.
Example
In a typical audit scenario, you might need to combine AWS CloudTrail trails with the database
audit log and Amazon RDS events monitoring. For example, you might have a scenario where the
database parameters of your Amazon RDS DB instance (for example, database-1) have been
modified and your task is to identify who did the modification, what was changed, and when the
change happened.
To accomplish the task, follow these steps:
1.
List the Amazon RDS events that happened to the database instance database-1 and
determine whether there is an event in the category configuration change that has the
message Finished updating DB parameter group.
$ aws rds describe-events --source-identifier database-1 --source-type db-instance
{
Example 40

AWS Prescriptive Guidance Monitoring and alerting tools and best practices for Amazon RDS for
MySQL and MariaDB
"Events": [
{
"SourceIdentifier": "database-1",
"SourceType": "db-instance",
"Message": "Finished updating DB parameter group",
"EventCategories": [
"configuration change"
],
"Date": "2022-12-01T09:22:40.413000+00:00",
"SourceArn": "arn:aws:rds:eu-west-3:111122223333:db:database-1"
}
]
}
2. Identify which DB parameter group the DB instance is using:
$ aws rds describe-db-instances --db-instance-identifier database-1 --query
'DBInstances[*].[DBInstanceIdentifier,Engine,DBParameterGroups]'
[
[
"database-1",
"mariadb",
[
{
"DBParameterGroupName": "mariadb10-6-test",
"ParameterApplyStatus": "pending-reboot"
}
]
]
]
3.
Use the AWS CLI to search for CloudTrail events in the Region where database-1 is
deployed, in the time period around the Amazon RDS event discovered in step 1, and where
EventName=ModifyDBParameterGroup.
$ aws cloudtrail --region eu-west-3 lookup-events --lookup-attributes
AttributeKey=EventName,AttributeValue=ModifyDBParameterGroup --start-time
"2022-12-01, 09:00 AM" --end-time "2022-12-01, 09:30 AM"
{
"eventVersion": "1.08",
"userIdentity": {
"accountId": "111122223333",
Example 41

AWS Prescriptive Guidance Monitoring and alerting tools and best practices for Amazon RDS for
MySQL and MariaDB
"accessKeyId": "AKIAIOSFODNN7EXAMPLE",
"sessionContext": {
"sessionIssuer": {
"type": "Role",
"principalId": "AIDACKCEVSQ6C2EXAMPLE",
"arn": "arn:aws:iam::111122223333:role/Role1",
"accountId": "111122223333",
"userName": "User1"
}
}
},
"eventTime": "2022-12-01T09:18:19Z",
"eventSource": "rds.amazonaws.com",
"eventName": "ModifyDBParameterGroup",
"awsRegion": "eu-west-3",
"sourceIPAddress": "AWS Internal",
"userAgent": "AWS Internal",
"requestParameters": {
"parameters": [
{
"isModifiable": false,
"applyMethod": "pending-reboot",
"parameterName": "innodb_log_buffer_size",
"parameterValue": "8388612"
},
{
"isModifiable": false,
"applyMethod": "pending-reboot",
"parameterName": "innodb_write_io_threads",
"parameterValue": "8"
}
],
"dBParameterGroupName": "mariadb10-6-test"
},
"responseElements": {
"dBParameterGroupName": "mariadb10-6-test"
},
"requestID": "fdf19353-de72-4d3d-bf29-751f375b6378",
"eventID": "0bba7484-0e46-4e71-93a8-bd01ca8386fe",
"eventType": "AwsApiCall",
"managementEvent": true,
"recipientAccountId": "111122223333",
"eventCategory": "Management",
Example 42

AWS Prescriptive Guidance Monitoring and alerting tools and best practices for Amazon RDS for
MySQL and MariaDB
"sessionCredentialFromConsole": "true"
}
The CloudTrail event reveals that User1 with role Role1 from AWS account 111122223333
modified the DB parameter group mariadb10-6-test, which was used by the DB instance
database-1 on 2022-12-01 at 09:18:19 h. Two parameters were modified and set to the
following values:
•
innodb_log_buffer_size = 8388612
•
innodb_write_io_threads = 8
Additional CloudTrail and CloudWatch Logs features
You can troubleshoot operational and security incidents over the past 90 days by viewing Event
history on the CloudTrail console. To extend the retention period and take advantage of additional
query capabilities, you can use AWS CloudTrail Lake. With AWS CloudTrail Lake, you can keep event
data in an event data store for up to seven years. Additionally, the service supports complex SQL
queries that offer a deeper and more customizable view of events than the views provided by
simple key-value lookups in Event history.
To monitor your audit trails, set alarms, and get notifications when specific activity occurs, you
need to configure CloudTrail to send its trail records to CloudWatch Logs. After the trail records are
stored as CloudWatch Logs, you can define metric filters to evaluate log events to match terms,
phrases, or values, and assign metrics to metric filters. Furthermore, you can create CloudWatch
alarms that are generated according to thresholds and time periods that you specify. For example,
you can configure alarms that send notifications to responsible teams, so they can take the
appropriate action. You can also configure CloudWatch to automatically perform an action in
response to an alarm.
Additional CloudTrail and CloudWatch Logs features 43

AWS Prescriptive Guidance Monitoring and alerting tools and best practices for Amazon RDS for
MySQL and MariaDB
Alerting
Alerts are one of the most important information sources when it comes to the security,
availability, performance, and reliability of your IT infrastructure and IT services. They notify and
inform your IT teams about ongoing security threats, outages, performance issues, or system
failures.
The Information Technology Infrastructure Library (ITIL), specifically IT service management (ITSM)
practices, set automated alerting at the focal point of monitoring and event management and
incident management best practices.
Incident alerting is when monitoring tools generate alerts to notify your team and automated tools
(for items that are automatically actionable) about changes, high-risk actions, or failures in the IT
environment. IT alerts are the first line of defense against system outages or changes that can turn
into major incidents. By automatically monitoring systems and generating alerts for outages and
risky changes, IT teams can minimize downtime and reduce the high cost that comes with it.
As best practices, the AWS Well-Architected Framework prescribes that you use monitoring to
generate alarm-based notifications, and monitor and alarm proactively. Use CloudWatch or a
third-party monitoring service to set alarms that indicate when metrics are outside of expected
boundaries.
The purpose of alert management is to establish efficient, standardized procedures for handling IT-
related events and incidents through logging, classification, action definition and implementation,
closure, and post-incident review activities.
Sections
• CloudWatch alarms
• EventBridge rules
• Specifying actions, enabling, and disabling alarms
CloudWatch alarms
When you operate your Amazon RDS DB instances, you want to monitor and generate alerts
on different kinds of metrics, events, and traces. For MySQL and MariaDB databases, the critical
sources of information are DB instance metrics, OS metrics, events, logs, and audit trails. We
CloudWatch alarms 44

AWS Prescriptive Guidance Monitoring and alerting tools and best practices for Amazon RDS for
MySQL and MariaDB
recommend that you use CloudWatch alarms to watch a single metric over a time period that you
specify.
The following example illustrates how you can set an alarm that watches the CPUUtilization
metric (percentage of CPU utilization) on all your Amazon RDS DB instances. You configure the
alarm to be triggered if the CPU utilization on any DB instance is greater than 80 percent for the
evaluation period of 5 minutes.
CloudWatch alarms 45

AWS Prescriptive Guidance Monitoring and alerting tools and best practices for Amazon RDS for
MySQL and MariaDB
This means that the alarm goes into the ALARM state if any of your databases experiences a high
CPU utilization (over 80 percent) for 5 minutes or more. The alarm remains in the OK state if the
CPU occasionally bursts to over 80 percent utilization for a short period of time, and then drops
again below the threshold. The following graph illustrates this logic.
CloudWatch alarms support metric and composite alarms.
• A metric alarm watches a single CloudWatch metric and can perform mathematical expressions
on the metric. A metric alarm can send Amazon SNS messages, which, in turn, can take one or
more actions based on the value of the metric relative to a given threshold over a number of
time periods.
• A composite alarm is based on a rule expression, which evaluates the states of multiple alarms
and goes into the ALARM state only if all conditions of the rule are met. Composite alarms are
typically used to reduce the number of unnecessary alerts. For example, you might have a
composite alarm that contains several metric alarms that are configured never to take actions.
The composite alarm would send an alert when all the individual metric alarms in the composite
are already in the ALARM
CloudWatch alarms 46

AWS Prescriptive Guidance Monitoring and alerting tools and best practices for Amazon RDS for
MySQL and MariaDB
CloudWatch alarms can watch only CloudWatch metrics. If you want to create an alarm based
on the error, slow query, or general logs, you must create CloudWatch metrics from the logs.
You can accomplish that as discussed earlier in the OS monitoring and Events, logs, and audit
trails sections, by using filters to create metrics from log events. Similarly, to alert on Enhanced
Monitoring metrics, you must create metric filters in CloudWatch from CloudWatch Logs.
EventBridge rules
Amazon RDS events are delivered to Amazon EventBridge, and you can use EventBridge rules to
react to those events. For example, you can create EventBridge rules that would notify you and
take an action if one specific DB instance stops or starts up, as the following screen shows.
The rule that detects The DB instance has been stopped event has the Amazon RDS event
ID RDS-EVENT-0087, so you set the Event Pattern property of the rule to:
{
"source": ["aws.rds"],
"detail-type": ["RDS DB Instance Event"],
"detail": {
EventBridge rules 47

AWS Prescriptive Guidance Monitoring and alerting tools and best practices for Amazon RDS for
MySQL and MariaDB
"SourceArn": ["arn:aws:rds:eu-west-3:111122223333:db:database-3"],
"EventID": ["RDS-EVENT-0087"]
}
}
This rule monitors the DB instance database-3 only, and watches for the RDS-EVENT-0087
event. When EventBridge detects the event, it sends the event to a resource or endpoint, known
as a target. This is where you can specify the action you want to take if the Amazon RDS instance
shuts down. You can send the event to many possible targets, including an SNS topic, an Amazon
Simple Queue Service (Amazon SQS) queue, an AWS Lambda function, AWS Systems Manager
Automation, an AWS Batch job, Amazon API Gateway, a response plan in Incident Manager, a
capability of AWS Systems Manager, and many others. For example, you might create an SNS
topic that will send a notification email and SMS, and assign that SNS topic as the target of the
EventBridge rule. If the Amazon RDS DB instance database-3 has been stopped, Amazon RDS
delivers the event RDS-EVENT-0087 to EventBridge, where it gets detected. EventBridge then calls
the target, which is the SNS topic. The SNS topic is configured to send an email (as shown in the
following illustration) and an SMS.
EventBridge rules 48

AWS Prescriptive Guidance Monitoring and alerting tools and best practices for Amazon RDS for
MySQL and MariaDB
Specifying actions, enabling, and disabling alarms
You can use a CloudWatch alarm to specify what actions the alarm should take when it changes
between the OK, ALARM, and INSUFFICIENT_DATA states. CloudWatch has built-in integration
with SNS topics and several additional action categories that are not applicable to Amazon RDS
metrics, such as Amazon Elastic Compute Cloud (Amazon EC2) actions or Amazon EC2 Auto Scaling
group actions. EventBridge is generally used to write rules and define targets that take actions
when the alarm is triggered for Amazon RDS metrics. CloudWatch sends events to EventBridge
every time a CloudWatch alarm changes its state. You can use these alarm state change events to
trigger an event target in EventBridge. For more information, see Alarm events and EventBridge in
the CloudWatch documentation.
You might also need to manage alarms; for example, to automatically disable an alarm during
planned configuration change or tests, and then re-enable the alarm when the planned action
is over. For example, if you have a planned, scheduled database software upgrade that requires
downtime, and you have alarms that will be activated if the database becomes unavailable, you can
disable and enable alarms by using the API actions DisableAlarmActions and EnableAlarmActions,
or the disable-alarm-actions and enable-alarm-actions commands in the AWS CLI. You can also
view the alarm's history on the CloudWatch console or by using the DescribeAlarmHistory API
action or the describe-alarm-history command in the AWS CLI. CloudWatch preserves alarm history
for two weeks. On the CloudWatch console, you can choose the Favorites and recents menu in the
navigation pane to set and access your favorite and most recently visited alarms.
Specifying actions, enabling, and disabling alarms 49

AWS Prescriptive Guidance Monitoring and alerting tools and best practices for Amazon RDS for
MySQL and MariaDB
Next steps and resources
For more information about migrating your relational databases to the AWS Cloud, see the
following strategy on the AWS Prescriptive Guidance website:
• Migration strategy for relational databases
You can explore database migration patterns for step-by-step instructions regarding your specific
relational databases running in the AWS Cloud, including tasks related to monitoring, migration,
and data management.
Use the filters on that page to find patterns by AWS service (for example, migrations to Amazon
RDS or Amazon Aurora), by workload (for example, open-source, which includes MySQL and
MariaDB databases), or by planned use (production or pilot).
For additional resources, see the following:
• Amazon Relational Database Service User Guide
• Amazon CloudWatch User Guide
• Amazon RDS FAQs
• Performance Insights FAQs
• Deliver Amazon RDS Performance Insights counter metrics to a third-party Application
Performance Monitoring service provider using Amazon CloudWatch Metrics Stream (AWS blog
post)
• Creating an Amazon CloudWatch dashboard to monitor Amazon RDS and Amazon Aurora MySQL
(AWS blog post)
• Tuning Amazon RDS for MySQL with Performance Insights (AWS blog post)
50

AWS Prescriptive Guidance Monitoring and alerting tools and best practices for Amazon RDS for
MySQL and MariaDB
Document history
The following table describes significant changes to this guide. If you want to be notified about
future updates, you can subscribe to an RSS feed.
Change Description Date
Updated information Updated the information
about exporters and added
guidelines for choosing an
exporter.
June 13, 2024
Initial publication — June 30, 2023
51

AWS Prescriptive Guidance Monitoring and alerting tools and best practices for Amazon RDS for
MySQL and MariaDB
AWS Prescriptive Guidance glossary
The following are commonly used terms in strategies, guides, and patterns provided by AWS
Prescriptive Guidance. To suggest entries, please use the Provide feedback link at the end of the
glossary.
Numbers
7 Rs
Seven common migration strategies for moving applications to the cloud. These strategies build
upon the 5 Rs that Gartner identified in 2011 and consist of the following:
• Refactor/re-architect – Move an application and modify its architecture by taking full
advantage of cloud-native features to improve agility, performance, and scalability. This
typically involves porting the operating system and database. Example:Migrate your on-
premises Oracle database to the Amazon Aurora PostgreSQL-Compatible Edition.
• Replatform (lift and reshape) – Move an application to the cloud, and introduce some level
of optimization to take advantage of cloud capabilities. Example:Migrate your on-premises
Oracle database to Amazon Relational Database Service (Amazon RDS) for Oracle in the AWS
Cloud.
• Repurchase (drop and shop) – Switch to a different product, typically by moving from
a traditional license to a SaaS model. Example:Migrate your customer relationship
management (CRM) system to Salesforce.com.
• Rehost (lift and shift) – Move an application to the cloud without making any changes to
take advantage of cloud capabilities. Example:Migrate your on-premises Oracle database to
Oracle on an EC2 instance in the AWS Cloud.
• Relocate (hypervisor-level lift and shift) – Move infrastructure to the cloud without
purchasing new hardware, rewriting applications, or modifying your existing operations.
You migrate servers from an on-premises platform to a cloud service for the same platform.
Example:Migrate a Microsoft Hyper-V application to AWS.
• Retain (revisit) – Keep applications in your source environment. These might include
applications that require major refactoring, and you want to postpone that work until a later
time, and legacy applications that you want to retain, because there’s no business justification
for migrating them.
# 52

AWS Prescriptive Guidance Monitoring and alerting tools and best practices for Amazon RDS for
MySQL and MariaDB
• Retire – Decommission or remove applications that are no longer needed in your source
environment.
A
ABAC
See attribute-based access control.
abstracted services
See managed services.
ACID
See atomicity, consistency, isolation, durability.
active-active migration
A database migration method in which the source and target databases are kept in sync (by
using a bidirectional replication tool or dual write operations), and both databases handle
transactions from connecting applications during migration. This method supports migration in
small, controlled batches instead of requiring a one-time cutover. It’s more flexible but requires
more work than active-passive migration.
active-passive migration
A database migration method in which in which the source and target databases are kept in
sync, but only the source database handles transactions from connecting applications while
data is replicated to the target database. The target database doesn’t accept any transactions
during migration.
aggregate function
A SQL function that operates on a group of rows and calculates a single return value for the
group. Examples of aggregate functions include SUM and MAX.
AI
See artificial intelligence.
AIOps
See artificial intelligence operations.
A 53

AWS Prescriptive Guidance Monitoring and alerting tools and best practices for Amazon RDS for
MySQL and MariaDB
anonymization
The process of permanently deleting personal information in a dataset. Anonymization can help
protect personal privacy. Anonymized data is no longer considered to be personal data.
anti-pattern
A frequently used solution for a recurring issue where the solution is counter-productive,
ineffective, or less effective than an alternative.
application control
A security approach that allows the use of only approved applications in order to help protect a
system from malware.
application portfolio
A collection of detailed information about each application used by an organization, including
the cost to build and maintain the application, and its business value. This information is key to
the portfolio discovery and analysis process and helps identify and prioritize the applications to
be migrated, modernized, and optimized.
artificial intelligence (AI)
The field of computer science that is dedicated to using computing technologies to perform
cognitive functions that are typically associated with humans, such as learning, solving
problems, and recognizing patterns. For more information, see What is Artificial Intelligence?
artificial intelligence operations (AIOps)
The process of using machine learning techniques to solve operational problems, reduce
operational incidents and human intervention, and increase service quality. For more
information about how AIOps is used in the AWS migration strategy, see the operations
integration guide.
asymmetric encryption
An encryption algorithm that uses a pair of keys, a public key for encryption and a private key
for decryption. You can share the public key because it isn’t used for decryption, but access to
the private key should be highly restricted.
atomicity, consistency, isolation, durability (ACID)
A set of software properties that guarantee the data validity and operational reliability of a
database, even in the case of errors, power failures, or other problems.
A 54

AWS Prescriptive Guidance Monitoring and alerting tools and best practices for Amazon RDS for
MySQL and MariaDB
attribute-based access control (ABAC)
The practice of creating fine-grained permissions based on user attributes, such as department,
job role, and team name. For more information, see ABAC for AWS in the AWS Identity and
Access Management (IAM) documentation.
authoritative data source
A location where you store the primary version of data, which is considered to be the most
reliable source of information. You can copy data from the authoritative data source to other
locations for the purposes of processing or modifying the data, such as anonymizing, redacting,
or pseudonymizing it.
Availability Zone
A distinct location within an AWS Region that is insulated from failures in other Availability
Zones and provides inexpensive, low-latency network connectivity to other Availability Zones in
the same Region.
AWS Cloud Adoption Framework (AWS CAF)
A framework of guidelines and best practices from AWS to help organizations develop an
efficient and effective plan to move successfully to the cloud. AWS CAF organizes guidance
into six focus areas called perspectives: business, people, governance, platform, security,
and operations. The business, people, and governance perspectives focus on business skills
and processes; the platform, security, and operations perspectives focus on technical skills
and processes. For example, the people perspective targets stakeholders who handle human
resources (HR), staffing functions, and people management. For this perspective, AWS CAF
provides guidance for people development, training, and communications to help ready the
organization for successful cloud adoption. For more information, see the AWS CAF website and
the AWS CAF whitepaper.
AWS Workload Qualification Framework (AWS WQF)
A tool that evaluates database migration workloads, recommends migration strategies, and
provides work estimates. AWS WQF is included with AWS Schema Conversion Tool (AWS SCT). It
analyzes database schemas and code objects, application code, dependencies, and performance
characteristics, and provides assessment reports.
A 55

AWS Prescriptive Guidance Monitoring and alerting tools and best practices for Amazon RDS for
MySQL and MariaDB
B
bad bot
A bot that is intended to disrupt or cause harm to individuals or organizations.
BCP
See business continuity planning.
behavior graph
A unified, interactive view of resource behavior and interactions over time. You can use a
behavior graph with Amazon Detective to examine failed logon attempts, suspicious API
calls, and similar actions. For more information, see Data in a behavior graph in the Detective
documentation.
big-endian system
A system that stores the most significant byte first. See also endianness.
binary classification
A process that predicts a binary outcome (one of two possible classes). For example, your ML
model might need to predict problems such as “Is this email spam or not spam?" or "Is this
product a book or a car?"
bloom filter
A probabilistic, memory-efficient data structure that is used to test whether an element is a
member of a set.
blue/green deployment
A deployment strategy where you create two separate but identical environments. You run the
current application version in one environment (blue) and the new application version in the
other environment (green). This strategy helps you quickly roll back with minimal impact.
bot
A software application that runs automated tasks over the internet and simulates human
activity or interaction. Some bots are useful or beneficial, such as web crawlers that index
information on the internet. Some other bots, known as bad bots, are intended to disrupt or
cause harm to individuals or organizations.
B 56

AWS Prescriptive Guidance Monitoring and alerting tools and best practices for Amazon RDS for
MySQL and MariaDB
botnet
Networks of bots that are infected by malware and are under the control of a single party,
known as a bot herder or bot operator. Botnets are the best-known mechanism to scale bots and
their impact.
branch
A contained area of a code repository. The first branch created in a repository is the main
branch. You can create a new branch from an existing branch, and you can then develop
features or fix bugs in the new branch. A branch you create to build a feature is commonly
referred to as a feature branch. When the feature is ready for release, you merge the feature
branch back into the main branch. For more information, see About branches (GitHub
documentation).
break-glass access
In exceptional circumstances and through an approved process, a quick means for a user to
gain access to an AWS account that they don't typically have permissions to access. For more
information, see the Implement break-glass procedures indicator in the AWS Well-Architected
guidance.
brownfield strategy
The existing infrastructure in your environment. When adopting a brownfield strategy for a
system architecture, you design the architecture around the constraints of the current systems
and infrastructure. If you are expanding the existing infrastructure, you might blend brownfield
and greenfield strategies.
buffer cache
The memory area where the most frequently accessed data is stored.
business capability
What a business does to generate value (for example, sales, customer service, or marketing).
Microservices architectures and development decisions can be driven by business capabilities.
For more information, see the Organized around business capabilities section of the Running
containerized microservices on AWS whitepaper.
business continuity planning (BCP)
A plan that addresses the potential impact of a disruptive event, such as a large-scale migration,
on operations and enables a business to resume operations quickly.
B 57

AWS Prescriptive Guidance Monitoring and alerting tools and best practices for Amazon RDS for
MySQL and MariaDB
C
CAF
See AWS Cloud Adoption Framework.
canary deployment
The slow and incremental release of a version to end users. When you are confident, you deploy
the new version and replace the current version in its entirety.
CCoE
See Cloud Center of Excellence.
CDC
See change data capture.
change data capture (CDC)
The process of tracking changes to a data source, such as a database table, and recording
metadata about the change. You can use CDC for various purposes, such as auditing or
replicating changes in a target system to maintain synchronization.
chaos engineering
Intentionally introducing failures or disruptive events to test a system’s resilience. You can use
AWS Fault Injection Service (AWS FIS) to perform experiments that stress your AWS workloads
and evaluate their response.
CI/CD
See continuous integration and continuous delivery.
classification
A categorization process that helps generate predictions. ML models for classification problems
predict a discrete value. Discrete values are always distinct from one another. For example, a
model might need to evaluate whether or not there is a car in an image.
client-side encryption
Encryption of data locally, before the target AWS service receives it.
C 58

AWS Prescriptive Guidance Monitoring and alerting tools and best practices for Amazon RDS for
MySQL and MariaDB
Cloud Center of Excellence (CCoE)
A multi-disciplinary team that drives cloud adoption efforts across an organization, including
developing cloud best practices, mobilizing resources, establishing migration timelines, and
leading the organization through large-scale transformations. For more information, see the
CCoE posts on the AWS Cloud Enterprise Strategy Blog.
cloud computing
The cloud technology that is typically used for remote data storage and IoT device
management. Cloud computing is commonly connected to edge computing technology.
cloud operating model
In an IT organization, the operating model that is used to build, mature, and optimize one or
more cloud environments. For more information, see Building your Cloud Operating Model.
cloud stages of adoption
The four phases that organizations typically go through when they migrate to the AWS Cloud:
• Project – Running a few cloud-related projects for proof of concept and learning purposes
• Foundation – Making foundational investments to scale your cloud adoption (e.g., creating a
landing zone, defining a CCoE, establishing an operations model)
• Migration – Migrating individual applications
• Re-invention – Optimizing products and services, and innovating in the cloud
These stages were defined by Stephen Orban in the blog post The Journey Toward Cloud-First
& the Stages of Adoption on the AWS Cloud Enterprise Strategy blog. For information about
how they relate to the AWS migration strategy, see the migration readiness guide.
CMDB
See configuration management database.
code repository
A location where source code and other assets, such as documentation, samples, and scripts,
are stored and updated through version control processes. Common cloud repositories include
GitHub or AWS CodeCommit. Each version of the code is called a branch. In a microservice
structure, each repository is devoted to a single piece of functionality. A single CI/CD pipeline
can use multiple repositories.
C 59

AWS Prescriptive Guidance Monitoring and alerting tools and best practices for Amazon RDS for
MySQL and MariaDB
cold cache
A buffer cache that is empty, not well populated, or contains stale or irrelevant data. This
affects performance because the database instance must read from the main memory or disk,
which is slower than reading from the buffer cache.
cold data
Data that is rarely accessed and is typically historical. When querying this kind of data, slow
queries are typically acceptable. Moving this data to lower-performing and less expensive
storage tiers or classes can reduce costs.
computer vision (CV)
A field of AI that uses machine learning to analyze and extract information from visual formats
such as digital images and videos. For example, AWS Panorama offers devices that add CV to
on-premises camera networks, and Amazon SageMaker provides image processing algorithms
for CV.
configuration drift
For a workload, a configuration change from the expected state. It might cause the workload to
become noncompliant, and it's typically gradual and unintentional.
configuration management database (CMDB)
A repository that stores and manages information about a database and its IT environment,
including both hardware and software components and their configurations. You typically use
data from a CMDB in the portfolio discovery and analysis stage of migration.
conformance pack
A collection of AWS Config rules and remediation actions that you can assemble to customize
your compliance and security checks. You can deploy a conformance pack as a single entity in
an AWS account and Region, or across an organization, by using a YAML template. For more
information, see Conformance packs in the AWS Config documentation.
continuous integration and continuous delivery (CI/CD)
The process of automating the source, build, test, staging, and production stages of the
software release process. CI/CD is commonly described as a pipeline. CI/CD can help you
automate processes, improve productivity, improve code quality, and deliver faster. For more
information, see Benefits of continuous delivery. CD can also stand for continuous deployment.
For more information, see Continuous Delivery vs. Continuous Deployment.
C 60

AWS Prescriptive Guidance Monitoring and alerting tools and best practices for Amazon RDS for
MySQL and MariaDB
CV
See computer vision.
D
data at rest
Data that is stationary in your network, such as data that is in storage.
data classification
A process for identifying and categorizing the data in your network based on its criticality and
sensitivity. It is a critical component of any cybersecurity risk management strategy because
it helps you determine the appropriate protection and retention controls for the data. Data
classification is a component of the security pillar in the AWS Well-Architected Framework. For
more information, see Data classification.
data drift
A meaningful variation between the production data and the data that was used to train an ML
model, or a meaningful change in the input data over time. Data drift can reduce the overall
quality, accuracy, and fairness in ML model predictions.
data in transit
Data that is actively moving through your network, such as between network resources.
data mesh
An architectural framework that provides distributed, decentralized data ownership with
centralized management and governance.
data minimization
The principle of collecting and processing only the data that is strictly necessary. Practicing
data minimization in the AWS Cloud can reduce privacy risks, costs, and your analytics carbon
footprint.
data perimeter
A set of preventive guardrails in your AWS environment that help make sure that only trusted
identities are accessing trusted resources from expected networks. For more information, see
Building a data perimeter on AWS.
D 61

AWS Prescriptive Guidance Monitoring and alerting tools and best practices for Amazon RDS for
MySQL and MariaDB
data preprocessing
To transform raw data into a format that is easily parsed by your ML model. Preprocessing data
can mean removing certain columns or rows and addressing missing, inconsistent, or duplicate
values.
data provenance
The process of tracking the origin and history of data throughout its lifecycle, such as how the
data was generated, transmitted, and stored.
data subject
An individual whose data is being collected and processed.
data warehouse
A data management system that supports business intelligence, such as analytics. Data
warehouses commonly contain large amounts of historical data, and they are typically used for
queries and analysis.
database definition language (DDL)
Statements or commands for creating or modifying the structure of tables and objects in a
database.
database manipulation language (DML)
Statements or commands for modifying (inserting, updating, and deleting) information in a
database.
DDL
See database definition language.
deep ensemble
To combine multiple deep learning models for prediction. You can use deep ensembles to
obtain a more accurate prediction or for estimating uncertainty in predictions.
deep learning
An ML subfield that uses multiple layers of artificial neural networks to identify mapping
between input data and target variables of interest.
D 62

AWS Prescriptive Guidance Monitoring and alerting tools and best practices for Amazon RDS for
MySQL and MariaDB
defense-in-depth
An information security approach in which a series of security mechanisms and controls are
thoughtfully layered throughout a computer network to protect the confidentiality, integrity,
and availability of the network and the data within. When you adopt this strategy on AWS,
you add multiple controls at different layers of the AWS Organizations structure to help
secure resources. For example, a defense-in-depth approach might combine multi-factor
authentication, network segmentation, and encryption.
delegated administrator
In AWS Organizations, a compatible service can register an AWS member account to administer
the organization’s accounts and manage permissions for that service. This account is called the
delegated administrator for that service. For more information and a list of compatible services,
see Services that work with AWS Organizations in the AWS Organizations documentation.
deployment
The process of making an application, new features, or code fixes available in the target
environment. Deployment involves implementing changes in a code base and then building and
running that code base in the application’s environments.
development environment
See environment.
detective control
A security control that is designed to detect, log, and alert after an event has occurred.
These controls are a second line of defense, alerting you to security events that bypassed the
preventative controls in place. For more information, see Detective controls in Implementing
security controls on AWS.
development value stream mapping (DVSM)
A process used to identify and prioritize constraints that adversely affect speed and quality in
a software development lifecycle. DVSM extends the value stream mapping process originally
designed for lean manufacturing practices. It focuses on the steps and teams required to create
and move value through the software development process.
D 63

AWS Prescriptive Guidance Monitoring and alerting tools and best practices for Amazon RDS for
MySQL and MariaDB
digital twin
A virtual representation of a real-world system, such as a building, factory, industrial
equipment, or production line. Digital twins support predictive maintenance, remote
monitoring, and production optimization.
dimension table
In a star schema, a smaller table that contains data attributes about quantitative data in a
fact table. Dimension table attributes are typically text fields or discrete numbers that behave
like text. These attributes are commonly used for query constraining, filtering, and result set
labeling.
disaster
An event that prevents a workload or system from fulfilling its business objectives in its primary
deployed location. These events can be natural disasters, technical failures, or the result of
human actions, such as unintentional misconfiguration or a malware attack.
disaster recovery (DR)
The strategy and process you use to minimize downtime and data loss caused by a disaster. For
more information, see Disaster Recovery of Workloads on AWS: Recovery in the Cloud in the
AWS Well-Architected Framework.
DML
See database manipulation language.
domain-driven design
An approach to developing a complex software system by connecting its components to
evolving domains, or core business goals, that each component serves. This concept was
introduced by Eric Evans in his book, Domain-Driven Design: Tackling Complexity in the Heart of
Software (Boston: Addison-Wesley Professional,2003). For information about how you can use
domain-driven design with the strangler fig pattern, see Modernizing legacy Microsoft ASP.NET
(ASMX) web services incrementally by using containers and Amazon API Gateway.
DR
See disaster recovery.
D 64

AWS Prescriptive Guidance Monitoring and alerting tools and best practices for Amazon RDS for
MySQL and MariaDB
drift detection
Tracking deviations from a baselined configuration. For example, you can use AWS
CloudFormation to detect drift in system resources, or you can use AWS Control Tower to detect
changes in your landing zone that might affect compliance with governance requirements.
DVSM
See development value stream mapping.
E
EDA
See exploratory data analysis.
edge computing
The technology that increases the computing power for smart devices at the edges of an IoT
network. When compared with cloud computing, edge computing can reduce communication
latency and improve response time.
encryption
A computing process that transforms plaintext data, which is human-readable, into ciphertext.
encryption key
A cryptographic string of randomized bits that is generated by an encryption algorithm. Keys
can vary in length, and each key is designed to be unpredictable and unique.
endianness
The order in which bytes are stored in computer memory. Big-endian systems store the most
significant byte first. Little-endian systems store the least significant byte first.
endpoint
See service endpoint.
endpoint service
A service that you can host in a virtual private cloud (VPC) to share with other users. You can
create an endpoint service with AWS PrivateLink and grant permissions to other AWS accounts
E 65

AWS Prescriptive Guidance Monitoring and alerting tools and best practices for Amazon RDS for
MySQL and MariaDB
or to AWS Identity and Access Management (IAM) principals. These accounts or principals
can connect to your endpoint service privately by creating interface VPC endpoints. For more
information, see Create an endpoint service in the Amazon Virtual Private Cloud (Amazon VPC)
documentation.
enterprise resource planning (ERP)
A system that automates and manages key business processes (such as accounting, MES, and
project management) for an enterprise.
envelope encryption
The process of encrypting an encryption key with another encryption key. For more
information, see Envelope encryption in the AWS Key Management Service (AWS KMS)
documentation.
environment
An instance of a running application. The following are common types of environments in cloud
computing:
• development environment – An instance of a running application that is available only to the
core team responsible for maintaining the application. Development environments are used
to test changes before promoting them to upper environments. This type of environment is
sometimes referred to as a test environment.
• lower environments – All development environments for an application, such as those used
for initial builds and tests.
• production environment – An instance of a running application that end users can access. In a
CI/CD pipeline, the production environment is the last deployment environment.
• upper environments – All environments that can be accessed by users other than the core
development team. This can include a production environment, preproduction environments,
and environments for user acceptance testing.
epic
In agile methodologies, functional categories that help organize and prioritize your work. Epics
provide a high-level description of requirements and implementation tasks. For example, AWS
CAF security epics include identity and access management, detective controls, infrastructure
security, data protection, and incident response. For more information about epics in the AWS
migration strategy, see the program implementation guide.
E 66

AWS Prescriptive Guidance Monitoring and alerting tools and best practices for Amazon RDS for
MySQL and MariaDB
ERP
See enterprise resource planning.
exploratory data analysis (EDA)
The process of analyzing a dataset to understand its main characteristics. You collect or
aggregate data and then perform initial investigations to find patterns, detect anomalies,
and check assumptions. EDA is performed by calculating summary statistics and creating data
visualizations.
F
fact table
The central table in a star schema. It stores quantitative data about business operations.
Typically, a fact table contains two types of columns: those that contain measures and those
that contain a foreign key to a dimension table.
fail fast
A philosophy that uses frequent and incremental testing to reduce the development lifecycle. It
is a critical part of an agile approach.
fault isolation boundary
In the AWS Cloud, a boundary such as an Availability Zone, AWS Region, control plane, or data
plane that limits the effect of a failure and helps improve the resilience of workloads. For more
information, see AWS Fault Isolation Boundaries.
feature branch
See branch.
features
The input data that you use to make a prediction. For example, in a manufacturing context,
features could be images that are periodically captured from the manufacturing line.
feature importance
How significant a feature is for a model’s predictions. This is usually expressed as a numerical
score that can be calculated through various techniques, such as Shapley Additive Explanations
F 67

AWS Prescriptive Guidance Monitoring and alerting tools and best practices for Amazon RDS for
MySQL and MariaDB
(SHAP) and integrated gradients. For more information, see Machine learning model
interpretability with :AWS.
feature transformation
To optimize data for the ML process, including enriching data with additional sources, scaling
values, or extracting multiple sets of information from a single data field. This enables the ML
model to benefit from the data. For example, if you break down the “2021-05-27 00:15:37”
date into “2021”, “May”, “Thu”, and “15”, you can help the learning algorithm learn nuanced
patterns associated with different data components.
FGAC
See fine-grained access control.
fine-grained access control (FGAC)
The use of multiple conditions to allow or deny an access request.
flash-cut migration
A database migration method that uses continuous data replication through change data
capture to migrate data in the shortest time possible, instead of using a phased approach. The
objective is to keep downtime to a minimum.
G
geo blocking
See geographic restrictions.
geographic restrictions (geo blocking)
In Amazon CloudFront, an option to prevent users in specific countries from accessing content
distributions. You can use an allow list or block list to specify approved and banned countries.
For more information, see Restricting the geographic distribution of your content in the
CloudFront documentation.
Gitflow workflow
An approach in which lower and upper environments use different branches in a source code
repository. The Gitflow workflow is considered legacy, and the trunk-based workflow is the
modern, preferred approach.
G 68

AWS Prescriptive Guidance Monitoring and alerting tools and best practices for Amazon RDS for
MySQL and MariaDB
greenfield strategy
The absence of existing infrastructure in a new environment. When adopting a greenfield
strategy for a system architecture, you can select all new technologies without the restriction
of compatibility with existing infrastructure, also known as brownfield. If you are expanding the
existing infrastructure, you might blend brownfield and greenfield strategies.
guardrail
A high-level rule that helps govern resources, policies, and compliance across organizational
units (OUs). Preventive guardrails enforce policies to ensure alignment to compliance standards.
They are implemented by using service control policies and IAM permissions boundaries.
Detective guardrails detect policy violations and compliance issues, and generate alerts
for remediation. They are implemented by using AWS Config, AWS Security Hub, Amazon
GuardDuty, AWS Trusted Advisor, Amazon Inspector, and custom AWS Lambda checks.
H
HA
See high availability.
heterogeneous database migration
Migrating your source database to a target database that uses a different database engine
(for example, Oracle to Amazon Aurora). Heterogeneous migration is typically part of a re-
architecting effort, and converting the schema can be a complex task. AWS provides AWS SCT
that helps with schema conversions.
high availability (HA)
The ability of a workload to operate continuously, without intervention, in the event of
challenges or disasters. HA systems are designed to automatically fail over, consistently deliver
high-quality performance, and handle different loads and failures with minimal performance
impact.
historian modernization
An approach used to modernize and upgrade operational technology (OT) systems to better
serve the needs of the manufacturing industry. A historian is a type of database that is used to
collect and store data from various sources in a factory.
H 69

AWS Prescriptive Guidance Monitoring and alerting tools and best practices for Amazon RDS for
MySQL and MariaDB
homogeneous database migration
Migrating your source database to a target database that shares the same database engine
(for example, Microsoft SQL Server to Amazon RDS for SQL Server). Homogeneous migration
is typically part of a rehosting or replatforming effort. You can use native database utilities to
migrate the schema.
hot data
Data that is frequently accessed, such as real-time data or recent translational data. This data
typically requires a high-performance storage tier or class to provide fast query responses.
hotfix
An urgent fix for a critical issue in a production environment. Due to its urgency, a hotfix is
usually made outside of the typical DevOps release workflow.
hypercare period
Immediately following cutover, the period of time when a migration team manages and
monitors the migrated applications in the cloud in order to address any issues. Typically, this
period is 1–4 days in length. At the end of the hypercare period, the migration team typically
transfers responsibility for the applications to the cloud operations team.
I
IaC
See infrastructure as code.
identity-based policy
A policy attached to one or more IAM principals that defines their permissions within the AWS
Cloud environment.
idle application
An application that has an average CPU and memory usage between 5and 20percent over
a period of 90days. In a migration project, it is common to retire these applications or retain
them on premises.
IIoT
See industrial Internet of Things.
I 70

AWS Prescriptive Guidance Monitoring and alerting tools and best practices for Amazon RDS for
MySQL and MariaDB
immutable infrastructure
A model that deploys new infrastructure for production workloads instead of updating,
patching, or modifying the existing infrastructure. Immutable infrastructures are inherently
more consistent, reliable, and predictable than mutable infrastructure. For more information,
see the Deploy using immutable infrastructure best practice in the AWS Well-Architected
Framework.
inbound (ingress) VPC
In an AWS multi-account architecture, a VPC that accepts, inspects, and routes network
connections from outside an application. The AWS Security Reference Architecture recommends
setting up your Network account with inbound, outbound, and inspection VPCs to protect the
two-way interface between your application and the broader internet.
incremental migration
A cutover strategy in which you migrate your application in small parts instead of performing
a single, full cutover. For example, you might move only a few microservices or users to the
new system initially. After you verify that everything is working properly, you can incrementally
move additional microservices or users until you can decommission your legacy system. This
strategy reduces the risks associated with large migrations.
Industry 4.0
A term that was introduced by Klaus Schwab in 2016 to refer to the modernization of
manufacturing processes through advances in connectivity, real-time data, automation,
analytics, and AI/ML.
infrastructure
All of the resources and assets contained within an application’s environment.
infrastructure as code (IaC)
The process of provisioning and managing an application’s infrastructure through a set
of configuration files. IaC is designed to help you centralize infrastructure management,
standardize resources, and scale quickly so that new environments are repeatable, reliable, and
consistent.
I 71

AWS Prescriptive Guidance Monitoring and alerting tools and best practices for Amazon RDS for
MySQL and MariaDB
industrial Internet of Things (IIoT)
The use of internet-connected sensors and devices in the industrial sectors, such as
manufacturing, energy, automotive, healthcare, life sciences, and agriculture. For more
information, see Building an industrial Internet of Things (IIoT) digital transformation strategy.
inspection VPC
In an AWS multi-account architecture, a centralized VPC that manages inspections of network
traffic between VPCs (in the same or different AWS Regions), the internet, and on-premises
networks. The AWS Security Reference Architecture recommends setting up your Network
account with inbound, outbound, and inspection VPCs to protect the two-way interface
between your application and the broader internet.
Internet of Things (IoT)
The network of connected physical objects with embedded sensors or processors that
communicate with other devices and systems through the internet or over a local
communication network. For more information, see What is IoT?
interpretability
A characteristic of a machine learning model that describes the degree to which a human
can understand how the model’s predictions depend on its inputs. For more information, see
Machine learning model interpretability with AWS.
IoT
See Internet of Things.
IT information library (ITIL)
A set of best practices for delivering IT services and aligning these services with business
requirements. ITIL provides the foundation for ITSM.
IT service management (ITSM)
Activities associated with designing, implementing, managing, and supporting IT services for
an organization. For information about integrating cloud operations with ITSM tools, see the
operations integration guide.
ITIL
See IT information library.
I 72

AWS Prescriptive Guidance Monitoring and alerting tools and best practices for Amazon RDS for
MySQL and MariaDB
ITSM
See IT service management.
L
label-based access control (LBAC)
An implementation of mandatory access control (MAC) where the users and the data itself are
each explicitly assigned a security label value. The intersection between the user security label
and data security label determines which rows and columns can be seen by the user.
landing zone
A landing zone is a well-architected, multi-account AWS environment that is scalable and
secure. This is a starting point from which your organizations can quickly launch and deploy
workloads and applications with confidence in their security and infrastructure environment.
For more information about landing zones, see Setting up a secure and scalable multi-account
AWS environment.
large migration
A migration of 300or more servers.
LBAC
See label-based access control.
least privilege
The security best practice of granting the minimum permissions required to perform a task. For
more information, see Apply least-privilege permissions in the IAM documentation.
lift and shift
See 7 Rs.
little-endian system
A system that stores the least significant byte first. See also endianness.
lower environments
See environment.
L 73

AWS Prescriptive Guidance Monitoring and alerting tools and best practices for Amazon RDS for
MySQL and MariaDB
M
machine learning (ML)
A type of artificial intelligence that uses algorithms and techniques for pattern recognition and
learning. ML analyzes and learns from recorded data, such as Internet of Things (IoT) data, to
generate a statistical model based on patterns. For more information, see Machine Learning.
main branch
See branch.
malware
Software that is designed to compromise computer security or privacy. Malware might disrupt
computer systems, leak sensitive information, or gain unauthorized access. Examples of
malware include viruses, worms, ransomware, Trojan horses, spyware, and keyloggers.
managed services
AWS services for which AWS operates the infrastructure layer, the operating system, and
platforms, and you access the endpoints to store and retrieve data. Amazon Simple Storage
Service (Amazon S3) and Amazon DynamoDB are examples of managed services. These are also
known as abstracted services.
manufacturing execution system (MES)
A software system for tracking, monitoring, documenting, and controlling production processes
that convert raw materials to finished products on the shop floor.
MAP
See Migration Acceleration Program.
mechanism
A complete process in which you create a tool, drive adoption of the tool, and then inspect the
results in order to make adjustments. A mechanism is a cycle that reinforces and improves itself
as it operates. For more information, see Building mechanisms in the AWS Well-Architected
Framework.
member account
All AWS accounts other than the management account that are part of an organization in AWS
Organizations. An account can be a member of only one organization at a time.
M 74

AWS Prescriptive Guidance Monitoring and alerting tools and best practices for Amazon RDS for
MySQL and MariaDB
MES
See manufacturing execution system.
Message Queuing Telemetry Transport (MQTT)
A lightweight, machine-to-machine (M2M) communication protocol, based on the publish/
subscribe pattern, for resource-constrained IoT devices.
microservice
A small, independent service that communicates over well-defined APIs and is typically
owned by small, self-contained teams. For example, an insurance system might include
microservices that map to business capabilities, such as sales or marketing, or subdomains,
such as purchasing, claims, or analytics. The benefits of microservices include agility, flexible
scaling, easy deployment, reusable code, and resilience. For more information, see Integrating
microservices by using AWS serverless services.
microservices architecture
An approach to building an application with independent components that run each application
process as a microservice. These microservices communicate through a well-defined interface
by using lightweight APIs. Each microservice in this architecture can be updated, deployed,
and scaled to meet demand for specific functions of an application. For more information, see
Implementing microservices on AWS.
Migration Acceleration Program (MAP)
An AWS program that provides consulting support, training, and services to help organizations
build a strong operational foundation for moving to the cloud, and to help offset the initial
cost of migrations. MAP includes a migration methodology for executing legacy migrations in a
methodical way and a set of tools to automate and accelerate common migration scenarios.
migration at scale
The process of moving the majority of the application portfolio to the cloud in waves, with
more applications moved at a faster rate in each wave. This phase uses the best practices and
lessons learned from the earlier phases to implement a migration factory of teams, tools, and
processes to streamline the migration of workloads through automation and agile delivery. This
is the third phase of the AWS migration strategy.
M 75

AWS Prescriptive Guidance Monitoring and alerting tools and best practices for Amazon RDS for
MySQL and MariaDB
migration factory
Cross-functional teams that streamline the migration of workloads through automated, agile
approaches. Migration factory teams typically include operations, business analysts and owners,
migration engineers, developers, and DevOps professionals working in sprints. Between 20
and 50 percent of an enterprise application portfolio consists of repeated patterns that can
be optimized by a factory approach. For more information, see the discussion of migration
factories and the Cloud Migration Factory guide in this content set.
migration metadata
The information about the application and server that is needed to complete the migration.
Each migration pattern requires a different set of migration metadata. Examples of migration
metadata include the target subnet, security group, and AWS account.
migration pattern
A repeatable migration task that details the migration strategy, the migration destination, and
the migration application or service used. Example: Rehost migration to Amazon EC2 with AWS
Application Migration Service.
Migration Portfolio Assessment (MPA)
An online tool that provides information for validating the business case for migrating to
the AWS Cloud. MPA provides detailed portfolio assessment (server right-sizing, pricing, TCO
comparisons, migration cost analysis) as well as migration planning (application data analysis
and data collection, application grouping, migration prioritization, and wave planning). The
MPA tool (requires login) is available free of charge to all AWS consultants and APN Partner
consultants.
Migration Readiness Assessment (MRA)
The process of gaining insights about an organization’s cloud readiness status, identifying
strengths and weaknesses, and building an action plan to close identified gaps, using the AWS
CAF. For more information, see the migration readiness guide. MRA is the first phase of the AWS
migration strategy.
migration strategy
The approach used to migrate a workload to the AWS Cloud. For more information, see the 7 Rs
entry in this glossary and see Mobilize your organization to accelerate large-scale migrations.
M 76

AWS Prescriptive Guidance Monitoring and alerting tools and best practices for Amazon RDS for
MySQL and MariaDB
ML
See machine learning.
modernization
Transforming an outdated (legacy or monolithic) application and its infrastructure into an agile,
elastic, and highly available system in the cloud to reduce costs, gain efficiencies, and take
advantage of innovations. For more information, see Strategy for modernizing applications in
the AWS Cloud.
modernization readiness assessment
An evaluation that helps determine the modernization readiness of an organization’s
applications; identifies benefits, risks, and dependencies; and determines how well the
organization can support the future state of those applications. The outcome of the assessment
is a blueprint of the target architecture, a roadmap that details development phases and
milestones for the modernization process, and an action plan for addressing identified gaps. For
more information, see Evaluating modernization readiness for applications in the AWS Cloud.
monolithic applications (monoliths)
Applications that run as a single service with tightly coupled processes. Monolithic applications
have several drawbacks. If one application feature experiences a spike in demand, the
entire architecture must be scaled. Adding or improving a monolithic application’s features
also becomes more complex when the code base grows. To address these issues, you can
use a microservices architecture. For more information, see Decomposing monoliths into
microservices.
MPA
See Migration Portfolio Assessment.
MQTT
See Message Queuing Telemetry Transport.
multiclass classification
A process that helps generate predictions for multiple classes (predicting one of more than
two outcomes). For example, an ML model might ask "Is this product a book, car, or phone?" or
"Which product category is most interesting to this customer?"
M 77

AWS Prescriptive Guidance Monitoring and alerting tools and best practices for Amazon RDS for
MySQL and MariaDB
mutable infrastructure
A model that updates and modifies the existing infrastructure for production workloads. For
improved consistency, reliability, and predictability, the AWS Well-Architected Framework
recommends the use of immutable infrastructure as a best practice.
O
OAC
See origin access control.
OAI
See origin access identity.
OCM
See organizational change management.
offline migration
A migration method in which the source workload is taken down during the migration process.
This method involves extended downtime and is typically used for small, non-critical workloads.
OI
See operations integration.
OLA
See operational-level agreement.
online migration
A migration method in which the source workload is copied to the target system without being
taken offline. Applications that are connected to the workload can continue to function during
the migration. This method involves zero to minimal downtime and is typically used for critical
production workloads.
OPC-UA
See Open Process Communications - Unified Architecture.
O 78

AWS Prescriptive Guidance Monitoring and alerting tools and best practices for Amazon RDS for
MySQL and MariaDB
Open Process Communications - Unified Architecture (OPC-UA)
A machine-to-machine (M2M) communication protocol for industrial automation. OPC-UA
provides an interoperability standard with data encryption, authentication, and authorization
schemes.
operational-level agreement (OLA)
An agreement that clarifies what functional IT groups promise to deliver to each other, to
support a service-level agreement (SLA).
operational readiness review (ORR)
A checklist of questions and associated best practices that help you understand, evaluate,
prevent, or reduce the scope of incidents and possible failures. For more information, see
Operational Readiness Reviews (ORR) in the AWS Well-Architected Framework.
operational technology (OT)
Hardware and software systems that work with the physical environment to control industrial
operations, equipment, and infrastructure. In manufacturing, the integration of OT and
information technology (IT) systems is a key focus for Industry 4.0 transformations.
operations integration (OI)
The process of modernizing operations in the cloud, which involves readiness planning,
automation, and integration. For more information, see the operations integration guide.
organization trail
A trail that’s created by AWS CloudTrail that logs all events for all AWS accounts in an
organization in AWS Organizations. This trail is created in each AWS account that’s part of the
organization and tracks the activity in each account. For more information, see Creating a trail
for an organization in the CloudTrail documentation.
organizational change management (OCM)
A framework for managing major, disruptive business transformations from a people, culture,
and leadership perspective. OCM helps organizations prepare for, and transition to, new
systems and strategies by accelerating change adoption, addressing transitional issues, and
driving cultural and organizational changes. In the AWS migration strategy, this framework is
called people acceleration, because of the speed of change required in cloud adoption projects.
For more information, see the OCM guide.
O 79

AWS Prescriptive Guidance Monitoring and alerting tools and best practices for Amazon RDS for
MySQL and MariaDB
origin access control (OAC)
In CloudFront, an enhanced option for restricting access to secure your Amazon Simple Storage
Service (Amazon S3) content. OAC supports all S3 buckets in all AWS Regions, server-side
encryption with AWS KMS (SSE-KMS), and dynamic PUT and DELETE requests to the S3 bucket.
origin access identity (OAI)
In CloudFront, an option for restricting access to secure your Amazon S3 content. When you
use OAI, CloudFront creates a principal that Amazon S3 can authenticate with. Authenticated
principals can access content in an S3 bucket only through a specific CloudFront distribution.
See also OAC, which provides more granular and enhanced access control.
ORR
See operational readiness review.
OT
See operational technology.
outbound (egress) VPC
In an AWS multi-account architecture, a VPC that handles network connections that are
initiated from within an application. The AWS Security Reference Architecture recommends
setting up your Network account with inbound, outbound, and inspection VPCs to protect the
two-way interface between your application and the broader internet.
P
permissions boundary
An IAM management policy that is attached to IAM principals to set the maximum permissions
that the user or role can have. For more information, see Permissions boundaries in the IAM
documentation.
personally identifiable information (PII)
Information that, when viewed directly or paired with other related data, can be used to
reasonably infer the identity of an individual. Examples of PII include names, addresses, and
contact information.
P 80

AWS Prescriptive Guidance Monitoring and alerting tools and best practices for Amazon RDS for
MySQL and MariaDB
PII
See personally identifiable information.
playbook
A set of predefined steps that capture the work associated with migrations, such as delivering
core operations functions in the cloud. A playbook can take the form of scripts, automated
runbooks, or a summary of processes or steps required to operate your modernized
environment.
PLC
See programmable logic controller.
PLM
See product lifecycle management.
policy
An object that can define permissions (see identity-based policy), specify access conditions (see
resource-based policy), or define the maximum permissions for all accounts in an organization
in AWS Organizations (see service control policy).
polyglot persistence
Independently choosing a microservice’s data storage technology based on data access patterns
and other requirements. If your microservices have the same data storage technology, they can
encounter implementation challenges or experience poor performance. Microservices are more
easily implemented and achieve better performance and scalability if they use the data store
best adapted to their requirements. For more information, see Enabling data persistence in
microservices.
portfolio assessment
A process of discovering, analyzing, and prioritizing the application portfolio in order to plan
the migration. For more information, see Evaluating migration readiness.
predicate
A query condition that returns true or false, commonly located in a WHERE clause.
P 81

AWS Prescriptive Guidance Monitoring and alerting tools and best practices for Amazon RDS for
MySQL and MariaDB
predicate pushdown
A database query optimization technique that filters the data in the query before transfer. This
reduces the amount of data that must be retrieved and processed from the relational database,
and it improves query performance.
preventative control
A security control that is designed to prevent an event from occurring. These controls are a first
line of defense to help prevent unauthorized access or unwanted changes to your network. For
more information, see Preventative controls in Implementing security controls on AWS.
principal
An entity in AWS that can perform actions and access resources. This entity is typically a root
user for an AWS account, an IAM role, or a user. For more information, see Principal in Roles
terms and concepts in the IAM documentation.
Privacy by Design
An approach in system engineering that takes privacy into account throughout the whole
engineering process.
private hosted zones
A container that holds information about how you want Amazon Route53 to respond to DNS
queries for a domain and its subdomains within one or more VPCs. For more information, see
Working with private hosted zones in the Route53 documentation.
proactive control
A security control designed to prevent the deployment of noncompliant resources. These
controls scan resources before they are provisioned. If the resource is not compliant with the
control, then it isn't provisioned. For more information, see the Controls reference guide in the
AWS Control Tower documentation and see Proactive controls in Implementing security controls
on AWS.
product lifecycle management (PLM)
The management of data and processes for a product throughout its entire lifecycle, from
design, development, and launch, through growth and maturity, to decline and removal.
production environment
See environment.
P 82

AWS Prescriptive Guidance Monitoring and alerting tools and best practices for Amazon RDS for
MySQL and MariaDB
programmable logic controller (PLC)
In manufacturing, a highly reliable, adaptable computer that monitors machines and automates
manufacturing processes.
pseudonymization
The process of replacing personal identifiers in a dataset with placeholder values.
Pseudonymization can help protect personal privacy. Pseudonymized data is still considered to
be personal data.
publish/subscribe (pub/sub)
A pattern that enables asynchronous communications among microservices to improve
scalability and responsiveness. For example, in a microservices-based MES, a microservice can
publish event messages to a channel that other microservices can subscribe to. The system can
add new microservices without changing the publishing service.
Q
query plan
A series of steps, like instructions, that are used to access the data in a SQL relational database
system.
query plan regression
When a database service optimizer chooses a less optimal plan than it did before a given
change to the database environment. This can be caused by changes to statistics, constraints,
environment settings, query parameter bindings, and updates to the database engine.
R
RACI matrix
See responsible, accountable, consulted, informed (RACI).
ransomware
A malicious software that is designed to block access to a computer system or data until a
payment is made.
Q 83

AWS Prescriptive Guidance Monitoring and alerting tools and best practices for Amazon RDS for
MySQL and MariaDB
RASCI matrix
See responsible, accountable, consulted, informed (RACI).
RCAC
See row and column access control.
read replica
A copy of a database that’s used for read-only purposes. You can route queries to the read
replica to reduce the load on your primary database.
re-architect
See 7 Rs.
recovery point objective (RPO)
The maximum acceptable amount of time since the last data recovery point. This determines
what is considered an acceptable loss of data between the last recovery point and the
interruption of service.
recovery time objective (RTO)
The maximum acceptable delay between the interruption of service and restoration of service.
refactor
See 7 Rs.
Region
A collection of AWS resources in a geographic area. Each AWS Region is isolated and
independent of the others to provide fault tolerance, stability, and resilience. For more
information, see Specify which AWS Regions your account can use.
regression
An ML technique that predicts a numeric value. For example, to solve the problem of "What
price will this house sell for?" an ML model could use a linear regression model to predict a
house's sale price based on known facts about the house (for example, the square footage).
rehost
See 7 Rs.
R 84

AWS Prescriptive Guidance Monitoring and alerting tools and best practices for Amazon RDS for
MySQL and MariaDB
release
In a deployment process, the act of promoting changes to a production environment.
relocate
See 7 Rs.
replatform
See 7 Rs.
repurchase
See 7 Rs.
resiliency
An application's ability to resist or recover from disruptions. High availability and disaster
recovery are common considerations when planning for resiliency in the AWS Cloud. For more
information, see AWS Cloud Resilience.
resource-based policy
A policy attached to a resource, such as an Amazon S3 bucket, an endpoint, or an encryption
key. This type of policy specifies which principals are allowed access, supported actions, and any
other conditions that must be met.
responsible, accountable, consulted, informed (RACI) matrix
A matrix that defines the roles and responsibilities for all parties involved in migration activities
and cloud operations. The matrix name is derived from the responsibility types defined in the
matrix: responsible (R), accountable (A), consulted (C), and informed (I). The support (S) type
is optional. If you include support, the matrix is called a RASCI matrix, and if you exclude it, it’s
called a RACI matrix.
responsive control
A security control that is designed to drive remediation of adverse events or deviations from
your security baseline. For more information, see Responsive controls in Implementing security
controls on AWS.
retain
See 7 Rs.
R 85

AWS Prescriptive Guidance Monitoring and alerting tools and best practices for Amazon RDS for
MySQL and MariaDB
retire
See 7 Rs.
rotation
The process of periodically updating a secret to make it more difficult for an attacker to access
the credentials.
row and column access control (RCAC)
The use of basic, flexible SQL expressions that have defined access rules. RCAC consists of row
permissions and column masks.
RPO
See recovery point objective.
RTO
See recovery time objective.
runbook
A set of manual or automated procedures required to perform a specific task. These are
typically built to streamline repetitive operations or procedures with high error rates.
S
SAML 2.0
An open standard that many identity providers (IdPs) use. This feature enables federated
single sign-on (SSO), so users can log into the AWS Management Console or call the AWS API
operations without you having to create user in IAM for everyone in your organization. For more
information about SAML 2.0-based federation, see About SAML 2.0-based federation in the IAM
documentation.
SCADA
See supervisory control and data acquisition.
SCP
See service control policy.
S 86

AWS Prescriptive Guidance Monitoring and alerting tools and best practices for Amazon RDS for
MySQL and MariaDB
secret
In AWS Secrets Manager, confidential or restricted information, such as a password or user
credentials, that you store in encrypted form. It consists of the secret value and its metadata.
The secret value can be binary, a single string, or multiple strings. For more information, see
What's in a Secrets Manager secret? in the Secrets Manager documentation.
security control
A technical or administrative guardrail that prevents, detects, or reduces the ability of a threat
actor to exploit a security vulnerability. There are four primary types of security controls:
preventative, detective, responsive, and proactive.
security hardening
The process of reducing the attack surface to make it more resistant to attacks. This can include
actions such as removing resources that are no longer needed, implementing the security best
practice of granting least privilege, or deactivating unnecessary features in configuration files.
security information and event management (SIEM) system
Tools and services that combine security information management (SIM) and security event
management (SEM) systems. A SIEM system collects, monitors, and analyzes data from servers,
networks, devices, and other sources to detect threats and security breaches, and to generate
alerts.
security response automation
A predefined and programmed action that is designed to automatically respond to or remediate
a security event. These automations serve as detective or responsive security controls that help
you implement AWS security best practices. Examples of automated response actions include
modifying a VPC security group, patching an Amazon EC2 instance, or rotating credentials.
server-side encryption
Encryption of data at its destination, by the AWS service that receives it.
service control policy (SCP)
A policy that provides centralized control over permissions for all accounts in an organization
in AWS Organizations. SCPs define guardrails or set limits on actions that an administrator can
delegate to users or roles. You can use SCPs as allow lists or deny lists, to specify which services
or actions are permitted or prohibited. For more information, see Service control policies in the
AWS Organizations documentation.
S 87

AWS Prescriptive Guidance Monitoring and alerting tools and best practices for Amazon RDS for
MySQL and MariaDB
service endpoint
The URL of the entry point for an AWS service. You can use the endpoint to connect
programmatically to the target service. For more information, see AWS service endpoints in
AWS General Reference.
service-level agreement (SLA)
An agreement that clarifies what an IT team promises to deliver to their customers, such as
service uptime and performance.
service-level indicator (SLI)
A measurement of a performance aspect of a service, such as its error rate, availability, or
throughput.
service-level objective (SLO)
A target metric that represents the health of a service, as measured by a service-level indicator.
shared responsibility model
A model describing the responsibility you share with AWS for cloud security and compliance.
AWS is responsible for security of the cloud, whereas you are responsible for security in the
cloud. For more information, see Shared responsibility model.
SIEM
See security information and event management system.
single point of failure (SPOF)
A failure in a single, critical component of an application that can disrupt the system.
SLA
See service-level agreement.
SLI
See service-level indicator.
SLO
See service-level objective.
S 88

AWS Prescriptive Guidance Monitoring and alerting tools and best practices for Amazon RDS for
MySQL and MariaDB
split-and-seed model
A pattern for scaling and accelerating modernization projects. As new features and product
releases are defined, the core team splits up to create new product teams. This helps scale your
organization’s capabilities and services, improves developer productivity, and supports rapid
innovation. For more information, see Phased approach to modernizing applications in the AWS
Cloud.
SPOF
See single point of failure.
star schema
A database organizational structure that uses one large fact table to store transactional or
measured data and uses one or more smaller dimensional tables to store data attributes. This
structure is designed for use in a data warehouse or for business intelligence purposes.
strangler fig pattern
An approach to modernizing monolithic systems by incrementally rewriting and replacing
system functionality until the legacy system can be decommissioned. This pattern uses the
analogy of a fig vine that grows into an established tree and eventually overcomes and replaces
its host. The pattern was introduced by Martin Fowler as a way to manage risk when rewriting
monolithic systems. For an example of how to apply this pattern, see Modernizing legacy
Microsoft ASP.NET (ASMX) web services incrementally by using containers and Amazon API
Gateway.
subnet
A range of IP addresses in your VPC. A subnet must reside in a single Availability Zone.
supervisory control and data acquisition (SCADA)
In manufacturing, a system that uses hardware and software to monitor physical assets and
production operations.
symmetric encryption
An encryption algorithm that uses the same key to encrypt and decrypt the data.
synthetic testing
Testing a system in a way that simulates user interactions to detect potential issues or to
monitor performance. You can use Amazon CloudWatch Synthetics to create these tests.
S 89

AWS Prescriptive Guidance Monitoring and alerting tools and best practices for Amazon RDS for
MySQL and MariaDB
T
tags
Key-value pairs that act as metadata for organizing your AWS resources. Tags can help you
manage, identify, organize, search for, and filter resources. For more information, see Tagging
your AWS resources.
target variable
The value that you are trying to predict in supervised ML. This is also referred to as an outcome
variable. For example, in a manufacturing setting the target variable could be a product defect.
task list
A tool that is used to track progress through a runbook. A task list contains an overview of
the runbook and a list of general tasks to be completed. For each general task, it includes the
estimated amount of time required, the owner, and the progress.
test environment
See environment.
training
To provide data for your ML model to learn from. The training data must contain the correct
answer. The learning algorithm finds patterns in the training data that map the input data
attributes to the target (the answer that you want to predict). It outputs an ML model that
captures these patterns. You can then use the ML model to make predictions on new data for
which you don’t know the target.
transit gateway
A network transit hub that you can use to interconnect your VPCs and on-premises
networks. For more information, see What is a transit gateway in the AWS Transit Gateway
documentation.
trunk-based workflow
An approach in which developers build and test features locally in a feature branch and then
merge those changes into the main branch. The main branch is then built to the development,
preproduction, and production environments, sequentially.
T 90

AWS Prescriptive Guidance Monitoring and alerting tools and best practices for Amazon RDS for
MySQL and MariaDB
trusted access
Granting permissions to a service that you specify to perform tasks in your organization in AWS
Organizations and in its accounts on your behalf. The trusted service creates a service-linked
role in each account, when that role is needed, to perform management tasks for you. For more
information, see Using AWS Organizations with other AWS services in the AWS Organizations
documentation.
tuning
To change aspects of your training process to improve the ML model's accuracy. For example,
you can train the ML model by generating a labeling set, adding labels, and then repeating
these steps several times under different settings to optimize the model.
two-pizza team
A small DevOps team that you can feed with two pizzas. A two-pizza team size ensures the best
possible opportunity for collaboration in software development.
U
uncertainty
A concept that refers to imprecise, incomplete, or unknown information that can undermine the
reliability of predictive ML models. There are two types of uncertainty: Epistemic uncertainty
is caused by limited, incomplete data, whereas aleatoric uncertainty is caused by the noise and
randomness inherent in the data. For more information, see the Quantifying uncertainty in
deep learning systems guide.
undifferentiated tasks
Also known as heavy lifting, work that is necessary to create and operate an application but
that doesn’t provide direct value to the end user or provide competitive advantage. Examples of
undifferentiated tasks include procurement, maintenance, and capacity planning.
upper environments
See environment.
U 91

AWS Prescriptive Guidance Monitoring and alerting tools and best practices for Amazon RDS for
MySQL and MariaDB
V
vacuuming
A database maintenance operation that involves cleaning up after incremental updates to
reclaim storage and improve performance.
version control
Processes and tools that track changes, such as changes to source code in a repository.
VPC peering
A connection between two VPCs that allows you to route traffic by using private IP addresses.
For more information, see What is VPC peering in the Amazon VPC documentation.
vulnerability
A software or hardware flaw that compromises the security of the system.
W
warm cache
A buffer cache that contains current, relevant data that is frequently accessed. The database
instance can read from the buffer cache, which is faster than reading from the main memory or
disk.
warm data
Data that is infrequently accessed. When querying this kind of data, moderately slow queries
are typically acceptable.
window function
A SQL function that performs a calculation on a group of rows that relate in some way to the
current record. Window functions are useful for processing tasks, such as calculating a moving
average or accessing the value of rows based on the relative position of the current row.
workload
A collection of resources and code that delivers business value, such as a customer-facing
application or backend process.
V 92

AWS Prescriptive Guidance Monitoring and alerting tools and best practices for Amazon RDS for
MySQL and MariaDB
workstream
Functional groups in a migration project that are responsible for a specific set of tasks. Each
workstream is independent but supports the other workstreams in the project. For example,
the portfolio workstream is responsible for prioritizing applications, wave planning, and
collecting migration metadata. The portfolio workstream delivers these assets to the migration
workstream, which then migrates the servers and applications.
WORM
See write once, read many.
WQF
See AWS Workload Qualification Framework.
write once, read many (WORM)
A storage model that writes data a single time and prevents the data from being deleted or
modified. Authorized users can read the data as many times as needed, but they cannot change
it. This data storage infrastructure is considered immutable.
Z
zero-day exploit
An attack, typically malware, that takes advantage of a zero-day vulnerability.
zero-day vulnerability
An unmitigated flaw or vulnerability in a production system. Threat actors can use this type of
vulnerability to attack the system. Developers frequently become aware of the vulnerability as a
result of the attack.
zombie application
An application that has an average CPU and memory usage below 5percent. In a migration
project, it is common to retire these applications.
Z 93
