
DB2 Query Tuning and Index Creation
December 2010
IBM TIVOLI SERVICE MANAGEMENT PRODUCTS VERSION 7
DB2
QUERY TUNING AND INDEX CREATION
WHITE PAPER
Document version 1.0
© Copyright International Business Machines Corporation 2010.
US Government Users Restricted Rights – Use, duplication or disclosure restricted by GSA ADP Schedule
Contract with IBM Corp.
1

This paper applies to the following products based on Tivoli's process automation engine:
• IBM
®
Maximo
®
Asset Management 7.1
• IBM Tivoli
®
Change and Configuration Management Database 7.1 and 7.2
• IBM Tivoli Provisioning Manager 7.1 and 7.2
• IBM Tivoli Service Automation Manager 7.1 and 7.2
• IBM Tivoli Service Request Manager
®
7.1 and 7.2
In the remainder of this document, this set of products will be referred to as IBM Tivoli
service management products.
ii

TABLE OF CONTENTS
Revision History ..............................................................................................................viii
1 Introduction............................................................................................................1
1.1 Key Concepts ............................................................................................1
1.2 SQL Queries..............................................................................................2
1.3 Indexes ......................................................................................................3
2 DB2 Snapshot Information ....................................................................................3
2.1 Average CPU and Execution Time............................................................5
2.2 Sorts and Sort Time...................................................................................6
2.3 Rows Read ................................................................................................6
2.4 Index Read Efficiency................................................................................8
2.5 Synchronous Read Percent.......................................................................8
2.6 Buffer Pool Logical Reads .........................................................................9
2.7 Totals are Important Too .........................................................................10
3 SystemOut.log Files ............................................................................................10
4 Tools from IBM Tivoli Service Management Products Wikis...............................11
4.1 Performance Analyst ...............................................................................11
4.1.1 Installing and Configuring ....................................................................... 11
iii

4.1.2 Features.................................................................................................. 12
4.1.3 Using Performance Analyst with IBM Tivoli Service Management Products
14
4.2 DB2 Snapshot Statement Formatting Tool..............................................18
5 DB2 Analysis Tools .............................................................................................19
5.1 IBM DB2 Design Advisor .........................................................................19
5.1.1 Using DB2 Design Advisor ..................................................................... 19
5.1.2 Index Optimization Workflow .................................................................. 22
5.2 IBM Optim Query Tuner for Linux, UNIX
®
and Windows.........................22
5.2.1 Using OQT with IBM Tivoli Service Management Products................... 24
5.2.2 Optimization Workflow............................................................................ 33
6 Performance Monitoring Tool (PerfMon) .............................................................34
1.1. Configuring PerfMon................................................................................34
1.2. Using PerfMon.........................................................................................35
Appendices .....................................................................................................................39
A Performance Analyst General Usage..................................................................39
B OQT General Usage............................................................................................59
7 References ..........................................................................................................72
iv

TABLE OF FIGURES
Figure 1: DB2 Optimizer access plan ................................................................................................2
Figure 2: Example database snapshot ..............................................................................................4
Figure 3: Example database snapshot details...................................................................................5
Figure 4: Average CPU and Execution Time.....................................................................................6
Figure 5: Sorts and Sort Time............................................................................................................6
Figure 6: Rows read...........................................................................................................................7
Figure 7: Average rows read per database transaction.....................................................................7
Figure 8: Index read efficiency...........................................................................................................8
Figure 9: Synchronous read percent .................................................................................................9
Figure 10: Buffer pool data logical reads.........................................................................................10
Figure 11: The DB2::Snapshot plug-in ............................................................................................14
Figure 12: Average CPU and Execution Time snapshot table........................................................15
Figure 13: Sorts and Sort Time snapshot........................................................................................15
Figure 14: Rows Read snapshot .....................................................................................................16
Figure 15: Average Rows Read per Database Transaction snapshot ............................................16
Figure 16: Index Read Efficiency snapshot .....................................................................................17
Figure 17: Synchronous Read Percentage snapshot......................................................................17
Figure 18: Buffer Pool Logical Reads snapshot ..............................................................................18
Figure 19: DB2 Design Advisor snapshot........................................................................................21
Figure 20: Optimizing indexes for the workflow...............................................................................22
Figure 21:DB2 optimizer with Optim................................................................................................23
Figure 22: Optim query tuner operation...........................................................................................23
Figure 23: Query formatter in operation...........................................................................................24
Figure 24: Optim Query tuner in analysis ........................................................................................25
Figure 25: Choosing tuner activities ................................................................................................26
Figure 26: The formatted and annotated query...............................................................................27
Figure 27: The formatted and annotated expanded query..............................................................27
Figure 28: Expanded view of the access plan graph.......................................................................28
Figure 29: Detailed cost information for the query from the access plan graph..............................29
Figure 30: Running the generated runstats commands ..................................................................30
Figure 31: Data type mismatch........................................................................................................31
Figure 32: Running the DDL to create the index .............................................................................32
v

Figure 33: Comparing the before and after access plan graphs .....................................................32
Figure 34: Displaying the before and after plan graphs...................................................................33
Figure 35: Using the OQT workflow for query tuning ......................................................................33
Figure 36: Example HTTP Request Monitoring Screen ..................................................................35
Figure 37: An example SQL, Explain Plan, and Stack Trace Monitoring Screen............................36
Figure 38: Showing the execution times..........................................................................................37
Figure 39: Performance analyst - spreadsheet-like user interface..................................................39
Figure 40: Performance analyst context menu................................................................................40
Figure 41: Performance analyst multiple windows ..........................................................................41
Figure 42: Performance analyst alerts.............................................................................................42
Figure 43: Performance Analyst customization table ......................................................................43
Figure 44: Performance analyst profile menu..................................................................................44
Figure 45: Alert criteria editor ..........................................................................................................45
Figure 46: Threshold levels..............................................................................................................46
Figure 47: Context help....................................................................................................................46
Figure 48: Plug-in selection dialog...................................................................................................47
Figure 49: Workspace persistence ..................................................................................................48
Figure 50: DB2 Monitor Plug-in Database tab.................................................................................48
Figure 51: DB2 Monitor Plug-in Database Manager tab..................................................................49
Figure 52: DB2 Monitor Plug-in Buffer Pool tab...............................................................................49
Figure 53: DB2 Monitor Plug-in Tablespace tab..............................................................................50
Figure 54: DB2 Monitor Plug-in Table tab .......................................................................................50
Figure 55: DB2 Monitor Plug-in Lock tab.........................................................................................51
Figure 56: DB2 Monitor Plug-in Application tab...............................................................................51
Figure 57: DB2 Monitor Plug-in Statement tab................................................................................52
Figure 58: DB2 Monitor Plug-in Deadlock tab .................................................................................52
Figure 59: Tivoli’s process automation engine Plug-in....................................................................53
Figure 60: Process automation engine Plug-in usual statement view.............................................53
Figure 61: Java Dump Plug-in Thread tab.......................................................................................54
Figure 62: Java Dump Plug-in Monitor tab ......................................................................................54
Figure 63: Java GC Plug-in Summary tab.......................................................................................55
Figure 64: Java GC Plug-in Invocation tab......................................................................................55
Figure 65: Example of a verbose GC using 'gencon' policy ............................................................56
Figure 66: JLM Plug-in Java Monitor tab.........................................................................................57
Figure 67: JLM Plug-in System Monitor Tab ...................................................................................58
Figure 68: CSV Plug-in ....................................................................................................................58
Figure 69: Optim Query Tuner window............................................................................................59
vi

Figure 70: Optim Query Tuner views...............................................................................................60
Figure 71: Data Source Explorer configuration ...............................................................................61
Figure 72: Configuring the connection for OQT...............................................................................61
Figure 73: Configuring a new connection........................................................................................62
Figure 74: OQT Query Tuner tab.....................................................................................................62
Figure 75: OQT Features tab...........................................................................................................63
Figure 76: Starting a Query Tuner Session.....................................................................................63
Figure 77: Workflow Editor functions...............................................................................................64
Figure 78: Invoking the Tuning Features.........................................................................................65
Figure 79: Tailoring the Advisor Executions ....................................................................................66
Figure 80: Execute Advisors and Tools...........................................................................................67
Figure 81: Query Analysis Results ..................................................................................................68
Figure 82: Query Analysis Results ..................................................................................................68
Figure 83: Access Plan Graph.........................................................................................................69
Figure 84: Statistics Advisor ............................................................................................................69
Figure 85: Query Advisor.................................................................................................................70
Figure 86: Access Path Advisor.......................................................................................................70
Figure 87: Index Advisor..................................................................................................................71
vii

REVISION HISTORY
Date Version Revised By Comments
December 2010 0.1 RR Initial Version
December 2010 0.2 IB First Edit
January 2011 1.0 IB Final Version
viii

1 Introduction
This white paper illustrates how tools can be used to perform SQL query tuning and to
create indexes against a DB2
®
database in order to obtain maximum performance from
IBM Tivoli service management products. As a reader of this white paper, you should
understand basic database administration topics at a minimum; although, some topics are
advanced. You also may want to refer to the following online recommended reading
materials:
• General introductory DBA information available at the following link:
http://www.ibm.com/developerworks/data/.
•
Chris Eaton’s “An Expert's Guide to DB2 Technology” blog
•
Sam Lightstone has authored and co-authored several publications such as “Physical
Database Design: the database professional's guide to exploiting indexes,
views, storage, and more”. A full list of his publications can be found at the following
link:
http://lightstone.x10hosting.com/#_Publications.
The database is central to the functionality of IBM Tivoli service management products.
This database stores all data that is collected and calculated by the applications. This
database also stores metadata for configuring and maintaining the environment.
The database server processes all transactions from the applications. Because all
functionality is based on database performance, the database should be a key focus for
performance tuning.
The focus of this paper is not on tuning the database itself. For information on suggested
DB2 database settings, refer to the Best Practices for System Performance (v7) white
paper that can be downloaded from the performance sections of the IBM Tivoli service
management products’ wikis:
• IBM Maximo Asset Management –
http://www.ibm.com/developerworks/wikis/display/maximo/Performance+and+Tuning
• IBM Tivoli Change and Configuration Management Database –
http://www.ibm.com/developerworks/wikis/display/tivoliccmdb/Performance+and+Tunin
g
• IBM Tivoli Provisioning Manager –
https://www.ibm.com/developerworks/wikis/display/tivoliprovisioningmanager/Performa
nce+and+Scalability
• IBM Tivoli Service Automation Manager –
http://www.ibm.com/developerworks/wikis/display/tivoli/TSAM+Performance+and+Scal
ability
• IBM Tivoli Service Request Manager –
http://www.ibm.com/developerworks/wikis/display/tivolisrm/Performance+and+Tuning
1.1 Key Concepts
Following are some key concepts that will be used throughout the remainder of this paper:
1

Introduction
• SQL statements allow you to work with the data in a database. There are three
different types of SQL statements:
o Data Definition Language (DDL) statements are used to create, modify,
and drop objects in the database.
o Data Manipulation Language (DML) statements are used to insert,
update, delete, or query data from the database.
o Data Control Language (DCL) statements are used to grant or revoke
the authority to perform operations on database objects.
• A table contains records consisting of columns and rows of unordered data.
• An index is an ordered pointer to data in a table. Conceptually, you can think of a
database index like an index in a book. The index has the terms listed alphabetically
with page numbers pointing to the pages in the book where these terms are used.
• The DB2 optimizer takes a SQL statement along with other inputs such as database
statistics, design, and configuration information to determine the best method to satisfy
request. The output of the optimizer is the access plan.
Figure 1 illustrates the inputs
to the optimizer and the output of the access plan:
DB2 Optimizer
Statement
Database Statistics
Constraints
Database Design
DB Configuration
Registry Variables
Figure 1: DB2 Optimizer access plan
You can think of a SQL query as being what you want to retrieve and the access plan
determines how to retrieve it.
Changing the inputs to the optimizer can create a more efficient access plan. These
changes can consist of altering the SQL statement itself to be more efficient, updating
the database statistics, or potentially adding indexes to improve the speed of data
retrieval operations at the cost of slower writes and decreased storage space.
1.2 SQL Queries
Customizing IBM Tivoli service management products can change the way information is
selected from the database. Some customizations include additional tables and columns.
In addition, queries can be added to a user’s Start Center or are generated by individual
2

DB2 Snapshot Information
users on the list tabs of applications. Users can create and save their own queries, and can
share queries with other users. Default queries can be setup for applications so users see
their preferred record set when they enter the application.
While these are powerful features of IBM Tivoli service management products, they can
produce inefficient SQL. Therefore, it is very important to ensure that queries are
monitored both pre-production and post-production for inefficient conditions and use of un-
indexed columns and to remove order by clauses.
1.3 Indexes
Indexing a database requires a good understanding of the data, user functions, and how
databases use indexes. Indexes use key parts of data from a table in a binary structure to
enhance searching capability. Each record of data in the table must have associated data
in the index.
Indexing can greatly increase search speeds. However, a drawback of indexes is that for
each insert, update, or delete, the index must also be updated. Database administrators
often apply many indexes to a table to enhance searching, and then find that other
activities have slowed. You should review indexes to ensure that you have the right
balance for searching and updating tables.
Generally, index overhead is linear in DB2. For example, on a table with one index, if it
takes 500 milliseconds to update the table and an additional 100 milliseconds to update the
index, then adding a second index to that table would add an additional 100 milliseconds to
the transaction.
2 DB2 Snapshot Information
DB2 snapshots are one of the primary mechanisms you can use for ensuring that queries
and indexes are tuned appropriately.
DB2 snapshots provide general statistics and information about all applications, tables,
table spaces, buffer pools, and locks for a specified database.
Ideally, DB2 snapshots are taken during performance testing before the solution is in
production, when the overhead of taking DB2 snapshots would not affect the users.
However, since snapshots only capture a point in time, you must make sure that the
snapshot is taken while transactions are occurring that may be causing performance
issues.
The basic set of commands needed to take a DB2 snapshot is as follows:
• db2 update monitor switches using bufferpool on lock on sort on
statement on table on uow on
• db2 -v reset monitor all
• db2 -v get snapshot for dbm > snapshot.txt
• db2 -v get snapshot for all on database-alias >> snapshot.txt
• db2 update monitor switches using bufferpool off lock off sort off
statement off table off uow off
3

DB2 Snapshot Information
Note that there is overhead with the monitor switches, so they should always be enabled
prior to taking the snapshot, and then disabled after the snapshot data is gathered.
The output from the above commands is stored in text readable format. Opening the
snapshot.txt file with a text editor would show information similar to
Figure 2 and
Figure 3:
Figure 2: Example database snapshot
4

DB2 Snapshot Information
Figure 3: Example database snapshot details
Now, let’s take a closer look at some of the items that would point you to inefficient SQL
statements. General guidance is to focus on the most relevant areas for improvement and
fix the worst offenders first.
2.1 Average CPU and Execution Time
First, look for any statements that have the longest average CPU time or the longest
average execution time (total elapsed time). Let’s look at an example:
5

DB2 Snapshot Information
Figure 4: Average CPU and Execution Time
In Figure 4, you can see that the statement in question executed 2127 times during this
snapshot, and the total execution time was 46847 seconds, resulting in an average
execution time of 22 seconds. The average busy time is 0.001 seconds.
So, while CPU usage is low, the execution time for this SQL would warrant further
investigation.
2.2 Sorts and Sort Time
Next, look for any SQL statements that show a high average number of sorts or average
time spent on sorts, see
Figure 5.
Figure 5: Sorts and Sort Time
In this case, sorts do not appear to be an issue; however, any high values in these areas
would indicate that indexes are missing or are ineffectively designed.
2.3 Rows Read
Another issue to look for is when a large number of rows are read:
6

DB2 Snapshot Information
Figure 6: Rows read
In Figure 6, 318570 rows are read in 2127 executions, or approximately 150 rows read per
execution. A high number of rows read can also indicate the need for an index.
You should also look at the average rows read per database transaction (RR/Tx). This can
be defined as: Rows Read / (Commits Attempted + Rollbacks Attempted).
Looking at information from the snapshot in
Figure 7:
Figure 7: Average rows read per database transaction
We see that the average rows read per transaction is: 73896653 / (1503720 +
5770) = 48.95.
High values for RR/Tx may indicate a table needs index tuning or physical design changes,
so you would then look for any queries that are driving up this value and investigate
accordingly.
Generally accepted guidelines for this value are:
• Best: <10
• Room for Improvement: 10 - 100
• Problem: >100
However, these guidelines should not be applied strictly. As previously mentioned, adding
an index is not always the appropriate action to take due to the overhead that can be
added to inserts and updates. In addition, IBM Tivoli service management products have
seen situations where this value was high, yet there are no issues.
7

DB2 Snapshot Information
2.4 Index Read Efficiency
Index read efficiency is defined as Rows Read / Rows Selected. This value should
normally be kept <10. Only database and application snapshots will contain this
information. From the example in
Figure 8:
Figure 8: Index read efficiency
You can see that index efficiency is 10.5 which is on the top side of the recommendation.
2.5 Synchronous Read Percent
Synchronous read percent (SRP) is defined as: 100 - (((Asynchronous pool data
page reads + Asynchronous pool index page reads) * 100) / (Buffer
pool data physical reads + Buffer pool index physical reads)).
When DB2 has good indexes available to retrieve rows for result sets, it will use
synchronous I/O to access precisely just the index and data pages required. When indexes
are missing, or the physical design is otherwise sub-optimal, DB2 will resort to using
asynchronous pre-fetch I/O to scan index or data pages.
You should keep SRP as high as possible with 90% or higher being optimal:
8

DB2 Snapshot Information
Figure 9: Synchronous read percent
In the example in Figure 9, SRP = 100 - (((38113 + 13395) * 100) / (43169 +
15082)) = 11.576 which is far below the recommended value.
2.6 Buffer Pool Logical Reads
Lastly, from the DB2 snapshot data, you need to look at the average buffer pool data
logical reads and buffer pool index logical reads. The buffer pool index logical reads value
can help you detect index leaf page scans, which indicates an inadequate index structure.
A high value for buffer pool data logical reads indicates higher CPU times. Both values
should be kept below 6, see
Figure 10:
9

SystemOut.log Files
Figure 10: Buffer pool data logical reads
In the example in Figure 10 with 2127 executions, the average buffer pool index logical
reads is 4 which is in the recommended range; however, the average buffer pool data
logical reads value is 36 which is quite high.
2.7 Totals are Important Too
In the above examples, we focused on average values to find heaving hitting issues.
However, don’t forget to also look at the totals as well. For example, you may find that a
query will have overall low average busy or execution times, but the total execution time is
quite high due to the number of times this query must execute. This query would also be a
good candidate to tune, so the overall effect on execution time is reduced. You may also
want to understand why so many executions are needed.
3 SystemOut.log Files
Besides taking DB2 snapshots, another method for finding long running SQL queries is to
analyze the Websphere
®
Application Server SystemOut.log files associated with each
cluster member running IBM Tivoli service management products.
mxe.db.logSQLTimeLimit is a system property that can be used to capture SQL
statements that take longer than the specified amount of time to return. When there is a
perceived performance problem, setting this property can capture long running SQL and
help determine if database tuning is required. Due to the low overhead of using the
mxe.db.logSQLTimeLimit property, this method is highly recommended for isolating
poor performing queries in production when the overhead of taking a database snapshot
may be undesirable.
Databases should be able to return most SQL statements in under one second. The
number associated with this property is milliseconds; therefore, setting
10

Tools from IBM Tivoli Service Management Products Wikis
mxe.db.logSQLTimeLimit=1000 will result in entries such as the following for any SQL
statements taking longer than 1 second to execute:
[5/20/10 0:01:37:472 PDT] 00000044 SystemOut O 20 May 2010
00:01:37:472 [WARN]
BMXAA6720W - USER = (MAXADMIN) SPID =
(110.42.33.229.4612.100520065933) app (SR) object (SR) :
select * from sr where pmcomtype is null and sr.status not in
('DRAFT') order by ticketid for read only (execution took 1172
milliseconds)
[5/20/10 0:06:22:284 PDT] 00000039 SystemOut O 20 May 2010
00:06:22:284 [WARN]
BMXAA6720W - USER = (MAXADMIN) SPID =
(110.42.33.229.1028.100520065915) app (SR) object (SR) :
select * from sr where pmcomtype is null and sr.status not in
('DRAFT') order by ticketid for read only (execution took 1421
milliseconds)
SQL queries such as these are prime candidate for tuning. For more information on using
the mxe.db.logSQLTimeLimit and other debug properties to monitor and troubleshoot
performance, please refer to this link:
http://www-
01.ibm.com/support/docview.wss?uid=swg21291250&ibmprd=tivtlpa. Note that in version
7, these properties may be set and activated through the system properties application
which does not require a system restart.
4 Tools from IBM Tivoli Service
Management Products Wikis
While we have seen that there is a great deal of valuable information in the DB2 snapshot
file and/or the SystemOut.log files, parsing the files and finding the information can be
tedious at best. IBM Tivoli service management products have provided some tools on the
product wikis (refer to the links in Section 1 of this white paper) that can assist in pulling the
available information out of the files for analysis.
4.1 Performance Analyst
The Performance Analyst tool enables you to analyze performance issues for products
based on Tivoli's process automation engine. Specifically, you can use DB2 snapshot data
and SystemOut.log files to assist with SQL and index tuning.
4.1.1 Installing and Configuring
Download the version of Performance Analyst that is appropriate for your platform. The tool
is available for both Windows
®
and Linux
®
platforms on both 32-bit and 64-bit architectures.
You can find the link to download the tool and the readme from the product wikis or directly
from here:
http://www.ibm.com/developerworks/wikis/display/maximo/Performance+Analyst+Tool.
Note that Java
TM
6 is a required pre-requisite. Unzip the distribution file to a folder of your
choice. Unzip creates a top level folder with the same name as the distribution zip file, e.g.
perfanalyst-win_x86-0.3.4.
11

Tools from IBM Tivoli Service Management Products Wikis
Edit the <top folder>\perfanalyst.bat file (Windows) or <top folder>\perfanalyst.sh file
(Linux) and set the maximum JVM memory to a value appropriate for your system. Then,
execute the bat/sh file to start the tool.
Select FileÆOpen to display the Plug-in selection dialog. Select the plug-in to use and click
OK. Navigate to the data file to analyze and click Open.
4.1.2 Features
User interface
• Spreadsheet-like interface provides convenient column sorting and re-ordering for
performance analysis.
• Rich customization capability including hiding unimportant columns (or showing
only interested columns), data filtering, searching (regular expression available).
Customization results may also be saved for easier switching between different
context and purpose.
• Multiple windows may be opened for analyzing multiple data inputs at the same
time. Window content may be duplicated, auto-arranged on screen.
• "Alert" criteria may be defined for pin-pointing commonly known-as-problem data.
Criteria are defined in a free form Ruby expression syntax which provides almost
unrestricted capability. Data matching any "alert" is marked in an obvious color for
further analysis. It is also possible to define different level for alerts to have
different visual indication in the user-interface.
• A pre-defined set of alerts are provided as the default configuration, based on
various performance best practice (or recommendation). These may be further
extended or refined via the customization facility.
• Contextual help for explanation of the performance metrics/data represented by
each column.
• Data may be exported into HTML, CSV format, or pasted into the clipboard.
DB2 Monitor Plug-in
• DB2 snapshot monitor and event monitor output. For the event monitor, currently
only statement and deadlock event monitor outputs are supported. Also, deadlock
event monitor output importing only supports 3 modes: "DEADLOCKS",
"DEADLOCKS WITH DETAILS", and "DEADLOCKS WITH DETAILS HISTORY".
• Several kinds of tabs are provided for different kind of analysis:
o database manager
o database
o buffer pools
o tablespaces
o tables
o database applications
o locks
o statements
o deadlock (for deadlock event monitor)
Tivoli’s process automation engine Plug-in
• Specifically for importing the SystemOut.log files, this plug-in currently has two
views for analyzing SQL statements, including grouping statements by objects
showing their overall percentage (by object).
Note: The following plug-ins are also included with the Performance Analyst tool. While
they are not specifically used in diagnosing database performance problems, they may be
useful for other performance diagnostics:
12

Tools from IBM Tivoli Service Management Products Wikis
Java dump plug-in
• Java dumps output. Currently it only handles thread stack trace and monitor
sections only
• Several kinds of tabs are provided for different kind of analysis:
o Thread
o Monitor: with references to owner and waiting threads.
Java GC plug-in
• Java verbose GC output
• The detailed GC information, including allocation failure, tenured/nursery space,
garbage collection is parsed and presented. An additional GC summary tab is also
provided to give overview information, for example, the average GC utilization and
the maximum GC time.
JLM plug-in
• JLM plug-in can import Performance Inspector
TM
JLM outputs. This plug-in is also
special in that it can further inter-mix JLM outputs with a set of thread dumps, in
order to pin-point the source location of a monitor's usage.
• Monitors are presented in 2 tabs, based on their types:
• Java monitors
• system monitors
CSV plug-in
This is a general purpose plug-in that loads data from a comma-separated-value format
output. Any CSV file may be loaded to have the benefit of searching, filtering, sorting, and
so on. Currently, the very first line of the input CSV files is reserved for the column
headers.
For more information on general usage of Performance Analyst, refer to Appendix A of
this document.
13

Tools from IBM Tivoli Service Management Products Wikis
4.1.3 Using Performance Analyst with IBM Tivoli Service Management
Products
Let us take a look at how we can use Performance Analyst to perform DB2 snapshot
analysis:
First, you will start Performance Analyst, select FileÆOpen, and choose the
DB2::Snapshot plug-in, see
Figure 11:
Figure 11: The DB2::Snapshot plug-in
Click the OK button and select the DB2 snapshot file to process. Once the snapshot file is
loaded, we can use the tabs to review the items we outlined in Section 2 of this document.
Average CPU and Execution Time
Clicking the statement tab and clicking the avg_busy_time column to sort by this value
shows the SQL statements that use the most average CPU time, see :
14

Tools from IBM Tivoli Service Management Products Wikis
Figure 12: Average CPU and Execution Time snapshot table
Sorting on the avg_exec_time shows the statements with the longest average execution
time.
Sorts and Sort Time
Find those statements with high average sort times by sorting on the avg_sort_time
column:
Figure 13: Sorts and Sort Time snapshot
Other sort columns of interest are total_sorts and total_sort_time.
15

Tools from IBM Tivoli Service Management Products Wikis
Rows Read
Sorting on the rows_read column shows those statements with high numbers of rows read.
Figure 14: Rows Read snapshot
Click on the Database tab to find the Average Rows Read per Database Transaction value:
Figure 15: Average Rows Read per Database Transaction snapshot
16

Tools from IBM Tivoli Service Management Products Wikis
Index Read Efficiency
Also on the Database tab, you will find the Index Read Efficiency value:
Figure 16: Index Read Efficiency snapshot
Synchronous Read Percent
Scroll further down in the Database tab to see the Synchronous Read Percentage value:
Figure 17: Synchronous Read Percentage snapshot
17

Tools from IBM Tivoli Service Management Products Wikis
Buffer Pool Logical Reads
Return to the Statement tab and sort by the pool_index_l_reads and pool_data_l_reads
columns to see the statements with high Bufferpool Index Logical Read and Bufferpool
Data Logical Read values, respectively:
Figure 18: Buffer Pool Logical Reads snapshot
4.2 DB2 Snapshot Statement Formatting Tool
As you can see, using the Performance Analyst tool makes analyzing a DB2 snapshot file
much easier than reading the native output file.
However, there are times when you may want a quick view of the statement data from the
snapshot file without taking the time to fully process the snapshot data in Performance
Analyst.
For those situations, IBM Tivoli service management products provide the DB2 Snapshot
Statement Formatting Tool. This tool reads a DB2 statement snapshot file and produces a
text file that can be imported into a spreadsheet for sorting/manipulation to assist with
identifying query issues.
You can find the link to download the tool and the readme from the product wikis or directly
from here:
https://www.ibm.com/developerworks/wikis/download/attachments/141559508/DB2+Snaps
hot+Format+Tool.zip. After downloading the file, unzip it to a folder of your choice. Note
that this tool requires Perl to be installed on your system. IBM Tivoli service management
products have tested this tool with ActivePerl which you can download from this link:
http://www.activestate.com/activeperl.
To use the tool, simply invoke the Perl script giving it the name of the DB2 snapshot file as
input, e.g.:
transfer.pl d:\snapshots\snapshot.txt
The output file from the Perl script will be located in the same directory as the script and
will be called transfer.txt. Note that the first row of the file lists the column names, the
18

DB2 Analysis Tools
remainder of the rows show the statement data, and that each column is separated by a
semi-colon.
This file can now be imported into a spreadsheet tool where the data would look like this:
NumEx NumComp WorstP BestP IntRDel IntRIns RowsRead IntRUpd RowsWri Sorts
13618 2 49 2 0 0 95332 0 0 0
64 1 48 48 0 0 774 0 0 0
39 1 49 49 0 0 5873 0 0 0
64 1 71 71 0 0 70 0 0 0
13697 1 4 4 0 0 13697 0 0 0
64 1 1 1 0 0 0 0 0 0
8640 1 1 1 0 0 4864 0 0 0
73230 3 37 1 0 0 6 0 0 0
12918 1 2 1 0 0 0 0 0 0
21108 1 19 19 0 0 21108 0 0 0
64 1 2 2 0 0 29824 0 0 0
13164 1 3 3 0 0 133 0 13164 0
8054 1 63 63 0 0 6 0 0 0
13594 1 1 1 0 0 13594 0 0 0
You can now sort the various columns using your spreadsheet program to perform data
analysis.
5 DB2 Analysis Tools
Now that we have seen the information that can be used from DB2 Snapshots and
SystemOut.log files to determine potential problems with SQL statements, let us take a
look at some of the DB2 analysis tools that can be used to diagnose and suggest fixes for
the issues.
5.1 IBM DB2 Design Advisor
The DB2 Design Advisor is a tool that can help you improve database performance. Given
a set of SQL statements, it can provide recommendations for:
• New indexes
• New materialized query tables (MQTs)
• Conversion to multidimensional clustering (MDC) tables
• Redistribution of tables
Refer to the
DB2 Information Center for detailed db2advis command options, as well as an
Introduction to DB2 Design Advisor.
5.1.1 Using DB2 Design Advisor
The DB2 Design Advisor can be invoked in several ways:
• A set of dynamic SQL statements that were captured in a snapshot
db2advis -d <db> -g
19

DB2 Analysis Tools
• A single SQL statement
db2advis -d <db> -s "statement"
• A set of SQL statements that are contained in a workload file
db2advis -d <db> -i <workload file>
This is an example of a workload file:
20

DB2 Analysis Tools
The output from DB2 Design Advisor consists of several recommendations including the
creation of additional indexes and running runstats such as in this example:
When using Performance Analyst to examine a DB2 snapshot file, you can export the
results into a DB2 Design Advisor workload file:
-- LIST OF RECOMMENDED INDEXES
-- ===========================
-- index[1], 0.087MB
CREATE UNIQUE INDEX "PAULMCI"."IDX50316201"
ON "TPCC "."DISTRICT" ("D_W_ID" ASC, "D_ID" ASC)
INCLUDE ("D_YTD", "D_ZIP", …) ALLOW REVERSE SCANS;
COMMIT WORK;
RUNSTATS ON TABLE "TPCC"."DISTRICT" FOR INDEX "PAULMCI"."IDX50316201" ;
COMMIT WORK;
-- index[2], 0.024MB
CREATE UNIQUE INDEX "PAULMCI"."IDX50316206" ON "TPCC "."DISTRICT" ….
…
-- RECOMMENDED EXISTING INDEXES
-- ============================
-- RUNSTATS ON TABLE "TPCC"."DISTRICT" FOR INDEX "TPCC"."DIST_IDX1";
-- COMMIT WORK;
-- RUNSTATS ON TABLE "TPCC"."NEW_ORDER" FOR INDEX "TPCC"."NU_ORD_IDX1";
…
-- UNUSED EXISTING INDEXES
-- ===========================
-- DROP INDEX "TPCC"."CUST_IDX3";
-- ===========================
Figure 19: DB2 Design Advisor snapshot
Provide as complete a workload as possible, otherwise it may suggest that you drop an
index which is used by a query which is not included.
If the statistics on your database are not current, the generated recommendations will be
less reliable.
Do not blindly accept the recommendations from DB2 Design Advisor. It is important to
verify its recommendations before implementing them.
21

DB2 Analysis Tools
Some recommendations involve adding the new index and dropping the old one. So it is a
good idea to accept these recommendations as a pair.
DB2 Design Advisor can recommend adding an index that is a superset of another (that is,
includes an additional column) instead of modifying the existing index.
It can also recommend replacing two unidirectional indexes with a single bi-directional one.
5.1.2 Index Optimization Workflow
In summary, we’ve used the following workflow to optimize indexes for the database:
Figure 20: Optimizing indexes for the workflow
5.2 IBM Optim Query Tuner for Linux, UNIX
®
and Windows
While the DB2 Design Advisor is a good tool for database optimization, IBM has released a
follow-on product called Optim
TM
Query Tuner (OQT) that provides even more value for
database tuning.
In Section 1 of this document, we see how inputs go through the DB2 optimizer to create
an
access plan. OQT assists you in changing those inputs so the DB2 Optimizer creates a
more efficient access plan, see
Figure 21 :
22

DB2 Analysis Tools
DB2 Optimizer
Rewrite Statement
Update Database Statistics
Change Constraints
Change Database Design
Change DB Configuration
Change Registry Variables
Figure 21:DB2 optimizer with Optim
Optim Query Tuner includes the following tools and advisors to make those changes:
DB2 Optimizer
Rewrite Statement
Update Database Statistics
Change Constraints
Change Database Design
Change DB Configuration
Change Registry Variables
Query Annotation
Query Advisor
Access Plan Graph
Access Path Advisor
Statistics Advisor
Index Advisor
Query Analysis and
Summary Reports
Figure 22: Optim query tuner operation
• Query Annotation: Formats the query with collapsible sections and highlighting to
improve readability and navigation through complex queries. You can see cost
estimates and statistical information about the predicates of the query, and additional
annotations such as information about columns that have skewed data.
• Query Advisor: Uses a set of rules to evaluate how the query is written and provides
best-practice-based suggestions for writing queries for optimal performance.
• Access Plan Graph: Shows the access plan chosen by the optimizer to execute the
query in a visual diagram. Provides cost and cardinality estimates for each step of the
process.
• Access Path Advisor: Examines the access plan chosen by the optimizer and
identifies certain access paths that commonly cause suboptimal query performance.
The warnings provided by the access path advisor can help you to understand where
to look for trouble in the access plan graph.
• Statistics Advisor: Provides advice on missing, obsolete and conflicting statistics that
might have a negative effect on the access plan that the optimizer chooses to execute
23

DB2 Analysis Tools
the query and suggests additional statistics that should be gathered to improve
individual query performance. Provides a runstats command that you can run to
collect and repair the statistics. You can also save the runstats commands to the
statistics profile tables to keep a history of the collected statistics and for use by
automatic statistics collection.
• Index Advisor: Recommends indexes that you can create to improve the performance
of the query, and provides DDL scripts that you can run to create the recommended
indexes
• Query Report: Simplifies collaboration identifying key statistics, access path
information, and physical database design information related to a query.
• Query Formatter: You can see the query formatted for readability and to clearly show
the structure of the query. The predicates in the query are ordered according to your
specification. By default the predicates are shown in increasing order of complexity.
Figure 23: Query formatter in operation
For more detailed information on Optim Query Tuner, refer to the following link: http://www-
01.ibm.com/software/data/optim/query-tuner-luw/.
5.2.1 Using OQT with IBM Tivoli Service Management Products
Now that we have seen how to use OQT, let us take a look at some examples of using
OQT with IBM Tivoli service management products.
24

DB2 Analysis Tools
Getting Started
The following figure shows that the database connection has been configured and selected
to work on, and a query has been pasted into OQT for analysis:
DB connection
Paste query
Select database
to work on
Figure 24: Optim Query tuner in analysis
25

DB2 Analysis Tools
Tuning Activities
In this example, all of the tuning activities have been chosen for analysis:
Figure 25: Choosing tuner activities
26

DB2 Analysis Tools
Query Format, Access Plan, and Recommendations
Below, you can see the formatted and annotated query, along with the access plan graph,
and the recommendations. As you can see, the advisors are recommending updating the
statistics, avoiding a data type mismatch, and creating an index.
Access Plan Grap
h
Recommendation
Reformatted
Query and
Annotation
Figure 26: The formatted and annotated query
Here is the expanded view of the formatted and annotated query:
Figure 27: The formatted and annotated expanded query
27


DB2 Analysis Tools
Lastly, we can see the detailed cost information for the query from the access plan graph:
Figure 29: Detailed cost information for the query from the access plan graph
Now, let us look at implementing the recommendations from above.
29

DB2 Analysis Tools
Runstats
One of the recommendations is to update the statistics for the query. The figure below
shows the generated runstats commands. Clicking on the Run icon will perform the
recommended runstats commands:
Figure 30: Running the generated runstats commands
While statistics are generally managed through database autonomics or a set maintenance
schedule, this feature can still be quite useful for updating statistics real-time as part of a
query tuning exercise.
30

DB2 Analysis Tools
Data Type Mismatch
You can see the details of the recommendation from the access path advisor for the data
type mismatch. Note that any changes need to be done manually. It would be up to the
database administrator to determine whether or not this recommendation is feasible.
Figure 31: Data type mismatch
31

DB2 Analysis Tools
Index Creation
Lastly, we will look at the suggested index to create for the query. You can run the DDL
directly from OQT to create the index:
Figure 32: Running the DDL to create the index
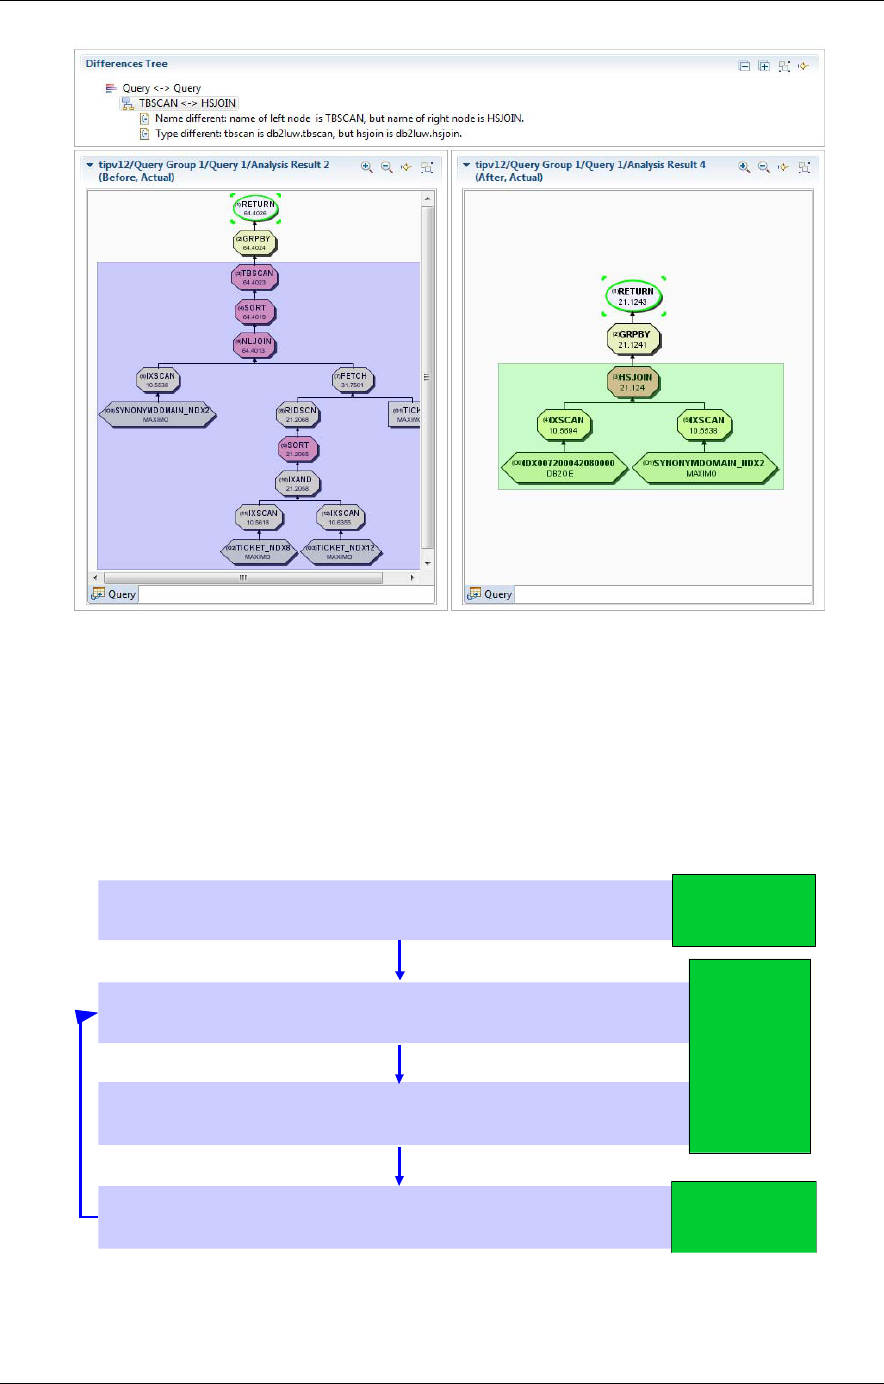
Tuning Results
Now that we have implemented the recommended tuning, let us take a look at the effect
they have on the query cost by comparing the before and after access plan graphs:
Figure 33: Comparing the before and after access plan graphs
32
DB2 Analysis Tools
Figure 34: Displaying the before and after plan graphs
5.2.2 Optimization Workflow
In summary, OQT has produced a greatly improved access plan for the query, illustrating
the benefit OQT has to improving IBM Tivoli service management products’ performance.
Previously, we looked at a workflow for using DB2 Advisor for optimizing indexes. Now, let
us look at the OQT workflow for query tuning:
Identify problematic statements
Come up with a solution
Experiment and review
Analyze the statements
Optim
Query
Tuner
DB2 Snapshot /
SystemOut.log
DB2 Snapshot /
SystemOut.log
Figure 35: Using the OQT workflow for query tuning
33

Performance Monitoring Tool (PerfMon)
6 Performance Monitoring Tool (PerfMon)
IBM Tivoli service management products running on Tivoli’s process automation engine
version 7.1.1.4 and above can take advantage of the built-in Performance Monitoring
(PerfMon) tool to determine SQL execution times. PerfMon is useful for understanding
what SQL statements are executed when performing certain functions within the
applications. For example, you may have identified a problematic query from the
SystemOut.log file or a DB2 snapshot, but you aren’t sure what user activity generates the
query. With PerfMon enabled, you can manually execute the suspected user scenarios to
isolate exactly what user action generates the query.
While PerfMon is a useful debug tool, it should not be used in production since the
monitoring system adds a high overhead to the system. In addition, it should not be
enabled while trying to take true measures of the response times or scalability.
1.1. Configuring PerfMon
Step 1: Stop the application server
Step 2: Using a text editor, open the UI Framework Deployment Descriptor (web.xml file)
located in
<MAXIMOBUILD>\applications\maximo\maximouiweb\webmodule\WEB-INF
Look for the following in the filter definition section and uncomment it:
<filter>
<filter-name>PerfMon</filter-name>
<filter-
class>psdi.webclient.system.filter.PerformanceMonitor</filter-
class>
</filter>
Look for the following in the filter mapping definition section and uncomment it:
<filter-mapping>
<filter-name>PerfMon</filter-name>
<url-pattern>/ui/*</url-pattern>
</filter-mapping>
Note: If you do not see the above entries as part of the web.xml, you will have to add it.
Make sure you add both sets of entries to the appropriate sections of the web.xml file.
Step 3: If you are using WebSphere Application Server enterprise archive (EAR) for
running IBM Tivoli service management products, you will need to regenerate the EAR file
using <MAXIMOBUILD>\applications\deployment\buildmaximoear.cmd and
redeploy the EAR on the application server.
If you are using IBM Tivoli service management products on WebLogic, ignore this step.
Step 4: Restart the application server
34

Performance Monitoring Tool (PerfMon)
1.2. Using PerfMon
Open IBM Tivoli service management product in a web browser and proceed to the portion
of the application that you wish to monitor, for example, http://
<host:port>/maximo/webclient/login/login.jsp.
In a separate browser session, open the URL
http://<host:port>/maximo/webclient/utility/profiler/PerfMon.jsp
Note: Substitute the name of the host and port on which the IBM Tivoli service
management product is installed.
The browser should display the HTTP Request Monitoring Screen similar to the following:
Figure 36: Example HTTP Request Monitoring Screen
At the top of the page there are the following buttons and links:
• View Server Request will let you see the SQL Tracking, SQL Explain Plan and Stack
Trace for each UI request.
• Refresh will retrieve the results of recent activity from the server. Typically, the user
will perform an action in one browser session, and then return to the Performance
Monitor page to view the results.
• Enable will enable profiling if it has been previously been disabled.
• Disable will temporarily disable monitoring until the Enable button is pressed.
• Reset will clear all previous results from the server’s memory. This is typically used to
reduce the amount of information just prior to accessing the function that is to be
monitored.
The Main table has multiple columns, providing information related to each UI Event URL
request response time. The main columns are:
• Monitor Label: Shows information related to IBM Tivoli service management
products UI events link
• Hits: Shows information related to how many time user clicks same link
35

Performance Monitoring Tool (PerfMon)
• Average Ms: Shows Response time in milliseconds.
Clicking on View Server Request will display the SQL, Explain Plan, and Stack Trace
Monitoring Screen similar to the following:
Figure 37: An example SQL, Explain Plan, and Stack Trace Monitoring Screen
The main table has two columns:
The Transaction is a rough approximation of the UI framework event that is sent from the
browser to the server. In some cases, this event is changed slightly to group transactions
that belong to the same application near each other in the list. If in doubt of which
transaction name goes with an action in the IBM Tivoli service management products
browser session, press the Reset button just prior to accessing the action.
The second column contains four basic statistics about that event:
Stmts - This is the number of SQL statements that are issued to the database.
SQL Time - Below the SQL statement count is the total time of the database access. A
high number here is indicative of a performance issue.
Note: It is best not to dismiss database access times that are shown to be fast. Java is very
inaccurate at timing anything less than 50 ms. So if you had 50 SQL Statements that take
40 ms, then this total could very well say 0. This can be misleading, as a more accurate
number may be 2000 ms.
In general it is always best to have the minimum number of SQL statements possible. The
statements can be generated by product code or by code from customizations.
36

Performance Monitoring Tool (PerfMon)
MboSets - The number of MBOSets created as part of the transaction. Following this
number is a break down of the total by MBOSet name. The higher this total number is, the
more SQL statements that are likely to have been generated, and the more memory is
being consumed. This number should be minimized if possible.
Mbos - The number of MBOs created as part of the transaction. Following this number is a
break down of the total by MBO name. The higher this number is the more memory is
consumed. This number should be minimized.
Stack Trace - This link will be enabled based on configuration monitoring. It will provide
Stack Trace information on classes and methods executed during the UI event and SQL
execution.
Clicking on the count of SQL statements will display each of the statements which have
been issued, and the number of times each statement has been used.
The execution time of the statement is shown in [ ].
Figure 38: Showing the execution times
This information can help guide you as to where these statements are coming from, and
also point to potential optimizations. These optimizations could include the use of
strategies such as:
• Combining fetches which are done with several statements into a single fetch
• Caching in memory data which is constantly being fetched and used by the
application.
Clicking on the statement count again will hide this information.
Note: In many parts of the application, the first time an action is accessed can be more
expensive (in terms of time) than subsequent times. An example of this is during the
loading of an application. The first time the application is accessed, the system will retrieve
the screen definition from the database; parse the XML and cache in memory. The lists of
actions to be displayed are also fetched. This happens only once, so subsequent accesses
37

Performance Monitoring Tool (PerfMon)
to the applications do not need to perform these same actions and is much faster. When
trying to monitor any transactions, it is recommended that the transaction is monitored after
the initial invocation.
Although the system will only monitor statistics for transactions once, it monitors every single
transaction in the system. This means the list of transactions displayed on the screen can become
very long. It is recommended the ‘Reset’ button is used to clear the list prior to accessing the
transaction that is to be monitored.
38

Performance Analyst General Usage
APPENDICES
A Performance Analyst General Usage
Spreadsheet-like user interface
Figure 39: Performance analyst - spreadsheet-like user interface
1. Filtering: (global) text filtering, which is helpful for conveniently filter out interested
data only.
2. Show rows with alerts only: quick hand for finding rows with alerts when there are
many rows of data.
3. Searching: (global) searching for specific text, matched cells highlighted in yellow
color.
4. Data Sorting: multi-column sorting also may be sorted in either direction
(forward/reverse). Simply clicking on a column header would sort by that column
(first in reverse order), and clicking the same column header again would toggle
the sort order (reverse->forward, or vice versa). Ctrl-clicking on a column while
already with some column(s) sorted would append this new column into the sort
sequence at the end of sort sequence. Again, ctrl-clicking on the column would
toggle this column's sort order. The number of columns which may be added into
the sorting sequence is unlimited.
5. Column Reordering: simply dragging columns around to re-order the column
position.
39

Performance Analyst General Usage
Context menu
Figure 40: Performance analyst context menu
Many user interface functions are also available in right-click context menu. Column or
rows may be hidden conveniently from context menu, as well as auto-adjusting column(s)
width, clearing filters or sorting.
40

Performance Analyst General Usage
Multiple windows
Figure 41: Performance analyst multiple windows
Opening multiple windows side by side is supported. You may open different performance
data for analysis, or for comparison purpose, you may also open the same performance
data into different, multiple windows to compare to itself. The view menu provides short-
cuts to open a new empty window, to duplication current window content, to arrange
position of all windows current opened.
41

Performance Analyst General Usage
Alerts
Figure 42: Performance analyst alerts
1. Alerts are probably the most useful feature. Rows which contain any cell matching
any defined alert criteria would have its icon added an "alert" decorator in the
upper-right corner of the original icon.
2. Cells which actually match any alert criteria would be marked in red.
3. Hovering the cursor over any such cell or row shows a tooltip containing the actual
applicable alert criteria (for that cell or that row). In the example above, one criteria
"10 < index_read_efficiency" was defined which matched the row circled in red box
(which has value '4385.762' for that column).
4. There were originally 86 rows in total, with 17 of them having alerts. We have
chosen to show only rows with alerts in this screenshot.It is obviously much easier
to find these rows having alerts, instead of scattering among 86 rows.
42

Performance Analyst General Usage
Customization dialog
Figure 43: Performance Analyst customization table
Customization (like filtering, sorting) may be saved for later, future repeated usage. To
open this dialog, simple right click to launch the context menu and select Customise table.
1. Each tab gets its own, separate set of customization profiles. So application tab
has its own set, and so does statement tab.
2. In this dialog, you may save unlimited profiles. Initially, there would be only 3 items
listed in this box. The first 2 are system default, the first one being the 'empty state'
(that is, the state without any customization applied) and the 2nd item being the
currently state of the tool. There should also be the 3rd item which is the state
supplied along with the tool and is marked as 'default'. A 'default' profile is applied
when the tool initially starts. If no profile has been marked 'default', the first 'empty
state' is used instead when the tool starts. To create a new profile, simple click the
'Save Customization' button and specify a new name. The current dialog content is
saved into that new profile. You may also update an existent profile by saving it
into an existent profile.
3. Columns may be marked hidden in customization profile. Sometimes, we are not
interested in only a few columns and showing all columns clutters the user-
interface. In this case, you can mark them as hidden, and they are then not shown
(this also has performance benefits, the fewer the faster). You can use the buttons
43

Performance Analyst General Usage
in the middle to do the work, or drag-n-drop directly to and from the 2 lists. The
column display is also defined here. Again, use buttons or drag-n-drop to order the
columns.
4. Above the 3 selection list in this dialog, there is a search box for easier finding the
desired item. This is handy when you have many columns. Simply enter the text to
search and press 'enter', the first item matched is highlighted. Press 'enter' again
to search for the next match, so on and on.
5. Alerts are also configured here. In this dialog, there is a list of all the alert criteria
currently defined. The actual editing of criteria detail is done in another dialog, this
is introduced in the next section. Here you initiate the addition, removal, or
modification of the selected criteria.
6. The last parts in this dialog are sorter and filter. This is all usually done in the main
user-interface, and is not recommended to be manually edited here (except filter
text). It is suggested to use spreadsheet-like interface to define sorting and filtering
directly, instead of defining them in this dialog (as it is a little cumbersome here).
Profile menu
Figure 44: Performance analyst profile menu
As customization profiles or rules are designed to be used for different situations, a menu
is provided for switching quickly between different customization profiles. There is no need
to go to customization dialog first in order to change the profile applied.
44

Performance Analyst General Usage
Alert criteria editor
Figure 45: Alert criteria editor
In the alert editor, you can define the name and description of the alert criteria, as well as
the criteria itself.
The criteria content is defined in Ruby expression syntax. Normal arithmetic or logical
operators (+, -, *, /, and, or, >, <, ==, != ... etc.) are available. If you are experienced,, a
complex Ruby expression may also be used here. When referring to a specific column, you
enclose it in the form: #{column name}. An easier way is to drag the desired column
directly from the column list below into criteria text box, as shown in
Figure 45. The criteria
is evaluated by this tool at run-time, using the real value from the desired column.
Whenever a criterion evaluates to be true, the alert applies and the column is flagged in the
main window.
45

Performance Analyst General Usage
Alerts may have different levels. The main window shows different levels in different ways,
mostly using different colors. Currently there are 2 levels available: critical and warning.
Critical alerts, if matched, are shown in red color, while warning alerts are shown in yellow.
This may be useful in providing visual clues for pin-pointing the most import alerts first, and
then the next level alerts.
More finer-grained alert level is also defined in this editor. It is very common to have the
same criteria, with different threshold values having different levels. An example would be
buffer pool hit rate criteria. Sometime you may like to define a buffer pool hit rate criteria,
with less than 95% as critical, but less than 98% as warning. To achieve this goal, use
special element "%s" to act as the threshold position in the criteria content, something like:
%s > #{bufferpool.hitrate}
Whenever this editor detects the presence of special element "%s" in the criteria text box,
the upper right hand side "Threshold" boxes would be enabled for defining threshold
values. You can first select level 'critical' and enter '95', and then select 'warning' to enter
'98'.
Figure 46: Threshold levels
Context help
Figure 47: Context help
46

Performance Analyst General Usage
A context-help is provided for looking up the definition of columns, if available. This is
basically a browser which currently direct to DB2 v9 information center (going directly to
the monitor element represented by the selected column).
Plug-in selection dialog
Figure 48: Plug-in selection dialog
Performance analyst has a plug-in architecture. You can choose which plug-in to use
before importing performance data into it.
47

Performance Analyst General Usage
Workspace persistence
Figure 49: Workspace persistence
A special plug-in is provided to save the current workspace state, in order to be used later
to restore the workspace quickly. The time to import and parse very large performance
output data may be very time-consuming, and this plug-in provides a way for
caching/storing the importing result, so next time you do not need to re-parse it again,
without wasting a long time. In addition, the persisted workspace files (*.paw) generally are
much smaller than the original source data files.
There are 2 special short-cuts in the file menu just for this function.
DB2 Monitor Plug-in
Database Manager Tab:
Figure 50: DB2 Monitor Plug-in Database tab
48
Performance Analyst General Usage
Database Manager Tab
Figure 51: DB2 Monitor Plug-in Database Manager tab
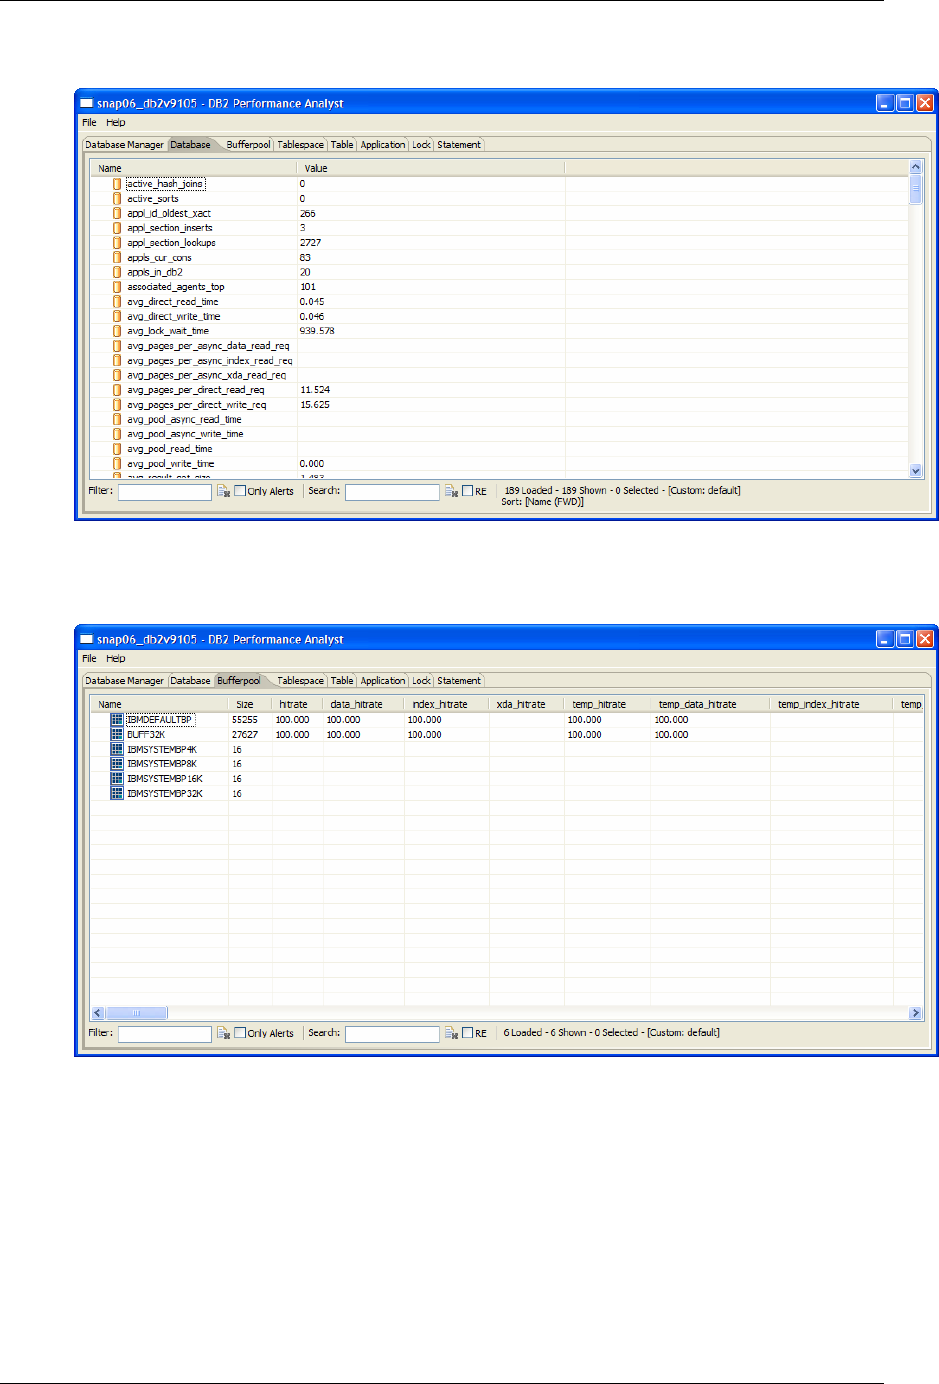
Buffer Pool Tab
Figure 52: DB2 Monitor Plug-in Buffer Pool tab
49

Performance Analyst General Usage
Tablespace Tab
Figure 53: DB2 Monitor Plug-in Tablespace tab
In the tablespace tab, tablespace containers are also shown as the children of
tablespaces.
Table Tab
Figure 54: DB2 Monitor Plug-in Table tab
50

Performance Analyst General Usage
Lock Tab
Figure 55: DB2 Monitor Plug-in Lock tab
Application in Deadlock State
Figure 56: DB2 Monitor Plug-in Application tab
In the application tab, if an application is waiting on a lock which is currently held by
another application, it would be shown as a child under the application holding the lock.
Also, a special lock icon is shown for those applications which are in dead lock state (not
just lock-wait, but actually deadlocked). Deadlock state involves more than one application.
The supplied default configuration profile contains an alert which marks a deadlocked
application in "alert" state. To analyze the detailed deadlock state, it is best to go with the
deadlock event monitor analysis.
51

Performance Analyst General Usage
Statement tab
Figure 57: DB2 Monitor Plug-in Statement tab
The user interface also provides column filtering (in addition to the global filtering in the
lower left text field). It is quite common for a DB2 snapshot monitor to have large amount of
data, which may make the tool slow to operate. Filtering may help speed it up by removing
uninterested data. In the diagram above, column "num_executions" has applied a filter
which removes all rows with 0 (3920 loaded but only 27 shown). The difference in
processing speed is huge in this case.
Deadlock tab
Figure 58: DB2 Monitor Plug-in Deadlock tab
Deadlock tab is specifically used by deadlock event monitor analysis, which provides
detailed information about deadlock situations. This includes all deadlock participants,
52

Performance Analyst General Usage
which locks they were holding at the time the deadlock was detected, and transaction
statement history of each participant (if used "WITH DETAILS HISTORY" mode).
Tivoli’s process automation engine Plug-in
Figure 59: Tivoli’s process automation engine Plug-in
The usual statement view:
Figure 60: Process automation engine Plug-in usual statement view
Grouping statements by object helps to understand the overall impact by each object.
53

Performance Analyst General Usage
Note: The following plug-ins are also included with the Performance Analyst tool. While
they are not specifically used in diagnosing database performance problems, they may be
useful for other performance diagnostics:
Java Dump Plug-in
Thread tab
Figure 61: Java Dump Plug-in Thread tab
Monitor tab
Figure 62: Java Dump Plug-in Monitor tab
Monitor tab shows the relationship between monitor and its owner, as well as threads
currently waiting for it.
1. Monitor type and address.
2. The thread currently holding the monitor. You have thread name, stack trace, and
so on.
3. Threads currently being held and is waiting for the monitor.
54

Performance Analyst General Usage
Java GC Plug-in
Summary tab
Figure 63: Java GC Plug-in Summary tab
This tab provides a quick overview of the whole. Average/peak GC time, average/peak GC
utilization, maximum memory request, and so on.
Invocation tab
The Invocation tab lists all allocation failures contained within the given verbose GC output.
Each root node represents an allocation failure. Under root nodes are the details of
allocation failure, including before/after status of tenured/nursery space, GC statistics. By
default, root nodes are not expanded.
Figure 64: Java GC Plug-in Invocation tab
Figure 65 shows a verbose GC of using 'gencon' policy.
55

Performance Analyst General Usage
1. You can expand an allocation failure to see its details.
2. The garbage collection child shown here (it is of type 'scavenger' here) shows the
details of what has been done during this garbage collection interval.
3. This shows the memory status before GC is carried out.
4. This shows the memory status after GC is done.
Figure 65: Example of a verbose GC using 'gencon' policy
Figure 65 shows a verbose GC using 'optthroughput' policy.
1. The allocation failures here are of type 'tenured'.
2. The garbage collections here are of type 'global'. They contain the timing
information of the 3 phases: mark, sweep, compact. Note that the child (garbage
collection) information is carried up to the parent node, so there is no need to
always expand root nodes.
56

Performance Analyst General Usage
JLM Plug-in
The JLM plug-in imports
Performance Inspector JLM outputs. This plug-in is also special in
that it can further intermix JLM outputs with a set of thread dumps, in order to pin-point the
source location of a monitor's usage.
JLM Java Monitor Tab
Figure 66: JLM Plug-in Java Monitor tab
1. Just like in normal JLM outputs, each row here represents a monitor with various
attributes. Unlike plain-text JLM outputs, sorting (multi-column), searching, and
filtering are available.
2. If companion thread dumps are also given, the monitor's owner thread, if any, are
shown as a child of the monitor. A monitor's owner thread has its thread stack
trace revealed as well.
3. Same as owner threads, if there are threads currently waiting for this monitor, they
are shown as children of the monitor.
4. Column 'mon_obj_type' indicates the type of monitor objects. For threads, this
column shows thread stack trace.
5. The default rule sorts monitors by column 'slow', which is more convenient than
JLM output's default 'miss-rate'.
6. Alerts are available as usual.
57

Performance Analyst General Usage
JLM System Monitor Tab
Figure 67: JLM Plug-in System Monitor Tab
CSV Plug-in
Figure 68: CSV Plug-in
The CSV plug-in is used to load an iostat output in CSV file format. Column headers are
fetched from the first line of the input file.
58

OQT General Usage
B OQT General Usage
Optim Query Tuner is built on the Eclipse platform, so if you are familiar with Eclipse, you
should find the OQT user interface to be easy to use:
Access Path
Graph
Access Path
Graph
Query
Report
Query
Report
Index
Advisor
Index
Advisor
Query
Advisor
Query
Advisor
User Interface
User Interface
Eclipse
Eclipse
Statistics
Advisor
Statistics
Advisor
Access Path
Advisor
Access Path
Advisor
Formatter
Formatter
Annotation
Annotation
Query Based Tools and Advisors
Query AdvisorsQuery Tools
DB2 LUW
Query
Report
Query
Report
Query
Advisor
Query
Advisor
Figure 69: Optim Query Tuner window
From the main window of OQT, you will see the following views:
• Database Source Explorer: Used to setup database connections
• Project Explorer: Used to save tuned queries and the analysis result history
• Query Tuner: Used to enter/alter the query and to select tuning. This view also
provides analysis result views and summary report views.
The bottom pane contains views to denote what is enabled, capturing queries, SQL results,
and status of executions of tuning and statements, see
Figure 70 .
59

OQT General Usage
Figure 70: Optim Query Tuner views
Create and Configure the Connection
Before being able to perform query tuning, you must:
• Activate the license on the LUW Server using:
o DROP FUNCTION DB2OE.QT_LIC;
o CREATE FUNCTION DB2OE.QT_LIC() RETURNS VARCHAR(12) LANGUAGE
SQL CONTAINS SQL NO EXTERNAL ACTION DETERMINISTIC RETURN
VARCHAR('QT_V22');
o GRANT EXECUTE ON FUNCTION DB2OE.QT_LIC TO PUBLIC WITH GRANT
OPTION;
• Set the DB2COMM to TCPIP using:
o db2set DB2COMM=TCPIP
o db2stop
o db2start
• Select a port number not used on the server and set:
o DB2 UPDATE DBM CFG USING SVCENAME <port_number>
o db2stop
o db2start
• Optionally, create explain tables
• Create a connection using the Data Source Explorer
o Right click and select NEW
o Pick LUW and setup the database name, the hostname, the port setup for
SVCENAME, and the userid and password (can also use Kerberos or
client authentication)
60

OQT General Usage
Figure 71: Data Source Explorer configuration
Configuring the connection for OQT
Once a connection is setup, then right click to connect:
Figure 72: Configuring the connection for OQT
61

OQT General Usage
To setup explain tables and the special Index Advisor stored procedure, a new connection
must be configured, see
Figure 73:
Figure 73: Configuring a new connection
Advanced Configuration
Advanced configuration allows the user to enable the explain tables if they do not exist and
to enable the Index Advisor stored procedure. Use the “Enable” buttons if the
corresponding items are red. Note that the OQT license needs to be set to allow all
advisors to be used.
When everything is enabled and the OQT license is setup, you will see the following on the
Query Tuner tab:
Figure 74: OQT Query Tuner tab
62

OQT General Usage
The Features tab should look like the following:
Figure 75: OQT Features tab
Starting a Query Tuner Session
Right click on the database name and select Query TunerÆStart Tuning to start:
Figure 76: Starting a Query Tuner Session
63

OQT General Usage
Workflow Editor
The workflow editor provides information on the status of the advisors. It also provides the
mechanisms for capturing a query, invoking the tuning features, and showing the
recommendations.
Figure 77: Workflow Editor functions
64
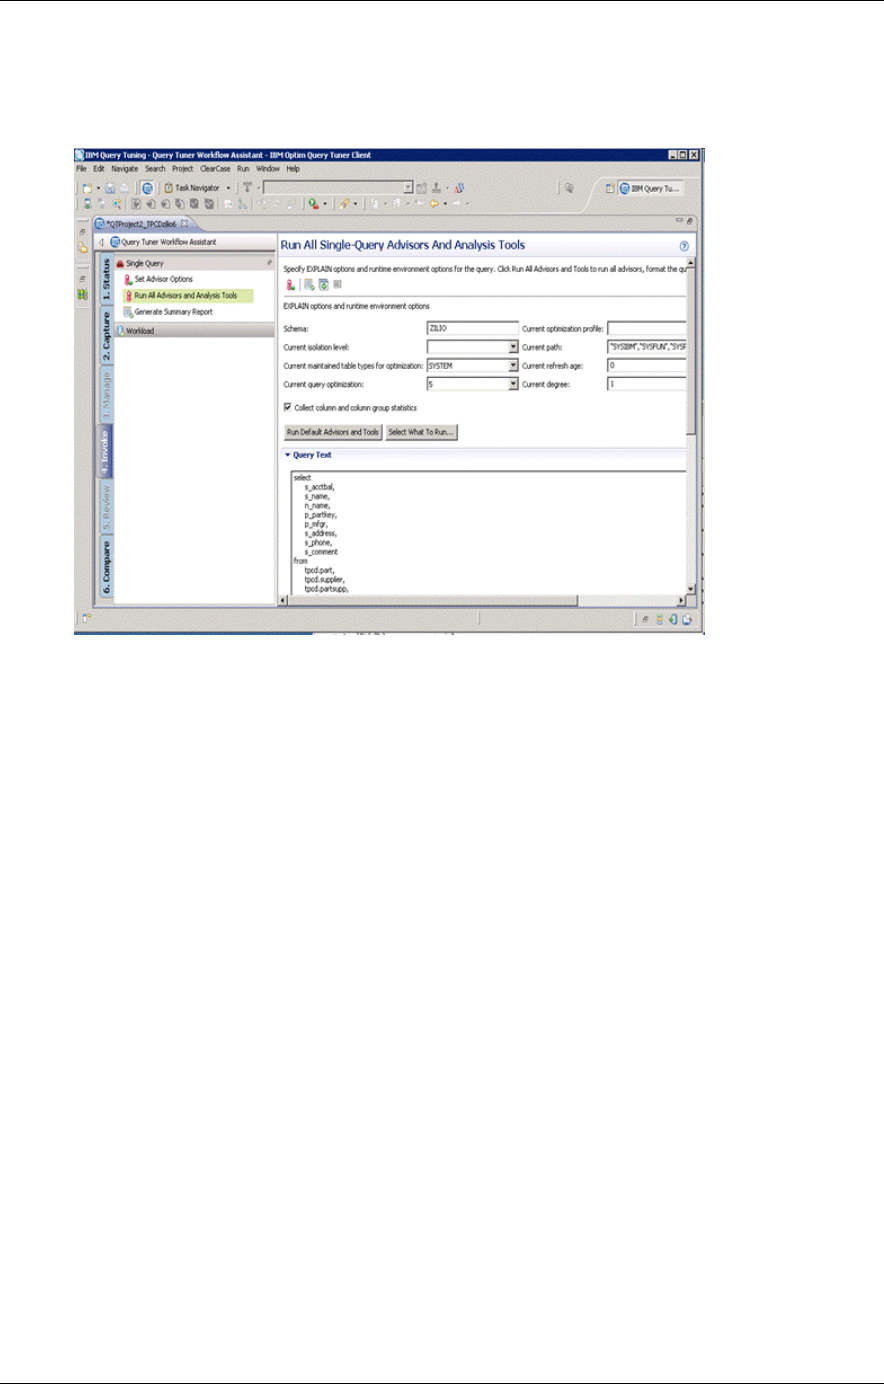
OQT General Usage
Invoking the Tuning Features
The Invoke view allows a user to configure the registers used in explaining the statement
and the features using “Set Advisor Options”. This view runs all or specific advisors.
Figure 78: Invoking the Tuning Features
65

OQT General Usage
Tailoring the Advisor Executions
Each advisor can be tailored. For example, the memory limit for the index advisor can be
set:
Figure 79: Tailoring the Advisor Executions
66

OQT General Usage
Execute Advisors and Tools
You can select the advisors and tools to run:
Figure 80: Execute Advisors and Tools
• Query Annotation: Formats and breaks down the elements of the query.
• Access Plan Graph: Obtains the view of the access plan and can optionally run the
statement to collect actual cardinalities to display with estimates (requires DB2
9.7.1 or later).
• Statistics Advisor: Provides recommendations on the best statistics to capture to
influence access path selection.
• Query and Access Path Advisor: Presents recommendations on how to rewrite the
query or modify items affecting the query access plan to provide a better
performing plan.
• Index Advisor: Recommends any additional indexes that can reduce the number of
scans.
• Summary Report: Reports information on the plan, tables, predicates, and other
recommendations.
Query Analysis Results
When viewing query analysis results, the priority states how important the recommendation
is. Very low priority recommendations are considered “maintenance only”
recommendations.
67

OQT General Usage
Note that Index Advisor recommendations are always low by design, since adding
additional indexes should be done with caution to avoid having negative impact on inserts
and updates.
Figure 81: Query Analysis Results
Query Format
Viewing the formatted query and the query breakdown information can help you spot
human error and identify where filtering should occur. Selecting part of the query highlights
all related occurrences.
Figure 82: Query Analysis Results
Access Plan Graph
The access plan graph allows the user to visualize the flow of query processing, to see the
associated indexes and operations, and to understand the rationale the DB2 Optimizer
takes for the query. It also allows you to assess the access path stability to reduce the risk
of performance issues. For example:
• Is the optimizer able to apply the filtering early?
68

OQT General Usage
• Are there indexes that support an efficient path?
• Do statistics allow distinction between the choices?
Figure 83: Access Plan Graph
Statistics Advisor
The statistics advisor provides advice on missing statistics, conflicting statistics, and out-of-
date statistics, resulting in more accurate estimated costs, better query performance, less
CPU consumption, and improved maintenance window throughput.
Figure 84: Statistics Advisor
69

OQT General Usage
Query Advisor
The query advisor provides advice on rewriting a SQL query to make it more efficient. Note
that query changes can only be applied manually.
Figure 85: Query Advisor
Access Path Advisor
The access path advisor identifies potential access path issues in the query plan by
investigating the access plan and applying rules. Like the query advisor, access plan
changes can only be applied manually.
Figure 86: Access Path Advisor
70

OQT General Usage
Index Advisor
The index advisor helps improve query efficiency by indexing foreign keys in queries that
do not have indexes defined, identifying index filtering and screening, and indexing to avoid
sorts. Recommendations consist of:
• Consolidation of similar indexes to provide a single recommendation
• Providing DDL to create indexes that can be run immediately or saved
• Providing an overall estimated performance improvement compared to not having
the recommendation applied
• Showing the total disk space used by the new indexes in the recommendation
• Showing the list of new recommendations sorted by table and including the column
list and size per index
• Providing a list of existing indexes still found to be used by the statement
Figure 87: Index Advisor
71


®
© Copyright IBM Corporation 2010
IBM United States of America
Produced in the United States of America
US Government Users Restricted Rights – Use, duplication or disclosure restricted by GSA ADP Schedule Contract with
IBM Corp.
IBM may not offer the products, services, or features discussed in this document in other countries. Consult your local IBM
representative for information on the products and services currently available in your area. Any reference to an IBM
product, program, or service is not intended to state or imply that only that IBM product, program, or service may be used.
Any functionally equivalent product, program, or service that does not infringe any IBM intellectual property right may be
used instead. However, it is the user's responsibility to evaluate and verify the operation of any non-IBM product, program,
or service.
IBM may have patents or pending patent applications covering subject matter described in this document. The furnishing of
this document does not grant you any license to these patents. You can send license inquiries, in writing, to:
IBM Director of Licensing
IBM Corporation
North Castle Drive
Armonk, NY 10504-1785
U.S.A.
The following paragraph does not apply to the United Kingdom or any other country where such provisions are
inconsistent with local law:
INTERNATIONAL BUSINESS MACHINES CORPORATION PROVIDES THIS PAPER “AS IS” WITHOUT WARRANTY OF
ANY KIND, EITHER EXPRESS OR IMPLIED, INCLUDING, BUT NOT LIMITED TO, THE IMPLIED WARRANTIES OF
NON-INFRINGEMENT, MERCHANTABILITY OR FITNESS FOR A PARTICULAR PURPOSE. Some states do not allow
disclaimer of express or implied warranties in certain transactions, therefore, this statement may not apply to you.
This information could include technical inaccuracies or typographical errors. Changes may be made periodically to the
information herein; these changes may be incorporated in subsequent versions of the paper. IBM may make improvements
and/or changes in the product(s) and/or the program(s) described in this paper at any time without notice.
Any references in this document to non-IBM Web sites are provided for convenience only and do not in any manner serve
as an endorsement of those Web sites. The materials at those Web sites are not part of the materials for this IBM product
and use of those Web sites is at your own risk.
IBM may have patents or pending patent applications covering subject matter described in this document. The furnishing of
this document does not give you any license to these patents. You can send license inquiries, in writing, to:
IBM Director of Licensing
IBM Corporation
4205 South Miami Boulevard
Research Triangle Park, NC 27709 U.S.A.
All statements regarding IBM's future direction or intent are subject to change or withdrawal without notice, and represent
goals and objectives only.
This information is for planning purposes only. The information herein is subject to change before the products described
become available.
If you are viewing this information softcopy, the photographs and color illustrations may not appear.
DB2, IBM, Maximo, Optim, Performance Inspector, Service Request Manager, Tivoli, and WebSphere are trademarks or
registered trademarks of International Business Machines Corp., registered in many jurisdictions worldwide. Other product
and service names might be trademarks of IBM or other companies. A current list of IBM trademarks is available on the
Web at “Copyright and trademark information” at www.ibm.com/legal/copytrade.shtml.

Java and all Java-based trademarks and logos are trademarks of Sun Microsystems, Inc. in the United States, other
countries, or both.
Linux is a registered trademark of Linus Torvalds in the United States, other countries, or both.
UNIX is a registered trademark of The Open Group in the United States and other countries.
Microsoft, Windows, Windows NT, and the Windows logo are trademarks of Microsoft Corporation in the United States,
other countries, or both.
Other company, product, or service names may be trademarks or service marks of others.
74
