
*050205120* Rev 1
Predicting Long-Term
College Success through
Degree Completion Using
ACT
®
Composite Score, ACT
Benchmarks, and High School
Grade Point Average
Justine Radunzel
Julie Noble
August 2012
ACT Research
Report Series
2012 (5)
For additional copies, write:
ACT Research Report Series
P.O. Box 168
Iowa City, IA 52243-0168
© 2012 by ACT, Inc. All rights reserved.
Predicting Long-Term College Success through Degree
Completion Using ACT
®
Composite Score, ACT
Benchmarks, and High School Grade Point Average
Justine Radunzel
Julie Noble
ii
Abstract
This study compared the effectiveness of ACT
®
Composite score and high school grade
point average (HSGPA) for predicting long-term college success. Outcomes included annual
progress towards a degree (based on cumulative credit-bearing hours earned), degree completion,
and cumulative grade point average (GPA) at 150% of normal time to degree completion (year 6
and year 3 for four- and two-year institutions, respectively). The utility of the individual ACT
College Readiness Benchmarks for predicting long-term college success was also evaluated.
Data for this study included over 190,000 ACT-tested students who enrolled in college as
first-time entering students in fall, 2000 through 2006. Over 100 total two- and four-year
institutions were represented. Hierarchical logistic models were used to estimate institution-
specific probabilities of college success based on ACT scores and HSGPA. First-year college
GPA was also included as a predictor in the path analysis models. Accuracy and success rates
were calculated using the distributions of ACT scores and HSGPA for each institution’s
approximate applicant pool; rates were then summarized across institutions. Direct and indirect
effects of ACT score, HSGPA, and first-year academic performance on subsequent college
outcomes were also examined. Results were disaggregated by institution type.
Both ACT Composite score and HSGPA were effective for predicting long-term college
success at both four- and two-year institutions. Across the outcomes, test scores increased
prediction accuracy over that for HSGPA alone. ACT scores and HSGPA were primarily
indirectly related to subsequent college outcomes (through first-year college GPA). The ACT
Benchmarks were also found to be useful for predicting long-term college success, providing
further validity evidence for using them as measures of college readiness.
iii
Acknowledgments
The authors thank Jeff Allen, Jill Crouse, and Richard Sawyer for their helpful comments and
suggestions on an earlier draft of this report.
Predicting Long-Term College Success through Degree Completion Using ACT Composite
Score, ACT Benchmarks, and High School Grade Point Average
Introduction
There are several student measures that are typically considered in the admissions
process, largely because they have been found to identify accurately students who are ready for
college and to predict students’ eventual success in college. The top four measures identified by
four-year postsecondary institutions (Clinedinst, Hurley, & Hawkins, 2011) are academically
related and include grades in college preparatory courses, strength of high school curriculum,
standardized test scores (ACT or SAT), and high school grade point average (HSGPA). But,
many institutions also use other non-academic measures (e.g., extra-curricular activities and
demonstrated interest in the institution) in making admission decisions. They do this to meet
other goals that are not directly related to academic success but that closely align with their
educational mission, such as maintaining equal opportunity and diversity in student enrollments.
While most two-year institutions currently practice open admissions, about one-fifth of them use
standardized test scores or HSGPA as part of their admission process (Breland, Maxey, Gernand,
Cumming, & Trapani, 2002).
In this report, we focus on the use of pre-enrollment achievement measures to identify
students who are likely to be successful in college, recognizing that this addresses only one
aspect of the admission process. In order to evaluate the effectiveness of these measures, the
outcome(s) of interest need to be identified. For making admission decisions, one outcome that is
commonly used is first-year academic performance, as measured by first-year college grade
point average (GPA). But, as pressure for increased accountability in higher education and
higher graduation rates continues, institutions are considering outcomes beyond the first year of
college, including persistence, academic performance, and degree completion. For example, a
2
recent report from the Higher Education Research Institute (2011) refers institutions to a degree
completion calculator available on their website that calculates expected degree completion rates
based on student characteristics of their incoming freshman class. Another study (Saupe & Curs,
2008) discussed a procedure for developing four enrollment management scores, one of which
was a graduation score intended to predict whether a student would graduate within six years of
enrolling.
Two-year institutions also feel the pressure to increase graduation rates. Due to the
reduced resources available to them, some are having to prioritize access; restrict enrollment;
eliminate lower-level, remedial courses; and identify students who are likely to graduate or
transfer to a four-year institution (González, 2012). In addition, they are being encouraged to
evaluate intermediate outcomes that measure progress towards degree completion to help
determine the reasons why so many students are not completing degrees (Moore, Shulock, &
Offenstein, 2009).
Historically, numerous studies have consistently demonstrated that ACT scores and
HSGPA are valid measures of early college success, defined as first-year college GPA and/or
first to second year retention (Allen & Robbins, 2010; Allen, Robbins, Casillas, & Oh, 2008;
Noble & Radunzel, 2007; Robbins, Allen, Casillas, Peterson, & Le, 2006). In a recent study of
50 four-year institutions, Westrick, Le, Robbins, Radunzel, and Schmidt (2012) found that the
estimated mean correlation with first-year college GPA across institutions was 0.51 for ACT
Composite (ACTC) score and 0.58 for HSGPA, after adjusting for range restriction. Sackett,
Kuncel, Arneson, Cooper, & Waters (2009) found a similar correlation between SAT scores and
first-year college GPA, after controlling for socioeconomic status. Sawyer (2010) reported that
the multiple correlations of high school subject-area grade averages and ACT scores with first-
3
year college GPA were higher when scores and grades were used jointly than when they were
used separately.
Several studies have gone beyond examining correlations to evaluate the estimated
effects of using these two measures for making admission decisions, with first-year college GPA
as the outcome under consideration. For example, two studies (Sawyer, 2010; Noble & Sawyer,
2002) found that HSGPA was slightly more accurate (as measured by the estimated percentage
of correct classifications) for predicting first-year success at GPA thresholds of 2.00, 2.50, and
3.00, and the ACTC score was slightly more accurate for predicting success at thresholds of 3.50
and 3.75. Across the different college GPA thresholds, using ACTC score and HSGPA in
combination resulted in greater prediction accuracy, and was more effective for identifying
successful students among those who would be expected to be successful, relative to using them
separately. This latter finding demonstrates the incremental validity of test scores for predicting
first-year academic performance. Sawyer (2010) also pointed out that HSGPA was a much
stronger predictor of first-year GPA among students with higher ACTC scores than among those
with lower scores. A similar result also held for ACTC score among students with higher
HSGPAs.
The ACT College Readiness Benchmarks (in English, mathematics, reading, and science)
have also been shown to be predictive of early college success. The Benchmarks are the
minimum ACT test scores required for students to have a high probability of success in first-
year, credit-bearing college courses—English Composition, College Algebra, social sciences
courses, and Biology (Allen & Sconing, 2005), and provide an empirical definition for college
readiness. Students who meet the Benchmark have approximately a 50% chance of earning a B
or better and approximately a 75% chance of earning a C or better in the corresponding college
4
course or courses (ACT, 2010a). The Benchmarks were identified as the typical scores across
both two- and four-year postsecondary institutions that maximized the accuracy for predicting
success (defined as earning a grade of a B or higher) in the corresponding courses. Meeting the
Benchmarks has also been shown to be positively associated with early college outcomes, such
as immediately enrolling in college the fall following high school graduation, persisting to the
second year at the same institution, and achieving a 2.00 or higher, or 3.00 or higher, first-year
college GPA (ACT, 2010b). Students who meet the Benchmarks are also less likely than those
who do not meet the Benchmarks to take remedial coursework in English or mathematics.
A recent study (Radunzel & Noble, 2012) found that students who met the individual ACT
Benchmarks were substantially more likely than those who did not meet the Benchmarks to
persist in college through degree completion and to earn a degree in a timely manner. Moreover,
as the number of ACT Benchmarks met increased, students’ likelihood of achieving these
outcomes also increased. The study also found that students with higher ACTC scores had higher
success rates than those with lower scores; a similar result held for HSGPA. These findings were
seen for students attending four-year institutions, as well as for those attending two-year
institutions.
In a review of the literature, Moore and Shulock (2009) cited several studies documenting
that first-year college GPA is also predictive of degree completion. These studies suggested that
pre-college measures, such as standardized test scores and HSGPA, appear to influence degree
completion primarily by virtue of their effect on first-year college academic performance.
In this study, we extend prior research on the topic of using ACT scores and HSGPA for
making admission decisions by focusing on long-term college outcomes through degree
5
completion and applying the same methodology used in Sawyer (2010) and Noble and Sawyer
(2002). In particular, in this study we investigate
the maximum accuracy of ACTC score and HSGPA used alone and jointly for predicting
long-term college success. We also estimate the percentages of students who would be
successful from among those who are expected to be successful (selected).
the usefulness of the ACT College Readiness Benchmarks in each of the subject areas for
predicting long-term college success, thus providing further validity evidence for using
them as measures of college readiness. The percentages of successful students based on
those with scores at or above the Benchmarks are compared to those associated with
ACTC or HSGPA values that maximize the percentage of correct classifications.
the utility of ACTC score and/or HSGPA for predicting long-term college success, given
first-year college GPA. For this objective, we estimate the direct, indirect, and total
effects of ACTC score, HSGPA, and first-year academic performance on subsequent
college outcomes.
Because a majority of two-year institutions have open admissions policies, prior studies of
this nature have included the results for four-year institutions only. But, in light of the growing
concerns for open access remaining the norm at two-year institutions (González, 2012), this
research topic is relevant and timely. Therefore, as an initial look, we also examine these issues
for two-year institutions. Though some of the long-term outcomes differ between the two types
of institutions (e.g., degree types), we compare their results at common achievement levels to
evaluate the utility of ACTC score, HSGPA, and the ACT Benchmarks as college readiness
indicators and for predicting long-term college success for all students, regardless of whether
they initially apply to a two- or four-year institution.

6
Data
Data for this study included approximately 194,000 ACT-tested students who enrolled in
college as first-time entering students in fall, 2000 through 2006. Over 100 institutions were
represented, including all public institutions from two state systems. Four-year institutions
included in the study were required to have at least six years of follow-up data available on their
students so that six-year bachelor’s degree completion rates could be evaluated for a given
cohort. Two-year institutions were required to have at least three years of follow-up data
available so that three-year associate’s degree completion rates could be evaluated for a given
cohort.
Postsecondary institutions make admission decisions about applicants. Therefore, to
study the usefulness of using ACTC score, HSGPA, and the ACT Benchmark scores for
informing college admission decisions, we also included over 505,000 students who sent their
ACT scores to study institutions during the same time frame but did not enroll there.
1
Nonenrolled students who sent scores to an institution, plus those who actually enrolled in an
institution, comprised the “applicant pool” for that institution. The applicant pools for the
institutions in this study approximate actual applicant pools. Students may send their ACT scores
to any number of institutions, but actually apply to only a subset of them. Conversely, some
students may apply to some institutions without submitting official ACT score reports. The
analyses in this report are based on data from all score senders; they are considered to be proxies
for “applicants.”
College outcomes included annual progress to degree (based on cumulative hours
earned), degree completion, and cumulative GPA at 150% of normal time to degree completion
1
Nonenrolled students were identified from the 2000 to 2006 ACT-tested high school graduate histories. These
students requested that their ACT scores be sent to at least one of the 104 institutions included in this study during
the same time period as that for enrolled students.

7
(at the end of year 6 for four-year institutions and the end of year 3 for two-year institutions).
Analyses were done separately by institution type, where type was defined at time of initial
enrollment. However, some institutions provided data for some but not all of the outcomes. As a
result, the number of institutions and enrolled students with available data differed by college
outcome (Table 1). Multiple freshman cohorts of students from an institution were combined
together in the analyses (cohorts 2000 to 2003 for four-year institutions and cohorts 2000 to 2006
for two-year institutions).
Table 1
Sample Sizes for Total Group of Students and Enrolled Students with Available College
Outcomes by Type of Institution
Outcome variable Two-year institutions Four-year institutions
Total
Number of institutions 43 61
Number of enrolled students 67,816 125,911
Number of nonenrolled students 84,407 420,629
Number of students in applicant pool 152,223 546,540
Cumulative hours earned
Number of institutions
Number of enrolled students
42
62,407
50
111,691
Cumulative GPA
a
Number of institutions
Number of enrolled students
42
28,868
57
68,662
Degree completion
Number of institutions
Number of enrolled students
43
67,816
61
125,911
Degree completion plus transfer
Number of institutions
Number of enrolled students
40
66,129
NA
Note. Sample sizes by college outcome are for enrolled students with available data on the outcome and provide
counts of the numbers of students used to estimate the hierarchical logistic models. Slight fluctuations in the
numbers of enrolled students and numbers of institutions by outcome are due to missing data for individual students
or entire institutions.
a
Cumulative GPA was evaluated at year 3 for two-year institutions and at year 6 for four-year institutions.
8
Progress to degree was based on cumulative credit-bearing hours earned at the end of
each spring term, and measured whether the student was making progress towards degree
completion. For dropouts and stopouts, the last value for cumulative hours earned was carried
forward. For four-year institutions, end-of-year cumulative hours thresholds were 24, 48, 72, and
96 earned credit hours for years 1, 2, 3, and 4, respectively, approximating bachelor’s degree
completion in about five years. For two-year institutions, end-of-year cumulative hours
thresholds were 18, 36, and 54 credit hours earned for years 1, 2, and 3, respectively,
approximating associate’s degree completion in slightly over three years.
For degree completion, we evaluated earning a bachelor’s degree within six years of
initial enrollment at a four-year institution and earning an associate’s degree within three years at
a two-year institution. In addition, for two-year institutions from two state systems, we evaluated
associate’s degree completion or transfer to an in-state four-year institution within three years of
initially enrolling in college. Given the data sources available for this study, we focused on
degree completion from the initial institution.
Cumulative GPA was evaluated at the end of year 6 for four-year institutions and at the
end of year 3 for two-year institutions (referred to in this report as the year 6/year 3 cumulative
GPA). Cumulative GPAs at degree completion were included in these analyses for students
graduating before the end of year 6 for four-year institutions or year 3 for two-year institutions.
Cumulative GPAs were initially evaluated at the following levels: 2.50 or higher, 3.00 or higher,
3.25 or higher, 3.50 or higher, and 3.75 or higher. However, results for the 2.50 or higher college
criterion were not included in this report because very few students had year 6/year 3 cumulative
GPAs below 2.50.

9
The sample for the study does not represent students or institutions nationally. A large
majority of both the two- and four-year institutions came from the North Central accrediting
region (Table 2). Moreover, most of the four-year institutions and all of the two-year institutions
were public institutions.
2
The four-year institutions varied in admissions selectivity, though the
majority (75%) had traditional or selective admissions policies.
Table 2
Percent of Two- and Four-Year Institutions by Institutional Characteristic
Institutional characteristic
Two-year institutions
(n = 43)
Four-year institutions
(n = 61)
Affiliation
Public
Private
95
5
74
26
Selectivity
Selective/highly selective
Traditional
Liberal/open
Unknown
0
5
95
0
26
57
11
5
Accrediting region
North Central
Southern
Northwestern
Middle States
Unknown
95
0
0
2
2
80
16
3
0
0
Locale
Urban
Suburban
Small city
Small town
9
14
16
60
23
18
39
20
Note. Percentages may not sum to 100 percent due to rounding.
The pre-enrollment measures used in this study included ACTC score, HSGPA, and the
ACT College Readiness Benchmarks. The ACT Composite score is the rounded arithmetic
2
In fall 2003, approximately three-fourths and nearly one-half of four- and two-year institutions in the United
States, respectively, were private institutions (Knapp, Kelly-Reid, Whitmore, Wu, Gallego, Cong, Berzofsky, Huh,
Levine, & Broyles, 2005).
10
average of the four subject area scores (English, Mathematics, Reading, and Science). Test
scores are reported on a scale of 1 to 36. If students took the ACT more than once, only the most
recent results were used. HSGPA was based on student’s self-reported coursework taken in 23
specific courses in English, mathematics, social studies, and science and the grades earned in
these courses. The ACT College Readiness Benchmarks correspond to scores of 18, 22, 21, and
24 on the ACT English, Mathematics, Reading, and Science tests, respectively (Allen &
Sconing, 2005).
Method
For each institution, mean ACTC scores and HSGPAs, as well as the corresponding
standard deviations (SDs) were computed for enrolled students and the entire applicant pool.
Mean cumulative GPAs and success rates were calculated by institution for enrolled students.
Distributions of the means and rates of these variables were then summarized across institutions
using minimum, median, and maximum values.
Hierarchical logistic models estimated progress to degree, cumulative GPA, and degree
completion rates for enrolled students from the pre-enrollment measures. Hierarchical models
account for students clustered within institutions and allow the estimated college outcome
success rates to vary across institutions. Separate models were developed by year for each
relevant outcome and by institution type (two- vs. four-year). In all cases, we estimated random
slope and intercept models.
Models were estimated for predicting college success based on (a) ACTC score, (b)
HSGPA, (c) ACTC score and HSGPA used jointly, and (d) individual ACT subject area scores.
The ACTC score and HSGPA joint model was evaluated with and without the interaction
11
between these two measures. Nearly all of the interaction terms were statistically significant at
the 0.01 level.
Clearly, a student’s likelihood of being successful in college is based on multiple
predictors, including cognitive and non-cognitive factors, as well as sociodemographic factors
(Allen & Robbins, 2010). ACT does not advocate making college success predictions solely on
the basis of a single measure, such as a test score. The use in this paper of one or two predictors
is a mathematical simplification. The methods used here, such as those used with the ACTC and
HSGPA joint model, could be generalized to multiple measures. The usefulness of these two
measures for predicting long-term success is evaluated from the perspective of accurately
distinguishing students who are likely to be successful from those who are not. In particular, the
methodology used here is based on statistical decision theory (Sawyer, 1996) for validating
educational selection decisions; the method frames validity evidence in terms of probable
outcomes, given the ACT score or HSGPA and the outcome criteria used. The methodology used
is the same as that used by ACT for helping institutions make course placement decisions.
For each predictor (or predictor combination) at institution-specific values we estimated
three decision-based statistics for making admission decisions:
1. the maximum percentage of correct classifications (maximum accuracy rate (maxAR)),
2. the percentage of successful students among those who would be expected to be
successful (success rate (SR)), and
3. the increase in the percentage of correct classifications over expecting all applicants to be
successful (increase in accuracy rate (∆AR)).

12
The latter two statistics were evaluated at the institution-specific predictor value that maximized the
percentage of correct classifications. In this report, we refer to the predictor value associated with
the maxAR as the “selection value.”
Correct classifications include students at or above a given predictor (selection) value who
were successful and students below the value who would have not been successful. For predictors
that are positively related to success, it can be shown that the predictor value that maximizes the
percentage of correct classifications corresponds to a 0.50 probability of success for a given model.
For the two-predictor model, multiple combinations of ACTC score and HSGPA corresponding to a
probability of success of 0.50 were identified. Probability distributions that cross 0.50 will yield
accuracy rate distributions that increase to a maximum and then decrease. If the probability
distribution for an institution does not cross 0.50, the maxAR is generally not interpretable, and the
model is therefore considered a “nonviable model” for an institution. Models for institutions with
probability curves crossing 0.50 are referred to here as “viable models.”
If there were no selection procedure (i.e., if all students were selected, regardless of their
ACTC score and/or HSGPA), a certain percentage of them would be successful. This percentage
is referred to as the “baseline” accuracy rate. The arithmetic difference between the maxAR and
the baseline accuracy rate represents the increase in accuracy rate (∆AR) that results from using
test scores or HSGPA. Large ∆ARs correspond to a greater contribution by the pre-enrollment
measures in increasing the percentage of correct classifications.
MaxARs, SRs, and ARs were calculated for each institution with a viable model. These
statistics were generated using the institution-specific parameter estimates from the hierarchical
models and the distributions of ACT scores and HSGPA for each institution’s applicant pool.
3
3
The institution-specific estimated conditional probabilities of success for nonenrolled students were assumed to be
the same as those for enrolled students.

13
Distributions of these statistics were then summarized across institutions using minimum,
median, and maximum values. Results across institutions with viable models for each individual
predictor/outcome combination are presented in this paper.
4
Results across institutions with
viable models for both predictors were similar to these. For comparison purposes, the median
percentages of students with scores below the selection values associated with the maxAR were
also reported. (Note: 100 minus this percentage gives the percentage of students in the applicant
pool at or above the selection value). For a more complete description of the methodology used
(including the assumptions being made) to evaluate the usefulness of pre-enrollment measures in
the admissions process, see the full ACT research report by Sawyer (2010).
To study the utility of the ACT College Readiness Benchmark scores for predicting long-
term college success, SRs were estimated at the Benchmark scores for each institution, regardless of
whether or not the probability curve for the institution crossed 0.50. Increases in SRs (denoted by
SRs) were also estimated to evaluate the usefulness of the predictor variable for increasing SRs
over baseline success rates. Distributions of SRs and SRs were summarized across institutions
using minimum, median, and maximum values. Median SRs at each ACT Benchmark were
compared to those at the institution-specific ACTC or HSGPA values associated with the maxAR
(the latter based on institutions with viable models only).
Path analysis was used to estimate the effects of ACTC score, HSGPA, and first-year
college GPA jointly on subsequent college outcomes for enrolled students. First-year GPA was the
cumulative GPA from the end of the spring term of the student’s first year of college. Figure 1
shows the hypothesized path model for each college outcome.
4
Across college outcomes, median decision-based statistics were comparable for the joint models with and without
the interaction. Therefore, median statistics based on the model with the interaction are presented in this report.

14
Figure 1. Path model evaluated. ACTC = ACT Composite; HSGPA = high school grade point
average; GPA = grade point average.
The path model included two regression models, as well as the correlation between
ACTC score and HSGPA. The first model regressed first-year college GPA on ACTC score and
HSGPA. The second model regressed the college outcome of interest (e.g., degree completion)
on ACTC score, HSGPA, and first-year GPA. Hierarchical linear regression was used to estimate
the models for continuous outcomes and hierarchical logistic regression was used for binary
outcomes (the only college outcome that was not binary in these analyses was year 6/year 3
cumulative GPA). The fixed effects coefficients from the hierarchical models were standardized
for comparative purposes. The method described by MacKinnon and Dwyer (1993) and Jasti,
Dudley, and Goldwater (2008) for standardizing coefficients was applied when the outcome
variable was binary.
An indirect effect for a specific path is found by taking the product of the standardized
coefficients from each of the regressions that comprise the path. The total indirect effect of a
predictor is found by summing all indirect effects across the various possible paths. Paths
connecting two correlated variables are included as indirect paths. Adding the total indirect effect
and the direct effect gives the total effect of the predictor.
HSGPA
First-year
GPA
College
success
ACTC
score
15
Some students omitted responses to high school coursework and grade items when they
completed the ACT registration materials. Multiple imputation was used to estimate missing
values; 12% of enrolled students and 11% of nonenrolled students had missing HSGPA. Five
data sets were imputed. Models were developed for all five imputed data sets; no differences in
parameter estimates (including standard errors) of practical significance were found across the
data sets. The results reported here for all analyses involving HSGPA are those based on the
initial imputed data set.
Results
Effectiveness of ACTC Score and HSGPA for Predicting Long-Term College Success
In this section, we describe the incremental benefit of using ACTC score and HSGPA
jointly for predicting college success through degree completion. We first present descriptive
statistics for ACTC scores and HSGPAs for enrolled students and the entire applicant pool, as
well as for college outcomes over time for enrolled students. Next, we present probability
distributions for the various college outcomes as functions of ACTC scores and HSGPAs.
Following this, we present maxARs, ∆ARs, and SRs for ACTC score and HSGPA used
separately and jointly to predict long-term college success.
Descriptive statistics. At four-year institutions, mean ACTC scores and HSGPAs were
typically higher among enrolled students than among students in the entire applicant pool (Table
3). The corresponding standard deviations were slightly smaller for enrolled students. The typical
mean ACTC score across four-year institutions in this study (21.5) was lower than the mean
score (22.6) of first-year ACT-tested college students nationally who enrolled in four-year
institutions in 2003 (ACT, 2004).

16
Table 3
Distributions of Means and Standard Deviations of ACTC Scores, HSGPAs, College Success
Rates, and College GPAs by Applicant/Enrollment Status across Four-Year Institutions
Enrollment
status
Predictor/outcome
variable
Number of students Mean SD
Med Min/Max Med Min/Max Med Min/Max
Applicant
pool
ACTC score 6,692 159/41,628 20.4 16.3/23.0 4.1 3.1/4.7
HSGPA 6,692 159/41,628 3.21 2.81/3.50 0.58 0.45/0.64
Enrolled
students
ACTC score 1,287 50/9,824 21.5 16.1/25.3 3.9 3.1/4.7
HSGPA 1,287 50/9,824 3.32 2.82/3.73 0.53 0.29/0.64
Progress year 1 1,541 50/9,824 68 27/89
Progress year 2 1,541 50/9,824 54 21/83
Progress year 3 1,529 49/9,824 46 18/79
Progress year 4 1,526 49/9,824 44 17/79
Bachelor’s degree 1,287 50/9,824 42 17/79
First-year GPA 1,170 44/9,225 2.80 2.35/3.18 0.81 0.54/0.96
Year 6 cum GPA
a
612 24/6,286 3.12 2.77/3.47 0.52 0.38/0.75
Note. SD = standard deviation; Med = median; Min = minimum; Max = maximum; ACTC = ACT Composite;
HSGPA = high school grade point average.
a
Student’s cumulative GPAs at degree completion were included in year 6 GPA analyses for students who
graduated with a bachelor’s degree before the end of year 6.
Among enrolled students, the typical six-year bachelor’s degree completion rate across
four-year institutions was 42% and ranged from 17% to 79%. Median progress to degree rates
declined over time from 68% by the end of year 1 (24 or more cumulative hours earned) to 44%
by the end of year 4 (96 or more cumulative hours earned). The typical year 6 college cumulative
GPA was above 3.00 (median = 3.12).

17
At two-year institutions, mean ACTC scores and HSGPAs were comparable between
enrolled students and the applicant pool (Table 4). The typical mean ACTC score of students
enrolled in two-year institutions in this study (18.3) was slightly lower than the mean score
(18.8) of first-year ACT-tested college students nationally who enrolled in two-year institutions
in 2003 (ACT, 2004).
Table 4
Distributions of Means and Standard Deviations of ACTC Scores, HSGPAs, College Success
Rates, and College GPAs by Applicant/Enrollment Status across Two-Year Institutions
Enrollment
status
Predictor/outcome
variable
Number of students Mean SD
Med Min/Max Med Min/Max Med Min/Max
Applicant
pool
ACTC score 2,137 120/16,472 18.3 16.7/20.2 3.6 3.2/4.1
HSGPA 2,137 120/16,472 3.04 2.81/3.21 0.59 0.51/0.62
Enrolled
students
ACTC score 834 95/9,551 18.3 16.9/20.6 3.5 3.0/4.0
HSGPA 834 95/9,551 3.02 2.79/3.25 0.58 0.49/0.62
Progress year 1 832 79/8,804 50 18/77
Progress year 2 831 95/8,866 40 8/61
Progress year 3 830 95/8,808 34 4/54
Associate’s
degree
834 95/9,551 14 4/34
Associate’s
degree or transfer
1,053 157/9,551 23 7/41
First-year GPA 385 65/7,321 2.63 2.18/3.01 0.90 0.76/1.10
Year 3 cum GPA
a
343 25/4,729 2.81 2.55/3.08 0.71 0.53/1.00
Note. SD = standard deviation; Med = median; Min = minimum; Max = maximum; ACTC = ACT Composite;
HSGPA = high school grade point average.
a
Student’s cumulative GPAs at degree completion were included in year 3 GPA analyses for students who
graduated with an associate’s degree before the end of year 3.
18
Among enrolled students, the typical three-year associate’s degree completion rate for
two-year institutions was relatively low at 14% and ranged from 4% to 34% across institutions.
The typical rate for completing an associate’s degree or transferring to an in-state four-year
institution by year 3 was higher at 23% and ranged from 7% to 41% across institutions. Progress
to degree rates for two-year institutions also declined over time from 50% by the end of year 1
(18 or more cumulative hours earned) to 34% by the end of year 3 (54 or more cumulative hours
earned). The typical year 3 college cumulative GPA was less than 3.00 (median = 2.81).
Hierarchical logistic regression results. Figures A-1 to A-10 in Appendix A provide
estimated probabilities of completing a degree, progressing towards a degree, or achieving
different levels of year6/year3 cumulative GPA as a function of ACTC score or HSGPA. The
probabilities in the figures were estimated using the fixed effects parameter estimates from the
hierarchical logistic models. Across college outcomes, as ACTC score or HSGPA increased, the
estimated probabilities of success at either a typical two- or four-year institution increased.
Degree completion. At four-year institutions, the probability of earning a bachelor’s
degree by year 6 for students with an ACTC score of 25 (the maximum average ACTC score
across institutions) was substantially higher than that for students with an ACTC score of 16 (the
minimum average ACTC score across institutions; 0.54 vs. 0.31, see Figure A-1). At two-year
institutions, the chances of earning an associate’s degree or transferring to an in-state four-year
institution by year 3 were greater than those of earning an associate’s degree by year 3 by at least
10 percentage points for students with ACTC scores of 19 or higher or HSGPAs of 3.3 or higher
(Figures A-1 and A-2). Regardless of the student’s HSGPA, the probabilities of degree
completion at two-year institutions (including or not including transfer) were less than 0.50.

19
Progress to degree. The estimated probabilities of progressing towards a degree
associated with a given ACTC score or HSGPA decreased over time with the largest decline in
probabilities occurring between years 1 and 2 (Figures A-3 and A-4 for four-year institutions and
Figures A-5 and A-6 for two-year institutions). For example, at a typical four-year institution, the
estimated probability of progressing towards a degree for a student with an ACTC score of 21
was 0.68 at the end of year 1 (earned 24 or more hours), and decreased to 0.54 (48 or more
hours), 0.48 (72 or more hours), and 0.45 (96 or more hours) by the end of years 2, 3, and 4,
respectively (Figure A-3).
5
The corresponding probabilities for a student with a HSGPA of 3.20
were estimated to be 0.64, 0.50, 0.44, and 0.41, respectively (Figure A-4). Estimated progress-to-
degree probabilities also declined over time for two-year institutions (Figures A-5 and A-6).
Year 6 cumulative GPA at four-year institutions. The chances of earning a 3.75 or
higher year 6 cumulative GPA were at least 30 percentage points lower than the chances of
earning a 3.00 or higher GPA for students with ACTC scores of 16 to 32 (Figure A-7) or
HSGPAs of 2.80 or higher (Figure A-8). For example, an ACTC score of 21 corresponded to a
0.58 estimated probability of earning a 3.00 or higher year 6 cumulative GPA at a typical four-
year institution (Figure A-7). The corresponding probabilities for the other criterion levels were
0.38 (3.25), 0.20 (3.50), and 0.07 (3.75), respectively.
A HSGPA of 3.20 was associated with a 0.52 estimated probability of achieving a 3.00 or
higher year 6 cumulative GPA at a typical four-year institution (Figure A-8). The corresponding
probabilities for the other criterion levels were 0.30 (3.25), 0.13 (3.50), and 0.03 (3.75),
respectively. For the 3.75 criterion, a HSGPA of 4.00 corresponded to a typical probability of
success of only 0.33.
5
ACTC score of 21 and HSGPA of 3.20 correspond to the approximate median average ACTC score and HSGPA
across four-year institutions.

20
Year 3 cumulative GPA at two-year institutions. Probability curves for two-year
institutions were comparable to those for four-year institutions. An ACTC score of 18
corresponded to a 0.42 estimated probability of earning a 3.00 or higher year 3 cumulative GPA
at a typical two-year institution (Figure A-9).
6
The corresponding probabilities for the other
criterion levels were 0.26 (3.25), 0.14 (3.50), and 0.05 (3.75), respectively.
A HSGPA of 3.00 was associated with an estimated probability of 0.39 of achieving a
3.00 or higher year 3 cumulative GPA at a two-year institution (Figure A-10). The corresponding
probabilities for the other criterion levels were 0.24 (3.25), 0.12 (3.50), and 0.04 (3.75),
respectively. For the criterion levels of 3.50 or higher and 3.75 or higher, a HSGPA of 4.00
corresponded to a typical probability of success of less than 0.50 at two-year institutions (0.45
and 0.26, respectively).
Accuracy and success rates for ACTC score and HSGPA. In this section, we
summarize median maxARs, ∆ARs, and SRs across institutions with viable models using ACTC
score or HSGPA as predictors of long-term college outcomes.
7
Minimum and maximum values
for these statistics are provided in Appendix B, Tables B-1 to B-4. Results for progress to degree
outcomes are also provided in the tables in Appendix B.
Degree completion. For four-year institutions, 58 of the 61 institutions had viable ACTC
models and 56 had viable HSGPA models for predicting degree completion (Table 5).
6
ACTC score of 18 and HSGPA of 3.00 correspond to the approximate median average ACTC score and HSGPA
across two-year institutions.
7
For a viable model, the probability distribution must cross 0.50.

21
Table 5
Median Results for Predicting Degree Completion
Predictor variable
Number
of
institutions
Maximum
accuracy
rate
(maxAR)
Increase in
accuracy
rate
(∆AR)
Success
rate
(SR)
Bachelor’s degree completion by year 6 -- four-year institutions (n = 61)
ACTC 58 64 24 57
HSGPA 56 65 23 58
ACTC & HSGPA
61 67 26 60
Associate’s degree completion by year 3 -- two-year institutions (n = 43)
ACTC 25 81 63 55
HSGPA 5 72 43 52
ACTC & HSGPA
25 82 64 53
Associate’s degree completion or transfer to four-year institution by year 3 -
- two-year institutions (n = 40)
ACTC 38 77 54 55
HSGPA 14 69 37 54
ACTC & HSGPA
38 77 54 55
Note. Results across institutions with viable models for both predictors were similar to those presented here.
Statistics were evaluated at selection values associated with the maxAR. ACTC = ACT Composite; HSGPA = high
school grade point average.
The three institutions with nonviable ACTC models had relatively high six-year bachelor’s
degree completion rates (66% to 79%). The five institutions with nonviable HSGPA models had
relatively low six-year bachelor’s degree completion rates (17% to 25%). Joint ACTC and
HSGPA models were viable for all 61 four-year institutions included in this study.
The median ACTC and HSGPA selection values associated with the maxAR for
predicting six-year bachelor’s degree completion were relatively high (25 for ACTC and 3.57 for
HSGPA; Appendix B, Table B-1), and these selection values varied substantially across
institutions (ranging from 9 to 31 for ACTC and from 2.20 to 4.00 for HSGPA). Multiple
combinations of ACTC score and HSGPA corresponded to a probability of 0.50 for the joint
model and are therefore not listed in the tables in Appendix B. Median maxARs and SRs were
22
comparable for ACTC and HSGPA (64% vs. 65% and 57% vs. 58%, respectively). The median
maxAR and SR for the joint model were higher than those based on the single-predictor models
(by 2 to 3 percentage points). The typical maxAR associated with using both ACTC score and
HSGPA jointly for predicting bachelor’s degree completion was 26 percentage points higher
than the baseline AR. These findings demonstrate the incremental benefit of using ACTC score
and HSGPA for predicting bachelor’s degree completion by year 6.
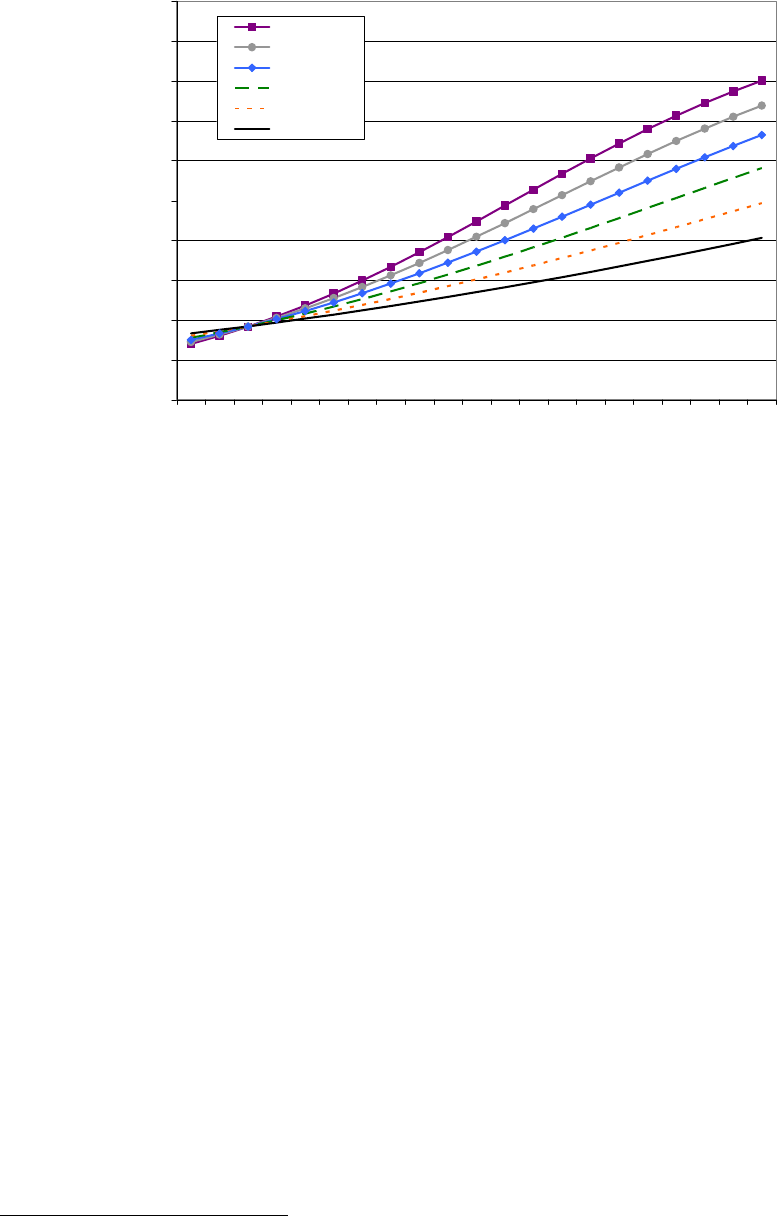
To better understand the results based on the joint model and the incremental usefulness
of ACTC score beyond HSGPA, Figure 2 provides the estimated probabilities of completing a
bachelor’s degree by year 6 associated with different values of HSGPA and ACTC scores. As
both HSGPA and ACTC score increased, probabilities of success also increased. The ACTC
score differential was larger for students with higher HSGPAs than those with lower HSGPAs.
The same was true for the HSGPA differential when comparing students with higher and lower
ACTC scores.
23
0
0.1
0.2
0.3
0.4
0.5
0.6
0.7
0.8
0.9
1
2.0 2.2 2.4 2.6 2.8 3.0 3.2 3.4 3.6 3.8 4.0
HSGPA
Probability
ACTC = 35
ACTC = 30
ACTC = 25
ACTC = 20
ACTC = 15
ACTC = 10
Figure 2. Estimated probabilities of bachelor’s degree completion by year 6 based on HSGPA
and ACTC score at four-year institutions.
8
HSGPA = high school grade point average; ACTC =
ACT Composite.
For associate’s degree completion by year 3, 25 of the 43 two-year institutions had viable
ACTC models and only five had viable HSGPA models (three-year associate’s degree
completion rates were relatively low). As a result, selection values associated with the maxAR
were relatively high across the institutions with viable models (Appendix B, Table B-2); these
values were higher than those for predicting bachelor’s degree completion by year 6 at four-year
institutions. Across the 25 institutions with viable models, the typical maxAR and SR associated
with ACTC scores were relatively high (81% and 55%, respectively), while the percentages of
students at or above the ACTC selection values were relatively low (ranged from about 1% to
8% across institutions; Appendix B, Table B-2).
8
The probabilities in Figure 2 were estimated using the fixed effects parameter estimates from the hierarchical
logistic model that included an interaction term between ACTC score and HSGPA.
24
When examining associate’s degree completion or four-year transfer by year 3 as the
outcome, 38 of 40 two-year institutions had viable ACTC models, but only 14 of the 40
institutions had viable HSGPA models (the typical probability of associate’s degree completion
or transfer by year 3 for students with a 4.00 HSGPA was less than 0.50; Figure A-2). The
median selection values associated with the maxAR were slightly higher than those for
bachelor’s degree completion by year 6 at four-year institutions (27 vs. 25 for ACTC score and
3.75 vs. 3.57 for HSGPA). The median maxAR and ∆AR across two-year institutions based on
ACTC score were both higher than those associated with predicting bachelor’s degree
completion across four-year institutions. The median SR, however, was comparable. The median
maxAR for HSGPA viable models was considerably lower than that based on ACTC viable
models. Median maxARs, ∆ARs, and SRs for the ACTC and HSGPA joint models were
comparable to those for the ACTC models, reflecting the negligible incremental benefit of
HSGPA for predicting associate’s degree completion by year 3 alone or in combination with
transferring to an in-state four-year institution.
Progress to degree over time. Over 85% of the two- and four-year institutions with
cumulative hours earned available had viable models for evaluating the progress to degree
outcomes (44 out of 50 four-year institutions and 36 out of 42 two-year institutions; Appendix B,
Tables B-1 and B2). Median selection values for predicting progress to degree from either ACTC
or HSGPA increased over time (Appendix B, Tables B-1 and B-2). For example, for four-year
institutions, the median ACTC score associated with the maxAR increased from 18 at year 1 to
24 at year 4, compared to a score of 25 for predicting completion of a bachelor’s degree by year
6 (usually requiring 120 or more cumulative credit hours earned). For two-year institutions, the
25
typical score associated with the maxAR for completing an associate’s degree by year 3 was
much higher than that for predicting progress to degree at year 3 (29 vs. 23; Table B-2).
Median maxARs, ∆ARs, and SRs for HSGPA were slightly higher than those for ACTC
for four-year institutions, but these median values were more comparable between these two
predictors for two-year institutions. However, at both two- and four-year institutions, the median
maxARs, ∆ARs, and SRs based on the joint models were slightly higher than those based on the
single-predictor models (by 1 to 3 percentage points). These findings are consistent with those
seen for degree completion.
Year 6 cumulative GPA at four-year institutions. All but one of the 57 four-year
institutions with cumulative GPA data available had viable ACTC models for predicting college
GPA at year 6 for criterion levels at or above 3.00 (Table 6). In contrast, only 40 and 2 of the 57
institutions had viable models for HSGPA for the 3.50 and 3.75 criterion levels, respectively (the
typical probability of a 3.75 or higher GPA for students with a 4.00 HSGPA was less than 0.50;
Figure A-8). For predicting college GPA at year 6, median ACTC scores and HSGPAs
associated with the maxAR increased across GPA criterion levels from 3.00 to 3.75 (Table B-3
of Appendix B). For example, the median ACTC selection value for a GPA level of 3.00 or
higher was 20; the corresponding selection values for the other criterion levels were 24, 27, and
31, respectively. For both ACTC score and HSGPA, selection values associated with the maxAR
varied substantially across institutions (see minimum and maximum values in Table B-3 of
Appendix B).

26
Table 6
Median Results for Predicting Levels of Year 6 College Cumulative GPA at Four-Year
Institutions
Predictor variable
Number
of
institutions
Maximum
accuracy
rate
(maxAR)
Increase in
accuracy
rate
(∆AR)
Success
rate
(SR)
3.00 or higher college GPA
ACTC 57 67 12 68
HSGPA 57 70 16 70
ACTC & HSGPA
57 71 18 71
3.25 or higher college GPA
ACTC 57 70 33 64
HSGPA 57 73 35 63
ACTC & HSGPA 57 75 39 67
3.50 or higher college GPA
ACTC 57 79 56 61
HSGPA 40 79 56 56
ACTC & HSGPA 57 83 62 63
3.75 or higher college GPA
ACTC 56 91 82 58
HSGPA 2 84 67 50
ACTC & HSGPA 57 92 84 59
Note. Students’ cumulative GPAs at degree completion were included in year 6 GPA analyses for students who
graduated with a bachelor’s degree before the end of year 6.
Statistics were evaluated at selection values associated
with the maxAR. GPA = grade point average; ACTC = ACT Composite; HSGPA = high school grade point average.
The HSGPA models were slightly more accurate than the ACTC models for criterion
levels of 3.00 and 3.25 (based on the median maxARs and ∆ARs), but the HSGPA and ACTC
models were comparable for the criterion level of 3.50. For the GPA criterion level of 3.75, the
typical maxAR and ∆AR were relatively high for ACTC score (91% and 82%, respectively).
Across the GPA criterion levels (at or above 3.00), the median maxARs, ∆ARs, and SRs for the
ACTC and HSGPA joint model generally exceeded those for both single-predictor models.
Figure 3 contains the estimated probabilities for achieving a year 6 cumulative GPA of 3.00 or
higher at a typical four-year institution based on different values of HSGPA and ACTC score.

27
0
0.1
0.2
0.3
0.4
0.5
0.6
0.7
0.8
0.9
1
2.0 2.2 2.4 2.6 2.8 3.0 3.2 3.4 3.6 3.8 4.0
HSGPA
Probability
ACTC = 35
ACTC = 30
ACTC = 25
ACTC = 20
ACTC = 15
ACTC = 10
Figure 3. Estimated probabilities of achieving a year 6 college cumulative GPA of 3.00 or higher
based on HSGPA and ACTC score at four-year institutions.
9
HSGPA = high school grade point
average; ACTC = ACT Composite.
ACTC differentials in estimated probabilities were greater for students with higher
HSGPAs than for those with lower HSGPAs. Larger HSGPA differentials were also seen for
students with higher ACTC scores than for those with lower scores. Similar results held for the
other GPA criterion levels.
Year 3 cumulative GPA at two-year institutions. Only 5 of the 42 two-year institutions
had viable HSGPA models for predicting year 3 college GPA at the 3.50 criterion level, and
none of the institutions had viable HSGPA models for the 3.75 criterion level (Table 7). In
contrast, all but two of the institutions had viable ACTC models across GPA criterion levels.
9
The probabilities in Figure 3 were estimated using the fixed effects parameter estimates from the hierarchical
logistic model that included an interaction between ACTC score and HSGPA.

28
Table 7
Median Results for Predicting Levels of Year 3 College Cumulative GPA at Two-Year
Institutions
Predictor variable
Number
of
institutions
Maximum
accuracy
rate
(maxAR)
Increase in
accuracy
rate
(∆AR)
Success
rate
(SR)
3.00 or higher college GPA
ACTC 42 66 22 63
HSGPA 42 68 25 62
ACTC & HSGPA 42 70 27 66
3.25 or higher college GPA
ACTC 42 74 46 62
HSGPA 42 75 48 56
ACTC & HSGPA 42 77 50 64
3.50 or higher college GPA
ACTC 42 84 66 60
HSGPA 5 78 55 51
ACTC & HSGPA 42 85 68 61
3.75 or higher college GPA
ACTC 40 92 84 58
HSGPA 0
ACTC & HSGPA 41 93 85 58
Note. Students’ cumulative GPAs at degree completion were included in year 3 GPA analyses for students who
graduated with an associate’s degree before the end of year 3. Statistics were evaluated at selection values associated
with the maxAR.
GPA = grade point average; ACTC = ACT Composite; HSGPA = high school grade point average.
Similar to the results seen for four-year institutions, median selection values associated
with the maxAR increased across GPA criterion levels for two-year institutions (Appendix B,
Table B-4). The ACTC selection scores for two-year institutions were generally within 2 score
points of those for four-year institutions, and the HSGPA selection values for two-year
institutions were generally higher than those for four-year institutions. Selection values
associated with the maxAR also varied substantially across institutions (Appendix B, Table B-4).
Median maxARs, ∆ARs, and SRs for the ACTC and HSGPA joint models tended to be slightly
higher than those for both single-predictor models for GPA criterion levels of 3.00 or higher. In
29
general, typical SRs for two-year institutions were lower than those for four-year institutions for
GPA criterion levels of 3.00 and 3.25.
Usefulness of ACT College Readiness Benchmarks for Predicting Long-Term College
Success
In this section, we evaluate the effectiveness of the ACT College Readiness Benchmarks
for predicting college success through degree completion. We first present descriptive statistics
on ACT Benchmark attainment for enrolled students, as well as for the entire applicant pool. We
also briefly describe the probability distributions for college success as functions of the
individual ACT subject area scores. Following this, we present the typical probabilities of
success, SRs, and ∆SRs associated with the ACT College Readiness Benchmark scores.
Descriptive statistics. At four-year institutions, the typical percentages of students
meeting the ACT Benchmarks were higher among enrolled students than among students in the
applicant pool (Table 8). In contrast, at two-year institutions, the typical Benchmark attainment
percentages were comparable for these two student groups, and were lower than those for
students from four-year institutions.

30
Table 8
Distributions of Percentages of Students Meeting ACT Benchmarks across Institutions by
Applicant/Enrollment Status and Type of Institution
Institution
type ACT Benchmark
Applicant pool Enrolled students
Med Min/Max Med Min/Max
Four-year
English 70 31/84 78 31/96
Mathematics 31 5/58 38 5/85
Reading 51 16/69 59 15/83
Science 21 3/44 26 3/56
Two-year
English 52 38/67 53 38/72
Mathematics 14 7/38 13 5/38
Reading 33 20/48 33 19/50
Science 10 3/20 9 2/23
Note. For the typical numbers of students per institution see those reported in Tables 3 and
4. Med = median; Min = minimum; Max = maximum.
Across college outcomes for both institution types, as the ACT subject area score
increased, the typical probabilities of college success also increased. This finding is illustrated in
Figure 4 for six-year bachelor’s degree completion at four-year institutions.

31
0
0.1
0.2
0.3
0.4
0.5
0.6
0.7
0.8
0.9
1
10 15 20 25 30 35
ACT subject area score
Probability
English
Mathematics
Reading
Science
Figure 4. Probability of completing a bachelor’s degree by year 6 as a function of ACT subject
area score.
10
The logistic curve associated with the ACT Mathematics score was steeper than those
associated with the other subject area tests (that is, there were greater differences in the
probabilities of completing a bachelor’s degree by year 6 between students with higher and lower
scores in mathematics than in the other subject areas). Across the outcomes, the typical
probabilities of success at the ACT Mathematics (22) and Science (24) Benchmark scores were
higher than those at the ACT English (18) and Reading (21) Benchmark scores. This finding is
further illustrated in the next section where the typical probabilities of success (across
institutions) at the Benchmark scores are provided.
Success rates for ACT College Readiness Benchmarks. Estimated SRs and ∆SRs
associated with ACT Benchmark scores across all institutions with available outcome data were
10
The probabilities in Figure 4 are based on fixed effects parameter estimates from the hierarchical logistic models.

32
calculated. For these analyses, cumulative GPA was evaluated for only two criterion levels: 3.00
or higher and 3.50 or higher.
Degree completion. For four-year institutions, median probabilities of completing a
bachelor’s degree by year 6 ranged from 0.35 to 0.47 across the Benchmarks (Table 9). For two-
year institutions, median probabilities of success ranged from 0.12 to 0.23 across the
Benchmarks for predicting associate’s degree completion, and ranged from 0.21 to 0.36 for
predicting associate’s degree completion or transfer to an in-state four-year institution by year 3.
Table 9
Median Results for Predicting Degree Completion by ACT College Readiness Benchmarks
Subject area
Probability
of success at
Benchmark
Success
rate
(SR)
Increase in
success rate
(∆SR)
Bachelor’s degree completion by year 6 (n = 61 four-year
institutions)
English 0.35 46 5
Mathematics 0.46 53 13
Reading 0.39 47 5
Science 0.47 52 11
Associate’s degree completion by year 3 (n = 43 two-year
institutions)
English 0.12 18 4
Mathematics 0.22 28 14
Reading 0.15 19 5
Science 0.23 26 12
Associate’s degree completion or transfer to four-year
institution by year 3 (n = 40 two-year institutions)
English 0.21 29 6
Mathematics 0.36 42 19
Reading 0.25 30 7
Science 0.35 38 16
Note. For the typical percentages of students at or above the ACT Benchmark scores, see Table 8.

33
The probabilities of degree completion for each Benchmark varied substantially across
institutions (Appendix C, Tables C-1 and C-2). For example, the estimated probability of
completing a bachelor’s degree by year 6 at the ACT Mathematics Benchmark score ranged from
0.23 to 0.79 across institutions, further illustrating the high variability in institutional degree
completion rates and admission requirements across institutions.
For both two- and four-year institutions, typical SRs associated with the ACT Benchmark
scores were higher than baseline SRs as evidenced by the positive ∆SRs (ranging from 4 to 19
percentage points). Median SRs and ∆SRs associated with the ACT Mathematics and Science
Benchmarks were higher than those associated with the ACT English and Reading Benchmarks
(by as little as 5 percentage points to as much as 13 percentage points; larger differences were
seen for two-year institutions). To help provide context for these SRs, median SRs for the
Mathematics Benchmark score were only slightly lower than those corresponding to ACTC or
HSGPA values that maximized prediction accuracy for bachelor’s degree completion by year 6
for four-year institutions (within 4 to 5 percentage points; see Tables 5 and 9). A similar result
was not seen for the two degree completion outcomes at two-year institutions: the typical SRs
associated with the Mathematics Benchmark were considerably lower than those corresponding
to ACTC scores that maximized prediction accuracy (by at least 13 percentage points).
11
This
latter finding is a result of the institution-specific associate’s degree completion rates being
relatively low (ranged from 4% to 34% when transfers were not included and from 7% to 41%
when transfers were included).
11
The SRs corresponding to Benchmark scores were based on all 61 four-year institutions and 40 two-year
institutions, while SRs based on institution-specific ACTC selection scores (those associated with the maxAR) were
based on 58 four-year institutions and 25 or 38 two-year institutions with viable ACTC models. For ACTC score we
also evaluated SRs across all institutions at specific scores. But, the conclusions were similar to those already noted
for results based on the institution-specific selection scores.
34
Progress to degree over time. The typical probabilities of success and SRs associated
with using the ACT Benchmarks to predict progress towards a degree decreased over time
(Tables C-1 for four-year institutions and C-2 for two-year institutions). For example, for four-
year institutions, the typical chances of completing 24 or more credit hours by the end of year 1
for students with an ACT Mathematics score of 22 was 73%. For students with the same ACT
Mathematics score, the typical chances of completing 96 or more credit hours by the end of year
4 decreased to 51%. And, the corresponding median SRs decreased from 82% to 57% from year
1 to year 4. These findings agree with an earlier result where the median ACTC score and
HSGPA values associated with the maxAR for predicting progress to degree increased over time
(see Tables B-1 and B-2).
Across time points and types of institutions, the highest median SRs and ∆SRs for the
progress to degree outcomes were generally associated with the ACT Mathematics Benchmark,
but typical ∆SRs were positive for all of the Benchmarks demonstrating the incremental value of
these indicators over baseline SRs. The median SRs for the ACT Mathematics and Science
Benchmarks were higher than those corresponding to the institution-specific ACTC selection
values for the first two years, and were comparable for later years (compare Table B-1 to Table
C-1 and Table B-2 to Table C-2). Typical ∆SRs associated with the ACT Mathematics and
Science Benchmark scores for predicting the progress to degree outcomes ranged from 12 to 16
percentage points at four-year institutions and from 19 to 27 percentage points at two-year
institutions. The median SRs for the ACT English and Reading Benchmarks were comparable to
those associated with the institution-specific ACTC selection values for earlier years, but were
slightly lower for later years.

35
Year 6 cumulative GPA at four-year institutions. The typical probabilities of achieving a
year 6 college GPA of 3.00 or higher ranged from 0.46 to 0.72 across the Benchmarks (Table
10). The corresponding probabilities for the 3.50 criterion ranged from 0.13 to 0.34. Probabilities
of success varied substantially across institutions (Table C-3).
Table 10
Median Results for Predicting Levels of Year 6/Year 3 College Cumulative GPAs using ACT
College Readiness Benchmarks, by Institution Type
ACT
Benchmark
Four-year institutions Two-year institutions
Probability
of success
at
Benchmark
Success
rate
(SR)
Increase in
success
rate
(∆SR)
Probability
of success
at
Benchmark
Success
rate
(SR)
Increase
in success
rate
(∆SR)
3.00 or higher college GPA
English 0.46 65 10 0.42 55 13
Mathematics 0.66 76 19 0.63 70 26
Reading 0.59 69 12 0.50 60 16
Science 0.72 77 19 0.63 68 24
3.50 or higher college GPA
English 0.13 29 7 0.14 25 8
Mathematics 0.28 40 18 0.30 39 23
Reading 0.22 34 10 0.21 29 12
Science 0.34 43 19 0.34 41 23
Note. ACT Benchmarks are 18 for English, 22 for Mathematics, 21 for Reading, and 24 for Science. Cumulative
GPA was evaluated at year 6 for four-year institutions and at year 3 for two-year institutions. Students’ cumulative
GPAs at degree completion were included in GPA analyses for students at four-year institutions who graduated with
a bachelor’s degree before the end of year 6 or students at two-year institutions who graduated with an associate’s
degree before the end of year 3.
Median SRs were substantially higher and ∆SRs were slightly higher for the 3.00 or
higher criterion than for the 3.50 or higher criterion. Typical probabilities of success, SRs, and
∆SRs associated with the ACT Mathematics and Science Benchmark scores were higher than
those associated with the ACT English and Reading Benchmark scores at both GPA criterion
levels. Median SRs for the Mathematics and Science Benchmarks were also slightly higher than
36
those associated with the institution-specific ACTC and HSGPA selection values that maximized
prediction accuracy for the 3.00 or higher criterion, but were substantial lower for the 3.50 or
higher criterion (see Tables 6 and 10). The latter finding is due to the typical ACTC selection
value being considerably higher than the ACT Benchmark scores (by at least 3 scale score
points). Moreover, a relatively small percentage of students achieved a 3.50 or higher year 6
cumulative GPA (median across four-year institutions was 27%).
Year 3 cumulative GPA at two-year institutions. Findings noted for year 6 cumulative
GPA at four-year institutions generally held true for year 3 cumulative GPA at two-year
institutions. Typical probabilities of success associated with the ACT Benchmarks were lower
for two-year institutions than for four-year institutions for the 3.00 or higher criterion, but were
somewhat more comparable for the 3.50 or higher criterion (Table 10). Similar to those noted for
four-year institutions, probabilities of success and SRs varied across the institutions (Table C-4).
Median SRs were lower for two-year institutions than for four-year institutions, but the opposite
was true for ∆SRs. Differences in typical SRs and ∆SRs between the two types of institutions
were larger for the 3.00 or higher criterion than for the 3.50 or higher criterion.
Path Analysis
In this section we investigate the effects of ACTC score, HSGPA, and first-year college
GPA jointly for predicting subsequent college outcomes. The indirect effects of ACTC scores
and HSGPA on college outcomes mediated through first-year college GPA, as well as their
direct effects on college outcomes, are estimated (see Figure 1). Only enrolled students with
college GPAs at the end of the first year were included in the analyses (83% and 62% of the
samples for four- and two-year institutions, respectively).

37
Degree completion at four-year institutions. The path model for bachelor’s degree
completion by year 6 for four-year institutions is shown in Figure 5.
Figure 5. Path model for bachelor’s degree completion by year 6 at four-year institutions.
ACTC = ACT Composite; HSGPA = high school grade point average; GPA = grade point
average; Bach = Bachelor’s.
ACTC score was found to be only indirectly related to bachelor’s degree completion; the
direct path was not statistically significant at the 0.01 level. The direct effect of first-year GPA
on bachelor’s degree completion was over 7 times that for HSGPA. The paths from ACTC score
and HSGPA on first-year GPA were both significant. The total effect of HSGPA on degree
completion (direct and indirect) was slightly greater than that for ACTC score (0.31 vs. 0.26).
The total effect on bachelor’s degree completion for each of the pre-enrollment measures was
lower than the direct/total effect of first-year GPA (Table D-1 from Appendix D).
Degree completion at two-year institutions. The path model for associate’s degree
completion by year 3 at two-year institutions is shown in Figure 6, and the path model for
associate’s degree completion or transfer to four-year institution by year 3 is shown in Figure 7.
HSGPA
First-year
GPA
Bach degree
completion
ACTC
score
0.52
0.07
0.48
0.35
0.26

38
Figure 6. Path model for associate’s degree completion by year 3 at two-year institutions.
ACTC = ACT Composite; HSGPA = high school grade point average; GPA = grade point
average; Assoc = Associate’s.
Figure 7. Path model for associate’s degree completion or transfer to an in-state four-year
institution by year 3 at two-year institutions. ACTC = ACT Composite; HSGPA = high school
grade point average; GPA = grade point average; Assoc = Associate’s.
The direct effect of first-year GPA on each outcome was greater than the direct effects of
ACTC score or HSGPA. The total effect of HSGPA on degree completion was greater than that
of ACTC score (0.27 vs. 0.36 when not including transfers and 0.29 vs. 0.34 when including
transfers; Table D-2 from Appendix D). They were each smaller than the direct/total effect of
first-year GPA on these two outcomes.
HSGPA
First-year
GPA
Assoc degree
or transfer
ACTC
score
0.44
0.13
0.46
0.30
0.18
0.09
HSGPA
First-year
GPA
Assoc degree
completion
ACTC
score
0.46
0.16
0.46
0.29
0.18
0.06

39
Progress to degree. For four-year institutions, similar to that seen for degree completion,
ACTC score was only indirectly related to the progress to degree outcomes. The significant
direct effects of HSGPA on these outcomes were relatively small in comparison to those for
first-year GPA (0.07 vs. 0.58 to 0.62; see Table D-1 in Appendix D). For two-year institutions,
the direct effects of ACTC score and HSGPA on the progress to degree outcomes were
comparable and relatively small in comparison to those of first-year GPA on these outcomes (see
Table D-2 in Appendix D). Across these outcomes over time, the total effects of each of the pre-
enrollment measures (direct and indirect) were smaller than the direct/total effects of first-year
GPA on the progress to degree outcomes.
Year 6 cumulative GPA at four-year institutions. The direct effects of ACTC score
and HSGPA on year 6 cumulative GPA were somewhat comparable, but were substantially
smaller than the direct effect of first-year GPA on the outcome (Figure 8).
Figure 8. Path model for year 6 cumulative GPA at four-year institutions. Analyses included
only those students who either graduated prior to year 6 or were still enrolled at the end of year
6. ACTC = ACT Composite; HSGPA = high school grade point average; GPA = grade point
average; cum = cumulative.
For students who either graduated prior to year 6 or were still enrolled at year 6, the
direct effects on first-year GPA, as well as the total effects on year 6 cumulative GPA, were
HSGPA
First-year
GPA
Year 6
cum GPA
ACTC
score
0.68
0.12
0.45
0.32
0.31
0.09

40
comparable for ACTC score and HSGPA (Table D-1 in Appendix D). The total effects for both
pre-enrollment measures were smaller than the direct/total effect of first-year GPA on this
outcome.
Year 3 cumulative GPA at two-year institutions. Path model results for year 3
cumulative GPA at two-year institutions were similar to those for year 6 cumulative GPA at
four-year institutions (Figure 9). The one exception was that the direct effect of HSGPA on first-
year GPA was greater than the direct effect of ACTC score on the same outcome.
Figure 9. Path model for year 3 cumulative GPA at two-year institutions. Analyses included only
those students who either graduated prior to year 3 or were still enrolled at the end of year 3.
ACTC = ACT Composite; HSGPA = high school grade point average; GPA = grade point
average; cum = cumulative.
Discussion
Long-term student success is clearly an important goal for all postsecondary institutions.
And, in light of the increased pressure to improve degree completion rates, institutions may be
more likely to admit students who have a reasonable chance of progressing towards and
completing a degree. Four-year institutions often use multiple measures in making admission
decisions. And, even though most two-year institutions have open admission policies, they often
look at students’ high school records and require students to take course placement exams to help
HSGPA
First-year
GPA
Year 3
cum GPA
ACTC
score
0.71
0.12
0.47
0.35
0.22
0.10
41
determine which courses they will need to take. Most students also use test scores and HSGPA to
help them identify institutions to which they want to apply for admissions (Sawyer, 2010).
In this study, for both four- and two-year institutions, we evaluated the utility of ACT
scores and HSGPAs for identifying among possible applicants those who are likely to be
successful in college beyond the first year. For each outcome, estimated decision-based statistics
associated with ACTC score and HSGPA used alone and jointly were compared at values that
maximized the percentage of correct classifications. The ACTC and HSGPA selection values
(that maximized prediction accuracy) identified in this study were used for comparative purposes
only. In general, institutions rarely use strict selection cutoffs in making their admission
decisions.
Some researchers have suggested that standardized tests like the ACT are not useful and
not predictive of long-term college success (Soares, 2012). However, results from this study
refute that notion. For example, typical maximum accuracy rates for the progress to degree
outcomes over time through degree completion were moderately high (64% to 71% at four-year
institutions and 65% to 77% at two-year institutions). In general, typical maximum accuracy and
corresponding success rates were slightly higher for HSGPA than for ACTC score at four-year
institutions, but were comparable at two-year institutions. However, across college outcomes at
both types of institutions, using both ACTC score and HSGPA was generally more beneficial for
improving prediction accuracy and success rates over those based on single-predictor models,
providing evidence of the incremental benefit of using both measures for predicting college
success beyond the first year. Our estimate of the typical maximum accuracy rate based on the
joint model for predicting six-year bachelor’s degree completion (67%) is in line with results
from another study (Schmitt, Keeney, Oswald, Pleskac, Billington, Sinha, & Zorzie, 2009) that
42
found that four-year bachelor’s degree completion was successfully predicted by SAT/ACT
scores and HSGPA jointly for 63% of students.
Results based on the ACTC and HSGPA joint model also suggest that the effect of
HSGPA on long-term college success depends on the student’s ACTC score. For example, for
students with a HSGPA of 4.0, the typical chances of completing a bachelor’s degree by year 6
from the same initial four-year institution were a little over 60% (Figure A-2). But, these chances
were greater for students with higher ACTC scores and smaller for those with lower ACTC
scores (ranging from 40% to 80%; Figure 2). The ACTC score differential was also found to be
larger for students with higher HSGPAs. Two other independent studies (ACT, 2012) based on
observed degree completion rates also found this to be the case. Allowing higher ACTC scores to
compensate for lower HSGPAs and vice versa contributes to the increase in the percentage of
correct classifications based on the joint model.
Another important finding from the first part of this study was the apparent inability of
HSGPA to predict higher levels of later college GPA (at year 6 for four-year institutions and at
year 3 for two-year institutions). For example, across four-year institutions, the typical chances
of achieving higher levels of year 6 cumulative GPA associated with a HSGPA of 4.00 was less
than 50% (for criterion level of 3.75; Figure A-8). On the other hand, the typical chances of
achieving a year 6 cumulative GPA of 3.75 or higher were relatively high for students with
higher ACTC scores (Figure A-7). Sawyer (2010) found a similar result for first-year college
GPA. Moreover, the typical ACTC and HSGPA values that maximized prediction accuracy for
achieving different levels of year 6 cumulative GPA were similar to those reported in Noble and
Sawyer (2002) for predicting first-year college GPA levels. However, the typical maximum
accuracy rates found in this study were slightly lower than those found for first-year college
43
GPA. As one would expect, this finding suggests that these two pre-enrollment measures are
more strongly related to more proximal college outcomes than to the more distal ones.
The findings from the path models examined in this study highlight the importance of
students being ready for college and performing well academically during their first year to
improve their chances of progressing towards and completing a degree. Both ACTC score and
HSGPA were primarily indirectly related to subsequent college outcomes (through first-year
college GPA), but both contributed unique information towards predicting first-year academic
performance. Across the outcomes, the total effect of each of the pre-enrollment measures (direct
and indirect) was smaller than the direct/total effect of first-year GPA. One limitation of these
analyses was that students who dropped out prior to the end of the first year were not included.
Another recent study (Allen & Robbins, 2010) also examined path models for predicting
timely degree attainment (by year 4 for bachelor’s degrees and by year 2 for associate’s degrees).
The study also found that first-year academic performance had the largest effect on degree
completion. It also found that ACTC score and HSGPA were more predictive of first-year
academic performance than other noncognitive and sociodemographic characteristics. Compared
to our study, differences in their standardized path coefficients for predicting first-year academic
performance between HSGPA and ACTC score were substantially smaller for four-year
institutions, but they were considerably larger for two-year institutions. They adjusted for
measurement error in their analyses; we did not account for range restriction or measurement
error in our analyses.
Results from the path analysis also suggest that while ACTC score and HSGPA are
correlated, there are differences in what they measure. ACT scores are reported on a score scale
that maintains the same meaning across years and across high schools and are therefore not
44
affected by differential grading standards as is the case for HSGPA (Woodruff & Ziomek, 2004).
ACT scores reflect level of educational achievement at a moment in time, often at the end of a
student’s junior year or beginning of the senior year in high school. HSGPA, on the other hand,
reflects performance in courses over the duration of high school, and is not only affected by level
of content mastery, but is also affected by a student’s personal behaviors, such as whether the
student is prudent about taking good notes, putting forth effort and participating in class,
completing homework assignments, and preparing well for course exams.
From part 2 of this study, we found that the ACT College Readiness Benchmarks are also
useful for predicting long-term college success through degree completion for applicant pools,
providing further validity evidence for using the Benchmarks as an empirical definition of
college readiness. Typical success rates for predicting college outcomes beyond the first year
were generally higher for the ACT Mathematics and Science Benchmarks than for the ACT
English and Reading Benchmarks. In addition, typical success rates for the ACT Mathematics
Benchmark were generally comparable to those based on ACTC scores that maximized
prediction accuracy. The exceptions to this finding were for outcomes with relatively low
success rates consistently seen across all institutions (e.g., associate’s degree completion by year
3, year 6/year 3 cumulative GPA of 3.50 or higher).
The finding associated with the ACT Mathematics Benchmark is supported by the results
from another study: Adelman (2006) found that the highest level of high school mathematics
coursework is an important factor associated with bachelor’s degree completion. A policy brief
by Achieve (2008) suggests that the reason high school mathematics preparation is so important
for college success is related to the higher-order thinking and critical reasoning skills that
students learn beginning in Algebra I and continue to build upon in subsequent higher-level

45
mathematics courses. Students who develop these skills are better equipped for their future
career pathways, whichever path they may choose to follow.
The typical estimated success rates associated with the Benchmark scores and with the
ACTC or HSGPA values that maximized prediction accuracy were only slightly lower for
applicants at two-year institutions than for those at four-year institutions. This result was seen for
the progress to degree outcomes based on cumulative hours earned over time, as well as the year
6/year 3 cumulative GPA outcomes.
12
These findings indicate that in order for all students to
have a reasonable chance of progressing towards and completing a degree at either type of
institution, they need to graduate from high school with a core set of academic skills that help put
them on a more direct path towards long-term college success.
Unfortunately, too many high school graduates are underprepared for college-level
coursework and need to take remedial coursework. For example, only 66% of the 1.6 million
ACT-tested 2011 high school graduates met the ACT English Benchmark (ACT, 2011). The
corresponding percentages were 45%, 52%, and 30% in mathematics, reading, and science,
respectively. But, degree completion is often delayed for students taking remedial courses
(Adelman, 2004). States, districts, and high schools are increasingly implementing policies to
help address this need to prepare all students for college and career. For example, 45 states and
the District of Columbia have formally adopted the Common Core State Standards (National
Governors Association Center for Best Practices & Council of Chief State School Officers,
2012) in an effort to help improve the college and career readiness of their high school graduates.
The typical ACTC or HSGPA values that maximized prediction accuracy (that is, the
values associated with at least a 50% chance of being successful) were relatively high for degree
12
For these outcomes, the ACTC and HSGPA values that maximized prediction accuracy were similar between two-
and four-year institutions so these comparisons are appropriate and meaningful. In addition, the corresponding
typical maximum accuracy rates were comparable between the two types of institutions for these outcomes.

46
completion from the same initial institution, especially for two-year institutions.
13
Using these
high selection values would result in a substantial percentage of applicants being rejected for
admissions. However, in another study where students were followed across institutions, we
(Radunzel & Noble, 2012) found that among students with ACTC scores or HSGPAs below the
selection values identified in this study, a significant percentage of these students completed a
degree by year 6. For example, 65% of students who initially enrolled in four-year institutions
and had an ACTC score of 22 to 24 completed a bachelor’s degree within six years of enrolling
in college. It is interesting to note that for the institutions included in this study, the ACTC and
HSGPA values that maximized prediction accuracy varied substantially across institutions, and
were related to an institution’s degree completion rate (lower selection scores were generally
seen for institutions with higher degree completion rates). In part, the typical selection values are
so high because six-year degree completion rates from the same initial institution are generally
low: it is common for students to transfer to another institution (Hossler, Shapiro, Dundar,
Ziskin, Chen, Zerquera, & Torres, 2012). It is also common for students from two-year
institutions to take longer than three years to complete a degree (Green & Radwin, 2012).
In this study, we were limited to evaluating degree completion from the initial institution.
But institutions are primarily interested in identifying applicants who are most likely to graduate
from their institution. For two-year institutions, we also accounted for those students who
transferred to an in-state four-year institution. Besides degree completion, we also considered
progress to degree outcomes over time that were based on cumulative credit-bearing hours
earned. These outcomes might be useful indicators of success for two-year institutions,
13
These selection values are similar to those one might expect to see as criteria for admission at highly selective
four-year institutions or for merit-based scholarships.
47
especially as they move towards establishing intermediate markers that help track students’
progress along the pathway to degree completion (Moore et al., 2009).
Most institutions admit 50% to 85% of their applicants (Clinedinst et al., 2011).
Institutions are able to compensate for lower admissions standards with effective support
programs and interventions (Lotkowski, Robbins, & Noeth, 2004; Tinto, 2002). For example,
ACT scores and HSGPA, along with measures of psychosocial factors can help campuses
identify students who are most in need of academic support programs (Robbins et al., 2006).
Moreover, using multiple measures, including augmenting pre-enrollment measures with
information collected early in college (such as mid-term grades during a student’s first term) to
predict later college success enables colleges to identify and intervene with high-risk students in
appropriate ways.
In this study, we could only approximate applicant pools for the institutions using data
for all students who sent their ACT scores to these institutions over the study time period. In
addition, the approach of evaluating one or two pre-enrollment measures at a time is a
simplification of the admissions process. However, the methods used can be extended to include
additional measures. Another limitation of the study was that the study sample is not a nationally
representative sample. In spite of this limitation, this study was based on a large number of
institutions and a large number of students. Another strength of the study was that we included
results for ACT-tested students from both two- and four-year institutions. And, although the
ACT is generally not required for admission to two-year institutions, in states that administer the
ACT statewide, most if not all public high school graduates will have ACT scores available for
use by institutions. Future research might consider examining these same research questions for

48
COMPASS
®
-tested students at two-year institutions.
14
Future research might also examine the
effects of using ACTC score and HSGPA for predicting long-term college success across student
demographic groups to ensure equity in the admissions process.
In conclusion, findings from this study suggest that if institutions wish to admit students
with the highest likelihood of success, both ACTC score and HSGPA should be considered, as
both measures are related to college success during the first year and in subsequent years through
degree completion. The ACT Benchmarks are also effective at identifying students who are
ready for college and likely to succeed beyond the first year of college. For four-year institutions
wanting to incorporate a student’s likelihood of long-term college success into their admission
decisions, the results from this study suggest that HSGPA should carry
slightly greater weight than ACTC score for evaluating a student’s likelihood of
progressing towards or completing a bachelor’s degree within six years of initially
enrolling (irrespective of students’ final cumulative GPAs)
15
, and
approximately the same weight as ACTC score for predicting a student’s
likelihood of achieving moderate levels of year 6 cumulative GPA, and slightly
less weight for predicting a student’s likelihood of achieving higher levels of year
6 cumulative GPA.
For two-year institutions, HSGPA should carry approximately the same weight as ACTC score
for predicting the progress to degree outcomes considered in this study, as well as moderate
levels of year 3 cumulative GPA. For evaluating degree completion and higher levels of year 3
cumulative GPA, HSGPA should carry less weight than ACTC score.
14
COMPASS also has College Readiness Benchmarks (ACT, 2010a).
15
This recommendation does not take into account students’ cumulative GPAs; it addresses only whether students
will graduate in six years (some students may graduate with lower cumulative GPAs). Findings from this study
support the notion that ACTC score should carry the same or slightly greater weight than HSGPA for predicting
final cumulative GPA.
49
References
Achieve. (2008). The building blocks of success: Higher-level math for all students. (Achieve
Policy Brief). Washington, DC: Author.
ACT. (2012). ACT scores and postsecondary degree attainment: What’s the connection? (ACT
Information Brief No. 2012-11). Iowa City, IA: Author.
ACT. (2011). ACT profile report–national: Graduating class 2011–national. Iowa City, IA:
Author.
ACT. (2010a). What are ACT’s college readiness benchmarks? Iowa City, IA: Author.
ACT. (2010b). Mind the gaps: How college readiness narrows achievement gaps in college
success. Iowa City, IA: Author.
ACT. (2004). ACT class profile report, 2003-2004 freshmen. (Available from ACT, Inc., P.O.
Box 168, Iowa City, Iowa 52243).
Adelman, C. (2006). The toolbox revisited: Paths to degree completion from high school through
college. Washington, DC: U.S. Department of Education.
Adelman, C. (2004). Principal indicators of student academic histories in postsecondary
education. Washington, DC: U.S. Department of Education.
Allen, J., & Robbins, S. (2010). Effects of interest-major congruence, motivation, and academic
performance on timely degree attainment. Journal of Counseling Psychology, 57(1), 23-
35.
Allen, J., Robbins, S., Casilla, A., & Oh, I. (2008) Third-year college retention and transfer:
Effects of academic performance, motivation, and social connectedness. Research in
Higher Education, 49, 647-664.
Allen, J., & Sconing, J. (2005). Using ACT Assessment scores to set benchmarks for college
readiness. (ACT Research Report No. 2005-3). Iowa City, IA: ACT, Inc.
Breland, H., Maxey, J., Gernand, R., Cumming, T., & Trapani, C. (2002). Trends in college
admission admission 2000: A report of a survey of undergraduate admissions policies,
practices, and procedures. Retrieved May 10, 2012 from the Association for Institutional
Research website: http://www.airweb.org/images/trendsreport.pdf.
Clinedinst, M.E., Hurley, S.F., and Hawkins, D.A. (2011). 2011 State of College Admission.
Alexandria, VA: National Association for College Admissions Counseling.
50
González, J. (2012, April 22). Education for all? 2-year colleges struggle to preserve their
mission. The Chronicle of Higher Education. Retrieved on May 10, 2012 from
http://chronicle.com/article/2-Year-Colleges-Fight-to-Save/131608/.
Green, C., & Radwin, D. (2012). Characteristics of associate’s degree attainers and time to
associate’s degree. (Web Tables NCES 2012-271). Washington, DC: U.S. Department of
Education.
Higher Education Research Institute (2011, November). Completing college: Assessing
graduation rates at four-year institutions. HERI Research Brief, UCLA, Los Angeles,
CA: HERI.
Hossler, D., Shapiro, D., Dundar, A., Ziskin, M., Chen, J., Zerquera, D., Torres, V. (2012).
Transfer & Mobility: A national view of pre-degree student movement in postsecondary
institutions. (Signature Report™ 2). Herndon, VA: National Student Clearinghouse
Research Center.
Jasti, S., Dudley, W.N., & Goldwater, E. (2008). SAS macros for testing statistical mediation in
data with binary mediators or outcomes. Nursing Research, 57, 118-121,
Knapp, L.G., Kelly-Reid, J.E., Whitmore, R.W., Wu, S., Gallego, L., Cong, J., Berzofsky, M.,
Huh, S., Levine, B., & Broyles, S.G. (2005). Postsecondary institutions in the United
States: Fall 2003 and degrees and other awards conferred: 2002-03. (NCES 2005-154).
U.S. Department of Education, Washington, DC: National Center for Education
Statistics.
Lotkowski, V.A., Robbins, S.B., & Noeth, R.J. (2004). The role of academic and non-academic
factors in improving college retention. Iowa City, IA: ACT, Inc.
MacKinnon, D.P., & Dwyer, J.H. (1993). Estimating mediated effects in prevention studies.
Evaluation Review, 17, 144-158.
Moore, C., & Shulock, N. (2009). Student progress toward degree completion: Lessons from the
research literature. Sacramento, CA: Institute for Higher Education Leadership & Policy.
Moore, C., Shulock, N., & Offenstein, J. (2009). Steps to success: analyzing milestone
achievement to improve community college student outcomes. Sacramento, CA: Institute
for Higher Education Leadership & Policy.
National Governors Association Center for Best Practices & Council of Chief State School
Officers. (2012). Common Core State Standards Initiative: In the States. Retrieved June
12, 2012 from http://www.corestandards.org/in-the-states.
Noble, J., & Radunzel, J. (2007). College readiness = college success beyond the first year. Paper
presented at the Annual Forum of the Association for Institutional Research, June 2–6,
Kansas City, Missouri.
51
Noble, J., & Sawyer, R. (2002). Predicting different levels of academic success in college using
high school GPA and ACT Composite score. (ACT Research Report No. 2002-4). Iowa
City, IA: ACT, Inc.
Radunzel, J., & Noble, J. (2012). Tracking 2003 ACT
®
-tested high school graduates: College
readiness, enrollment, and long-term success. (ACT Research Report No. 2012-2). Iowa
City, IA: ACT, Inc.
Robbins, S., Allen, J., Casillas, A., Peterson, C., & Le, H. (2006). Unraveling the differential
effects of motivational and skills, social, and self-management measures from traditional
predictors of college outcomes. Journal of Educational Psychology, 98, 598-616.
Sackett, P.R., Kuncel, N.R., Arneson, J.J., Cooper, S.R., & Waters, S.D. (2009). Does
socioeconomic status explain the relationship between admission tests and post-
secondary academic performance? Psychological Bulletin, 135(1), 1-22.
Saupe, J.L., & Curs, B.R. (2008). Deriving enrollment management scores from ACT data. (IR
Applications No. 16). Tallahassee, FL: The Association for Institutional Research.
Sawyer, R. (2010). Usefulness of high school average and ACT scores in making college
admission decisions. (ACT Research Report No. 2010-2). Iowa City, IA: ACT, Inc.
Sawyer, R.L. (1996). Decision theory models for validating course placement tests. Journal of
Educational Measurement, 33, 271-290.
Schmitt, N., Keeney, J, Oswald, F.L., Pleskac, T.J., Billington, A.Q., Sinha, R., & Zorzie, M.
(2009). Prediction of 4-year college student performance using cognitive and
noncognitive predictors and the impact on demographic status of admitted students.
Journal of Applied Psychology, 94(6), 1479-1497.
Soares, J.A. (Ed.) (2012). SAT wars: The case for test-optional college admissions. New York,
NY: Teachers College Press.
Tinto, V. (2002, October). Enhancing student persistence: Connecting the dots. Paper presented
at the Optimizing the Nation’s Investment: Persistence and Success in Postsecondary
Education conference sponsored by the Wisconsin Center for the Advancement of
Postsecondary Education.
Westrick, P., Le, H., Robbins, S., Radunzel, J., & Schmidt, F. (2012). “Can Do” vs. “Will Do”:
The Relative Effects of ACT Scores and High School GPA on College Performance and
Retention. Manuscript in preparation.
Woodruff, D.J., & Ziomek, R.L. (2004). High school grade inflation from 1991 to 2003. (ACT
Research Report No. 2004-4). Iowa City, IA: ACT, Inc.
52
53
Appendix A
Figures A-1 to A-10
54
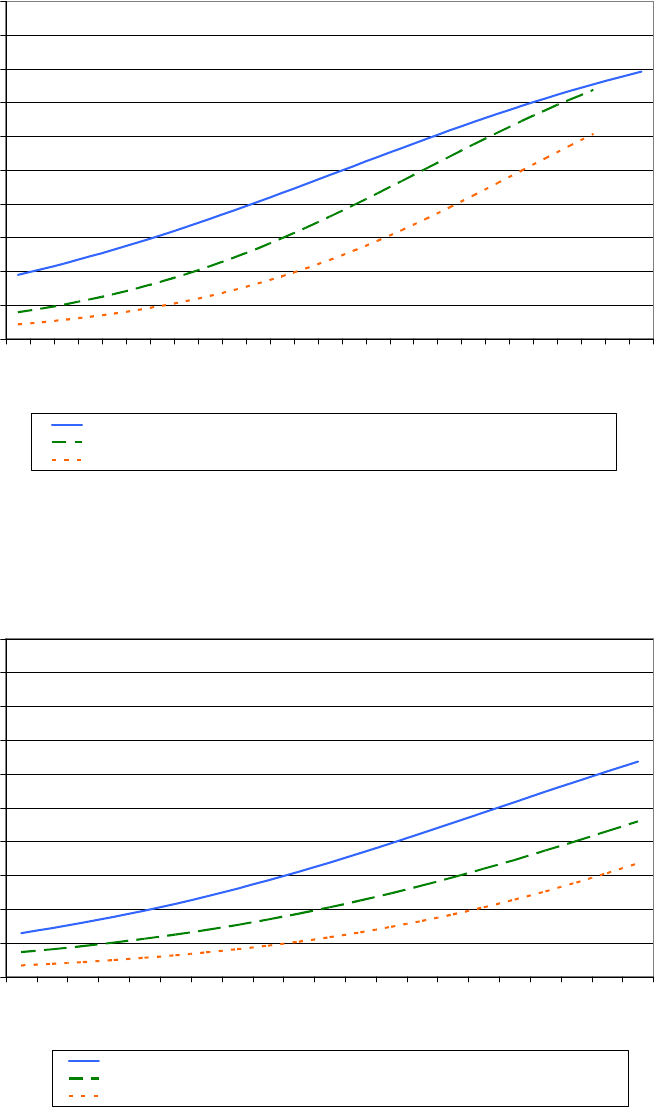
55
0
0.1
0.2
0.3
0.4
0.5
0.6
0.7
0.8
0.9
1
10 15 20 25 30 35
ACTC score
Probability
Bachelor's degree by year 6
Associate's degree or transfer to four-year institution by year 3
Associate's degree by year 3
Figure A-1. Estimated probabilities of degree completion based on ACTC score. ACTC = ACT
Composite.
0
0.1
0.2
0.3
0.4
0.5
0.6
0.7
0.8
0.9
1
2.0 2.5 3.0 3.5 4.0
HSGPA
Probability
Bachelor's degree by year 6
Associate's degree or transfer to four-year institution by year 3
Associate's degree by year 3
Figure A-2. Estimated probabilities of degree completion based on HSGPA. HSGPA = high
school grade point average.

56
0
0.1
0.2
0.3
0.4
0.5
0.6
0.7
0.8
0.9
1
10 15 20 25 30 35
ACTC score
Probability
Year 1 (24+ hours)
Year 2 (48+ hours)
Year 3 (72+ hours)
Year 4 (96+ hours)
Figure A-3. Estimated probabilities of progressing towards a degree based on ACTC score for
four-year institutions. ACTC = ACT Composite.
0
0.1
0.2
0.3
0.4
0.5
0.6
0.7
0.8
0.9
1
2.0 2.5 3.0 3.5 4.0
HSGPA
Probability
Year 1 (24+ hours)
Year 2 (48+ hours)
Year 3 (72+ hours)
Year 4 (96+ hours)
Figure A-4. Estimated probabilities of progressing towards a degree based on HSGPA for four-
year institutions. HSGPA = high school grade point average.

57
0
0.1
0.2
0.3
0.4
0.5
0.6
0.7
0.8
0.9
1
10 15 20 25 30 35
ACTC score
Probability
Year 1 (18+ hours)
Year 2 (36+ hours)
Year 3 (54+ hours)
Figure A-5. Estimated probabilities of progressing towards a degree based on ACTC score for
two-year institutions. ACTC = ACT Composite.
0
0.1
0.2
0.3
0.4
0.5
0.6
0.7
0.8
0.9
1
2.0 2.5 3.0 3.5 4.0
HSGPA
Probability
Year 1 (18+ hours)
Year 2 (36+ hours)
Year 3 (54+ hours)
Figure A-6. Estimated probabilities of progressing towards a degree based on HSGPA for two-
year institutions. HSGPA = high school grade point average.

58
0
0.1
0.2
0.3
0.4
0.5
0.6
0.7
0.8
0.9
1
10 15 20 25 30 35
ACTC score
Probability
3.00 or higher
3.25 or higher
3.50 or higher
3.75 or higher
Figure A-7. Estimated probabilities of achieving specific year 6 cumulative GPAs based on
ACTC score for four-year institutions. ACTC = ACT Composite.
0
0.1
0.2
0.3
0.4
0.5
0.6
0.7
0.8
0.9
1
2.0 2.5 3.0 3.5 4.0
HSGPA
Probability
3.00 or higher
3.25 or higher
3.50 or higher
3.75 or higher
Figure A-8. Estimated probabilities of achieving specific year 6 cumulative GPAs based on
HSGPA for four-year institutions. HSGPA = high school grade point average.

59
0
0.1
0.2
0.3
0.4
0.5
0.6
0.7
0.8
0.9
1
10 15 20 25 30 35
ACTC score
Probability
3.00 or higher
3.25 or higher
3.50 or higher
3.75 or higher
Figure A-9. Estimated probabilities of achieving specific year 3 cumulative GPAs based on
ACTC score for two-year institutions. ACTC = ACT Composite.
0
0.1
0.2
0.3
0.4
0.5
0.6
0.7
0.8
0.9
1
2.0 2.5 3.0 3.5 4.0
HSGPA
Probability
3.00 or higher
3.25 or higher
3.50 or higher
3.75 or higher
Figure A-10. Estimated probabilities of achieving specific year 3 cumulative GPAs based on
HSGPA for two-year institutions. HSGPA = high school grade point average.
60
61
Appendix B
Tables B-1 to B-4
62

63
Appendix B
Table B-1
Results for Bachelor’s Degree Completion and Progress to Degree at Four-Year Institutions based on ACTC Score and HSGPA
Models
Predictor
variable
Number
of
institutions
with viable
models
Selection value
(SV)
Maximum
accuracy rate
(maxAR)
Increase in AR
(∆AR)
Success rate
(SR)
Observed
percentage below
SV
Med Min/Max Med Min/Max Med Min/Max Med Min/Max Med Min/Max
Bachelor’s degree completion by year 6
ACTC 58 25 9/31 64 55/84 24 0/67 57 52/73 84 0/100
HSGPA 56 3.57 2.20/4.00 65 58/79 23 0/57 58 50/77 67 3/96
ACTC &
HSGPA
a
61 67 58/84 26 0/67 60 53/76 71 1/98
Progress to degree year 1
ACTC 44 18 10/23 71 62/84 4 0/58 70 61/84 22 0/89
HSGPA 48 2.80 1.39/3.72 73 66/86 6 0/51 73 58/86 25 0/89
ACTC &
HSGPA
a
48 74 66/83 6 0/59 74 67/83 28 0/87
Progress to degree year 2
ACTC 49 20 10/26 65 58/84 12 0/66 63 58/77 52 0/94
HSGPA 50 3.13 2.07/3.91 69 61/81 14 0/61 66 54/79 45 1/95
ACTC &
HSGPA
a
50 69 61/84 15 0/67 67 62/75 50 2/93
Progress to degree year 3
ACTC 50 22 9/28 65 55/84 19 0/68 60 55/76 66 0/97
HSGPA 50 3.39 2.38/3.97 67 60/82 21 0/64 62 51/76 57 2/97
ACTC &
HSGPA
a
50 68 59/85 22 0/68 64 59/74 62 2/95

64
Table B-1 (cont.)
Predictor
variable
Number
of
institutions
with viable
models
Selection value
(SV)
Maximum
accuracy rate
(maxAR)
Increase in AR
(∆AR)
Success rate
(SR)
Observed
percentage below
SV
Med Min/Max Med Min/Max Med Min/Max Med Min/Max Med Min/Max
Progress to degree year 4
ACTC 48 24 10/29 64 55/83 23 0/65 59 53/72 71 0/98
HSGPA 49 3.46 2.46/4.00 67 59/81 23 1/61 60 50/75 60 4/97
ACTC &
HSGPA
a
50 68 58/83 25 0/65 62 57/74 65 2/96
Note. The selection value is the predictor value associated with the maxAR. There were 61 and 50 institutions with available data for bachelor’s degree
completion and progress to degree analyses, respectively. Med = Median; Min = Minimum; Max = Maximum; ACTC = ACT Composite; HSGPA = high school
grade point average.
a
Multiple combinations of ACTC score and HSGPA corresponded to a probability of 0.50 for the joint model.

65
Table B-2
Results for Associate’s Degree Completion and Progress to Degree at Two-Year Institutions based on ACTC Score and HSGPA
Models
Predictor
variable
Number
of
institutions
with viable
models
Selection value
(SV)
Maximum
accuracy rate
(maxAR)
Increase in AR
(∆AR)
Success rate
(SR)
Observed
percentage below
SV
Med Min/Max Med Min/Max Med Min/Max Med Min/Max Med Min/Max
Associate’s degree completion by year 3
ACTC 25 29 24/33 81 66/93 63 32/86 55 51/62 99 92/100
HSGPA 5 3.92 3.82/3.98 72 69/74 43 36/48 52 51/54 90 83/94
ACTC &
HSGPA
a
25 82 66/93 64 31/86 53 50/56 99 82/100
Associate’s degree completion or transfer to four-year institution by year 3
ACTC 38 27 21/33 77 63/88 54 22/77 55 50/60 98 76/100
HSGPA 14 3.75 3.43/3.96 69 63/75 37 24/51 54 51/60 86 63/97
ACTC &
HSGPA
a
38 77 63/88 54 25/77 55 51/62 96 65/100
Progress to degree year 1
ACTC 41 19 11/31 66 57/80 17 0/59 65 52/73 52 0/99
HSGPA 41 3.03 1.66/3.68 65 62/77 15 0/47 64 56/77 50 1/90
ACTC &
HSGPA
a
42 68 62/79 18 0/58 67 52/77 51 1/100
Progress to degree year 2
ACTC 41 21 15/27 65 59/79 25 1/57 60 54/65 75 16/96
HSGPA 41 3.38 2.44/3.89 66 60/78 26 2/56 59 53/67 72 19/97
ACTC &
HSGPA
a
41 67 61/80 28 3/58 62 55/68 71 22/93

66
Table B-2 (cont.)
Predictor
variable
Number
of
institutions
with viable
models
Selection value
(SV)
Maximum
accuracy rate
(maxAR)
Increase in AR
(∆AR)
Success rate
(SR)
Observed
percentage below
SV
Med Min/Max Med Min/Max Med Min/Max Med Min/Max Med Min/Max
Progress to degree year 3
ACTC 41 23 17/30 67 58/82 34 5/64 57 53/61 88 37/99
HSGPA 36 3.62 2.85/3.96 68 58/77 33 6/54 56 51/65 83 40/98
ACTC &
HSGPA
a
41 69 59/83 35 7/65 58 54/66 81 42/98
Note. The selection value is the predictor value associated with the maxAR. There were 43 and 42 institutions with available data for associate’s degree
completion and progress to degree analyses, respectively. There were 40 institutions with data available for associate’s degree completion or transfer to a four-
year institution by year 3. Med = Median; Min = Minimum; Max = Maximum; ACTC = ACT Composite; HSGPA = high school grade point average.
a
Multiple combinations of ACTC score and HSGPA corresponded to a probability of 0.50 for the joint model.

67
Table B-3
Results for Achieving Levels of Year 6 College Cumulative GPA at Four-Year Institutions based on ACTC Score and HSGPA Models
Predictor
variable
Number
of
institutions
with viable
models
Selection value
(SV)
Maximum
accuracy rate
(maxAR)
Increase in AR
(∆AR)
Success rate
(SR)
Observed
percentage below
SV
Med Min/Max Med Min/Max Med Min/Max Med Min/Max Med Min/Max
3.00 or higher college GPA
ACTC 57 20 16/23 67 61/73 12 3/33 68 62/75 43 18/85
HSGPA 57 3.17 2.69/3.69 70 65/75 16 5/36 70 60/77 41 21/78
ACTC &
HSGPA
a
57 71 63/75 18 6/38 71 63/78 49 24/82
3.25 or higher college GPA
ACTC 57 24 20/27 70 64/81 33 15/60 64 56/70 76 45/96
HSGPA 57 3.59 3.03/3.96 73 64/80 35 10/59 63 53/70 68 33/94
ACTC &
HSGPA
a
57 75 67/82 39 12/63 67 61/73 74 41/94
3.50 or higher college GPA
ACTC 57 27 22/31 79 69/92 56 33/83 61 55/69 92 77/99
HSGPA 40 3.86 3.53/4.00 79 69/87 56 28/73 56 50/62 86 65/97
ACTC &
HSGPA
a
57 83 70/92 62 30/84 63 57/69 90 71/99

68
Table B-3 (cont.)
Predictor
variable
Number
of
institutions
with viable
models
Selection value
(SV)
Maximum
accuracy rate
(maxAR)
Increase in AR
(∆AR)
Success rate
(SR)
Observed
percentage below
SV
Med Min/Max Med Min/Max Med Min/Max Med Min/Max Med Min/Max
3.75 or higher college GPA
ACTC 56 31 26/34 91 78/98 82 57/96 58 52/65 99 94/100
HSGPA 2 4.00 4.00/4.00 84 79/89 67 57/77 50 50/50 90 87/92
ACTC &
HSGPA
a
57 92 80/98 84 57/96 59 54/64 98 89/100
Note. The selection value is the predictor value associated with the maxAR. Students’ cumulative GPAs at degree completion were included in year 6 GPA
analyses for students who graduated with a bachelor’s degree before the end of year 6. There were 57 institutions with data available for the year 6 college GPA
analyses. Med = Median; Min = Minimum; Max = Maximum; ACTC = ACT Composite; HSGPA = high school grade point average.
a
Multiple combinations of ACTC score and HSGPA corresponded to a probability of 0.50 for the joint model.

69
Table B-4
Results for Achieving Levels of Year 3 College Cumulative GPA at Two-Year Institutions based on ACTC Score and HSGPA Models
Predictor
variable
Number
of
institutions
with viable
models
Selection value
(SV)
Maximum
accuracy rate
(maxAR)
Increase in AR
(∆AR)
Success rate
(SR)
Observed
percentage below
SV
Med Min/Max Med Min/Max Med Min/Max Med Min/Max Med Min/Max
3.00 or higher college GPA
ACTC 42 20 17/23 66 62/71 22 5/38 63 58/70 67 34/92
HSGPA 42 3.30 2.70/3.54 68 63/72 25 6/42 62 59/68 64 32/85
ACTC &
HSGPA
a
42 70 63/74 27 7/44 66 61/71 67 39/84
3.25 or higher college GPA
ACTC 42 23 21/26 74 65/80 46 24/61 62 55/67 88 62/98
HSGPA 42 3.73 3.41/3.95 75 64/80 48 24/58 56 52/61 86 68/96
ACTC &
HSGPA
a
42 77 67/81 50 27/61 64 58/67 85 64/95
3.50 or higher college GPA
ACTC 42 26 23/29 84 74/89 66 44/78 60 53/66 97 86/100
HSGPA 5 3.98 3.93/4.00 78 76/81 55 51/63 51 50/53 93 88/95
ACTC &
HSGPA
a
42 85 76/90 68 48/79 61 55/64 95 84/99

70
Table B-4 (cont.)
Predictor
variable
Number
of
institutions
with viable
models
Selection value
(SV)
Maximum
accuracy rate
(maxAR)
Increase in AR
(∆AR)
Success rate
(SR)
Observed
percentage below
SV
Med Min/Max Med Min/Max Med Min/Max Med Min/Max Med Min/Max
3.75 or higher college GPA
ACTC 40 29 27/33 92 85/96 84 70/91 58 50/69 99 98/100
HSGPA 0
ACTC &
HSGPA
a
41 93 86/96 85 72/91 58 52/80 99 97/100
Note. The selection value is the predictor value associated with the maxAR. Students’ cumulative GPAs at degree completion were included in year 3 GPA
analyses for students who graduated with an associate’s degree before the end of year 3. There were 42 institutions with available data for the year 3 cumulative
GPA analyses. Med = Median; Min = Minimum; Max = Maximum.
a
Multiple combinations of ACTC score and HSGPA corresponded to a probability of 0.50 for the joint model.
71
Appendix C
Tables C-1 to C-4
72

73
Table C-1
Results for Bachelor’s Degree Completion and Progress to Degree at Four-Year Institutions
based on ACT College Readiness Benchmarks
Subject
area
ACT
Benchmark
score
Probability of
success at
Benchmark
Success rate
(SR)
Increase in SR
(∆SR)
Med Min/Max Med Min/Max Med Min/Max
Bachelor’s degree completion by year 6
English 18 0.35 0.12/0.76 46 21/80 5 1/12
Mathematics 22 0.46 0.23/0.79 53 30/82 13 3/30
Reading 21 0.39 0.17/0.78 47 22/80 5 1/13
Science 24 0.47 0.24/0.80 52 29/81 11 2/25
Progress to degree year 1
English 18 0.59 0.26/0.84 71 44/88 6 2/21
Mathematics 22 0.73 0.51/0.87 82 66/90 15 4/47
Reading 21 0.67 0.35/0.86 74 45/89 7 2/21
Science 24 0.76 0.53/0.89 81 61/91 12 3/42
Progress to degree year 2
English 18 0.45 0.15/0.74 59 31/81 6 3/15
Mathematics 22 0.61 0.36/0.77 70 49/83 15 5/38
Reading 21 0.53 0.24/0.79 61 34/83 7 2/15
Science 24 0.62 0.39/0.83 69 47/85 14 4/33
Progress to degree year 3
English 18 0.39 0.12/0.73 51 25/79 6 3/13
Mathematics 22 0.53 0.29/0.76 62 42/81 16 4/33
Reading 21 0.46 0.19/0.77 53 27/81 7 3/14
Science 24 0.56 0.31/0.80 61 39/82 14 4/30
Progress to degree year 4
English 18 0.37 0.12/0.73 48 24/79 6 2/12
Mathematics 22 0.51 0.27/0.76 57 38/81 15 4/28
Reading 21 0.43 0.18/0.77 51 26/80 7 2/13
Science 24 0.53 0.29/0.80 58 36/82 13 4/25
Note. These analyses were based on all institutions with available data for each outcome (61 institutions for
bachelor’s degree completion and 50 for progress to degree outcomes). Med = Median; Min = Minimum; Max =
Maximum.

74
Table C-2
Results for Associate’s Degree Completion and Progress to Degree at Two-Year Institutions
based on ACT College Readiness Benchmarks
Subject
area
ACT
Benchmark
score
Probability of
success at
Benchmark
Success rate
(SR)
Increase in SR
(∆SR)
Med Min/Max Med Min/Max Med Min/Max
Associate’s degree completion by year 3
English 18 0.12 0.04/0.34 18 6/41 4 1/9
Mathematics 22 0.22 0.07/0.50 28 10/59 14 3/26
Reading 21 0.15 0.05/0.36 19 7/42 5 2/10
Science 24 0.23 0.07/0.49 26 9/54 12 4/21
Associate’s degree completion or transfer to four-year institution by year 3
English 18 0.21 0.09/0.41 29 13/51 6 3/11
Mathematics 22 0.36 0.15/0.61 42 19/70 19 11/28
Reading 21 0.25 0.10/0.45 30 13/52 7 4/11
Science 24 0.35 0.14/0.58 38 16/63 16 8/22
Progress to degree year 1
English 18 0.49 0.16/0.78 62 26/83 12 6/21
Mathematics 22 0.70 0.23/0.87 79 29/90 27 9/44
Reading 21 0.56 0.20/0.80 64 27/83 14 5/26
Science 24 0.70 0.30/0.86 74 38/88 23 11/38
Progress to degree year 2
English 18 0.38 0.10/0.62 49 14/69 9 2/16
Mathematics 22 0.57 0.13/0.78 64 15/83 24 4/35
Reading 21 0.44 0.12/0.64 50 15/70 10 3/17
Science 24 0.57 0.16/0.75 62 19/78 20 7/29
Progress to degree year 3
English 18 0.32 0.06/0.55 41 9/63 8 2/12
Mathematics 22 0.49 0.08/0.71 57 10/77 22 3/31
Reading 21 0.37 0.07/0.58 43 10/64 9 3/12
Science 24 0.49 0.09/0.69 53 11/73 19 4/24
Note. These analyses were based on all institutions with available data for each outcome (43 institutions for
associate’s degree completion, 40 for associate’s degree completion or transfer to a four-year institution, and 42 for
progress to degree outcomes). Med = Median; Min = Minimum; Max = Maximum.

75
Table C-3
Results for Achieving Levels of Year 6 College Cumulative GPA at Four-Year Institutions based
on ACT College Readiness Benchmarks
Subject
area
ACT
Benchmark
score
Probability of
success at
Benchmark
Success rate
(SR)
Increase in SR
(∆SR)
Med Min/Max Med Min/Max Med Min/Max
3.00 or higher college GPA
English 18 0.46 0.33/0.62 65 49/78 10 5/19
Mathematics 22 0.66 0.48/0.78 76 60/86 19 9/35
Reading 21 0.59 0.43/0.71 69 53/81 12 7/22
Science 24 0.72 0.54/0.82 77 60/86 19 11/33
3.50 or higher college GPA
English 18 0.13 0.05/0.35 29 19/43 7 3/11
Mathematics 22 0.28 0.14/0.52 40 24/60 18 8/29
Reading 21 0.22 0.12/0.41 34 22/48 10 6/16
Science 24 0.34 0.20/0.53 43 30/56 19 10/25
Note. Students’ cumulative GPAs at degree completion were included in Year 6 GPA analyses for students who
graduated with a bachelor’s degree before the end of year 6. These analyses were based on all 57 institutions with
year 6 college cumulative GPA data available. Med = Median; Min = Minimum; Max = Maximum; GPA = grade
point average.

76
Table C-4
Results for Achieving Levels of Year 3 College Cumulative GPA at Two-Year Institutions based
on ACT College Readiness Benchmarks
Subject
area
ACT
Benchmark
score
Probability of
success at
Benchmark
Success rate
(SR)
Increase in SR
(∆SR)
Med Min/Max Med Min/Max Med Min/Max
3.00 or higher college GPA
English 18 0.42 0.33/0.59 55 43/70 13 8/15
Mathematics 22 0.63 0.51/0.79 70 57/86 26 17/31
Reading 21 0.50 0.40/0.64 60 46/73 16 10/21
Science 24 0.63 0.51/0.78 68 55/82 24 18/31
3.50 or higher college GPA
English 18 0.14 0.09/0.25 25 17/40 8 5/12
Mathematics 22 0.30 0.21/0.50 39 28/63 23 15/35
Reading 21 0.21 0.13/0.32 29 21/44 12 8/16
Science 24 0.34 0.22/0.51 41 28/59 23 15/31
Note. Students’ cumulative GPAs at degree completion were included in Year 3 GPA analyses for students who
graduated with an associate’s degree before the end of year 3. These analyses were based on all 42 institutions with
year 3 college cumulative GPA data available. Med = Median; Min = Minimum; Max = Maximum; GPA = grade
point average.
77
Appendix D
Tables D-1 to D-2
78

79
Table D-1
Direct, Indirect, and Total Effects on Long-Term College Outcomes for Four-Year Institutions
Predictor
First-year
college GPA Long-term college outcome
Direct
effect
Direct
effect
Indirect
effect
Total
effect
Bachelor’s degree completion by year 6
ACTC 0.26 NS 0.26 0.26
HSGPA 0.35 0.07 0.24 0.31
First-year GPA – 0.52 – 0.52
Year 6 college cumulative GPA
ACTC 0.31 0.09 0.36 0.45
HSGPA 0.32 0.12 0.35 0.47
First-year GPA – 0.68 – 0.68
Progress to degree year 2
ACTC 0.26 NS 0.29 0.29
HSGPA 0.35 0.07 0.29 0.36
First-year GPA – 0.62 – 0.62
Progress to degree year 3
ACTC 0.26 NS 0.28 0.28
HSGPA 0.35 0.07 0.28 0.35
First-year GPA – 0.59 – 0.59
Progress to degree year 4
ACTC 0.26 NS 0.28 0.28
HSGPA 0.35 0.07 0.27 0.34
First-year GPA – 0.58 – 0.58
Note. The direct effects of ACTC score and HSGPA on first-year college GPA for the analyses based on year 6
college cumulative GPA differ from those based on the other outcomes, because the former case includes only those
students with a year 6 cumulative GPA (i.e., those who either graduated prior to year 6 or were still enrolled at year
6). In comparison, the latter group includes all students from four-year institutions with the needed data available to
calculate the outcome of interest (see Table 1). ACTC = ACT Composite; HSGPA = high school grade point
average; GPA = grade point average; NS = not significant at the 0.01 level.

80
Table D-2
Direct, Indirect, and Total Effects on Long-Term College Outcomes for Two-Year Institutions
Predictor
First-year
college GPA Long-term college outcome
Direct
effect
Direct
effect
Indirect
effect
Total
effect
Associate’s degree completion by year 3
ACTC 0.18 0.06 0.21 0.27
HSGPA 0.29 0.16 0.20 0.36
First-year GPA – 0.46 – 0.46
Associate’s degree completion or transfer to four-year institution by year 3
ACTC 0.18 0.09 0.20 0.29
HSGPA 0.30 0.13 0.21 0.34
First-year GPA – 0.44 – 0.44
Year 3 college cumulative GPA
ACTC 0.22 0.10 0.34 0.44
HSGPA 0.35 0.12 0.38 0.50
First-year GPA – 0.71 – 0.71
Progress to degree year 2
ACTC 0.18 0.14 0.20 0.34
HSGPA 0.29 0.13 0.24 0.37
First-year GPA – 0.47 – 0.47
Progress to degree year 3
ACTC 0.18 0.10 0.20 0.30
HSGPA 0.29 0.14 0.22 0.36
First-year GPA – 0.46 – 0.46
Note. The direct effects of ACTC score and HSGPA on first-year college GPA for the analyses based on year 3
cumulative GPA differ from those based on the other outcomes, because the former case includes only those
students with a year 3 cumulative GPA (i.e., those who either graduated prior to year 3 or were still enrolled at year
3). In comparison, the latter group includes all students from two-year institutions with the needed data available to
calculate the outcome of interest (see Table 1). ACTC = ACT Composite; HSGPA = high school grade point
average; GPA = grade point average; NS = not significant at the 0.01 level.
*050205120* Rev 1
Predicting Long-Term
College Success through
Degree Completion Using
ACT
®
Composite Score, ACT
Benchmarks, and High School
Grade Point Average
Justine Radunzel
Julie Noble
August 2012
ACT Research
Report Series
2012 (5)
