
Master Transcription Factors Regulate the DNA Methylation
Landscape During Hepatocyte Differentiation
Takahiro Suzuki
1,2
, Erina Furuhata
1†
, Shiori Maeda
1†
, Mami Kishima
1
, Yurina
Miyajima
1
, Yuki Tanaka
1, 2
, Joanne Lim
1
, Hajime Nishimura
1
, Yuri Nakanish
1
, Aiko
Shojima
1, 2
, Harukazu Suzuki
1*
1
RIKEN Center for Integrated Medical Science (IMS), Laboratory for Cellular Function Conversion Technology,
RIKEN Yokohama Campus, 1-7-22 Suehiro-cho, Tsurumi-ku, Yokohama City, Kanagawa 230-0045, Japan
2
Graduate School of Medical Life Science, Yokohama City University, 1-7-29 Suehiro-cho, Tsurumi-ku, Yokohama
City, Kanagawa 230-0045, Japan
†
These authors contributed equally to this work.
*Correspondence: harukazu.suzuki@riken.jp
Background: Hepatocytes are the dominant cell type of the human liver, with functions
in metabolism, detoxification, and in producing secreted proteins. During the process of
hepatocyte differentiation, gene regulation and master transcription factors have been
extensively investigated, whereas little is known about how the epigenome is regulated,
particularly the dynamics of DNA methylation, and the upstream factors that have
critical roles.
Results: By examining changes in the transcriptome and the methylome during in vitro
hepatocyte differentiation, we identified putative DNA methylation-regulating
transcription factors, which are likely involved in DNA demethylation and maintenance
of hypo-methylation in a differentiation stage-specific manner. Of these factors, we
further reveal that GATA6 induces DNA demethylation together with chromatin
activation at a binding-site-specific manner during endoderm differentiation.
Conclusions: These results provide an insight into the spatiotemporal regulatory
mechanisms exerted on the DNA methylation landscape by transcription factors, and
uncover a new role for transcription factors in early liver development.
preprint (which was not certified by peer review) is the author/funder. All rights reserved. No reuse allowed without permission.
The copyright holder for thisthis version posted December 17, 2020. ; https://doi.org/10.1101/2020.12.16.423165doi: bioRxiv preprint
Background
Hepatocytes, the major parenchymal cells in the liver, are responsible for key
liver functions such as metabolism and detoxification. In embryogenesis, the first fate
decision to the hepatocyte lineage is the differentiation of primitive streak cells to
definitive endoderm (DE) cells, which are a common precursor of endoderm tissues
such as liver, pancreas, and gut. Hepatoblasts are hepatic progenitor cells derived from
the DE cells, which then differentiate into fetal-like hepatocytes and mature hepatocytes
in a stepwise manner. Thus, hepatocytes emerge from pluripotent stem cells through
several progenitor cell types.
Several transcription factors (TFs), including c-Jun, and members of the HNF
and GATA families are known to play important roles in liver development and
hepatocyte differentiation [1–9]. For instance, transcription factor HNF4A is
indispensable for specification and early development of the liver [9]. Furthermore,
HNF4A is required for the transcriptional activation of genes such as CYP3A4 and
CYP2D6, which are crucial for hepatocyte metabolic functions [3,4]. GATA4 and
GATA6 are also essential for development of endoderm-derived tissues and cells,
including hepatocytes [6–8]. Notably, GATA6 knock-out mice die around E5.5 due to a
deficiency of extra-embryonic endoderm development, which can be rescued by
tetraploid embryo complementation assays, and indicating that GATA6 is required for
liver development and hepatic specification [8,10–12]. Thus, multiple TFs sequentially
and coordinately regulate peripheral genes necessary for hepatocyte differentiation.
Gene expression dynamics are regulated not only by the action of transcription
factors but also by epigenetic modifications such as DNA methylation. In mammals,
most DNA methylation occurs at the cytosines of CpG dinucleotides, adding a methyl
group at the 5-carbon of the cytosine. DNA methylation of gene regulatory regions
appears to be associated with silencing of the expression of the downstream gene [13].
Specifically, gene regulatory regions must be demethylated for activation of the
downstream gene. Consistent with this, the DNA methylation profile is dramatically
altered during embryogenesis and cellular differentiation, with roles in tightly regulating
preprint (which was not certified by peer review) is the author/funder. All rights reserved. No reuse allowed without permission.
The copyright holder for thisthis version posted December 17, 2020. ; https://doi.org/10.1101/2020.12.16.423165doi: bioRxiv preprint
expression of downstream genes [14–17]. Indeed, it is reported that DNA methylation
plays a crucial role in the expression of numerous liver-specific genes [12,18–24].
Furthermore, expression of CEBP hepatic transcription factors are affected by
treatment with the DNA methyltransferase (DNMT) inhibitor, 5-Aza-dC[25].
Interestingly, the DNMT inhibitor facilitates trans-differentiation of adipose tissue-
derived stem cells or mesenchymal stem cells to hepatocyte-like cells[26–28].
Collectively, these findings show that DNA methylation is a crucial factor for hepatic
differentiation.
The gain of DNA methylation is directly achieved by de novo DNMTs [17,29–
31], and methylation status is maintained during cell divisions by a maintenance DNMT
[31–34]. If DNA methylation maintenance does not work properly, the level of DNA
methylation declines upon cell proliferation, which is known as passive DNA
demethylation[35]. Alternatively, it is plausible that sequential oxidative processes
achieve active DNA demethylation by ten-eleven translocation (TET) enzymes [36–40],
followed by base-excision repair[40,41]. In addition, the oxidized forms of methylated
cytosine (5-hydroxymethyl cytosines (5hmC), 5-formyl cytosine (5fC), and 5-carboxy
cytosine (5caC)) are also depleted by passive demethylation mechanisms, because these
bases are not recognized by the maintenance DNA methylation mechanism [42,43].
Thus, DNA methylation is a balance between gain and loss of methylated bases.
In addition to the mechanisms by which DNA methylation is gained and lost,
mechanisms underlying spatiotemporal regulation of DNA methylation are also critical
in understanding the overall dynamics of DNA methylation. We and other groups
recently reported that some TFs regulate the timing and site-specificity of DNA
demethylation [44–50]. We found that RUNX1, an essential transcription factor for
hematopoietic development and immune cell functions, induces DNA demethylation by
recruiting the TET enzymes and TDG to their binding sites[44]. We have also identified
eight novel DNA-demethylating TFs using a screening method we developed[45]. In
addition to our findings, other groups have reported DNA-demethylating TFs with roles
in several biological processes[46–50]. Thus, a growing body of evidence suggests
preprint (which was not certified by peer review) is the author/funder. All rights reserved. No reuse allowed without permission.
The copyright holder for thisthis version posted December 17, 2020. ; https://doi.org/10.1101/2020.12.16.423165doi: bioRxiv preprint
critical roles for TFs in the regulation of DNA methylation. However, the epigenetic
roles of TFs specific for hepatocyte differentiation have yet to be identified.
In the present study, we combine TF binding motif (TFBM) overrepresentation
analysis for differentially methylated regions [45] with transcriptome analysis. We
identify TFs with putative roles in regulating DNA methylation during hepatocyte
differentiation by studying in vitro the process of hepatocyte differentiation from human
induced pluripotent stem (iPS) cells. Of these TFs, we validate that GATA6 is a master
regulator for both DNA demethylation and chromatin activation in the differentiation of
the DE. Our data provide significant insights into the regulatory mechanisms shaping
the DNA methylation landscape during hepatocyte differentiation.
Results
DNA methylation dynamics throughout hepatocyte differentiation
We induced hepatocytes from human iPS cells in vitro and examined the
transcriptome by Cap Analysis Gene Expression (CAGE)[51] (Fig. 1A, B). Expression
of pluripotent marker genes (POU5F1 and NANOG) was considerably downregulated
after day 7 of differentiation and undetectable after day 14 (Fig. S1). In contrast, DE
markers (SOX17 and FOXA2) and hepatic markers (HNF1B, PPARA, AFP, and PAX6)
were upregulated at day 7 and day 14-to-day 28, respectively (Fig. S1). Notably,
because AFP is known to be upregulated in immature hepatocytes and to be
downregulated in mature hepatocytes, and PAX6 is a maturation marker of hepatocytes,
our data confirmed the in vitro differentiation mimics the whole process of in vivo
hepatocyte differentiation[52]. Thus, our time-course samples represent day 0 as iPS
cells, day 7 as DE, day 14 as hepatoblasts, day 21 as fetal-like hepatocytes, and day 28
as mature hepatocytes, respectively (Fig. 1A, B).
To investigate changes in DNA methylation during hepatocyte differentiation,
we performed a methylome analysis of the time-course samples using MethylationEPIC
BeadChip (Illumina). Hierarchical clustering showed that iPS cells and DE cells were
segregated from the differentiated cells that followed in the time-course, consistent with
preprint (which was not certified by peer review) is the author/funder. All rights reserved. No reuse allowed without permission.
The copyright holder for thisthis version posted December 17, 2020. ; https://doi.org/10.1101/2020.12.16.423165doi: bioRxiv preprint

a commitment to the hepatocyte lineage (Fig. 1C). Comparing adjacent time points, we
identified 3088, 446, 38, and 54 methylated CpGs and 3809, 11652, 7383, and 864
demethylated CpGs in each interval (Fig. 1D). Thus, although the gain of methylation
mostly occurs in early time points, the number of the differentially methylated CpGs
were biased toward demethylation in all intervals, indicating that demethylation (loss of
Fig. 1 Time-course methylome analysis of hepatocyte differentiation
(A) Schematic illustration of in vitro hepatocyte differentiation. (B) Pictures of each
time point. The scale bar is 200 μm. (C) A correlation matrix with hierarchical
clustering. The color represents the correlation coefficient (R). (D) The number of
differentially methylated probes. The left bar plot (red) is methylation and the right
bar plot (green) is demethylation.
preprint (which was not certified by peer review) is the author/funder. All rights reserved. No reuse allowed without permission.
The copyright holder for thisthis version posted December 17, 2020. ; https://doi.org/10.1101/2020.12.16.423165doi: bioRxiv preprint
methylation) predominates in the dynamics of DNA methylation during hepatocyte
differentiation.
We associated biological functions to the differentially methylated regions
using the Genomic Region Enrichment of Annotations Tool (GR E AT )[53] and
summarized the results based on semantic similarity[54]. This analysis revealed an
enrichment in development and morphogenesis related Gene Ontologies (GOs),
including "pattern specification process", "anatomical structure development", "radial
pattern formation", "developmental process", and "regulation of developmental process"
(Fig S1B and C). Overall, these results imply that DNA methylation mainly regulates
genes related to the developmental process, consistent with specifying the cells into the
hepatocyte lineage.
Prediction of DNA methylation-regulating transcription factors throughout
hepatocyte differentiation
We previously developed a screening system to identify TFs which regulate
binding site-directed DNA methylation (hereinafter referred to as DNA methylation-
regulating TFs), which is based on TF binding motif (TFBM) overrepresentation
analysis for differentially methylated CpG regions using ectopic TF overexpression
[45]. By modifying this system, we here performed TFBM overrepresentation analysis
for the differentially methylated CpG regions between two adjacent time points of the
differentiation time-course with the TFBM position weight matrix (PWM) database of
the IMAGE tool [55]. This database covers most of the known TFs. Because some TFs,
such as TFs in the same family, share the same or similar binding motif, the results of
TFBM overrepresentation analysis often include false positives. Therefore, to reduce the
possibility of false positives, we further narrowed down the overrepresented TFBMs by
considering TF expression (CAGE tag per million (TPM) ≥ 50) in either of the two
adjacent time points of an interval (Fig. 2A). Thus, by combining methylome and
transcriptome analyses, we identified putative DNA methylation-regulating TFs.
Comparing each adjacent timepoint, we identified in total 16 putative DNA
preprint (which was not certified by peer review) is the author/funder. All rights reserved. No reuse allowed without permission.
The copyright holder for thisthis version posted December 17, 2020. ; https://doi.org/10.1101/2020.12.16.423165doi: bioRxiv preprint

methylation-regulating TFs in the methylated regions. Of these, 13 TFs, including
POU5F1, a pluripotent cell-specific TF, were identified in the DE differentiation stage
(Day 0 -to- Day 7) (Fig. 2B). In addition, GATA6, GATA3, and GATA4 were identified
in the hepatoblast differentiation stage (Day 7 -to- Day 14) (Fig. 2B). Interestingly,
these putative DNA methylation-regulating TFs for the methylated regions were prone
to being highly expressed in the earlier time point of the intervals and then declined
along with the progress of differentiation (Fig. 2C and D; Fig. S2A).
Fig. 2 Prediction of DNA methylation-regulating TFs.
(A) The workflow of DNA methylation-regulating TF prediction. (B, D) Heatmap
showing the p-value of over-represented TF binding motifs at methylated (B) and
demethylated (D) regions. Each column is an interval of adjacent time points. Each
row is a putative methylation-regulating TF. Dendrogram of hierarchical clustering is
shown at the left of the heatmap and clusters are shown at the right of the heatmap
as colors. (C) mRNA expression profile of the cluster 1 and 2 putative DNA
methylation-regulating TFs for methylated regions. X- and Y-axes show time points
of differentiation (hours from differentiation initiation) and tag-per-million (TPM) of
CAGE, respectively. The color of each line represents the maximum TPM. Cluster 3
and 4 and the putative DNA methylation-regulating TFs for demethylated regions
were shown in Fig. S2 (E) mRNA expression profile of the GATA3, GATA4, and
GATA6. X- and Y-axes show time points of differentiation (hours from differentiation
initiation) and tag-per-million (TPM) of CAGE, respectively. The color of each line
represents the maximum TPM.
preprint (which was not certified by peer review) is the author/funder. All rights reserved. No reuse allowed without permission.
The copyright holder for thisthis version posted December 17, 2020. ; https://doi.org/10.1101/2020.12.16.423165doi: bioRxiv preprint
On the other hand, we identified 50 putative DNA methylation-regulating TFs
at demethylated regions. Of these, HNF4A, an essential TF for liver development [3][4],
was identified in the hepatoblast differentiation stage (Fig. 2D). In addition, the
overrepresentation of TFBMs for Activator Protein 1 (AP-1) components such as JUN
and FOS, which are involved in the stress response and regeneration in the liver[56–58],
increased from the DE differentiation stage to the fetal-like hepatocyte differentiation
stage (day 14 -to-day 21) (Fig. 2D). Importantly, GATA6, GATA4, and GATA3, which
were also identified in the methylated regions of the hepatoblast differentiation stage,
were firstly identified in the DE differentiation stage and overrepresentation of these
binding motifs declined as differentiation proceeded (Fig. 2D). Contrary to the putative
DNA methylation-regulating TFs for the methylated regions, expression of the putative
DNA methylation-regulating TFs for the demethylated regions tends to be upregulated
in later timepoints of the intervals (Fig. 2E; Fig. S2B). Taken together, these results
suggest that diverse TFs cooperatively regulate the DNA methylation landscape. In
particular, GATA transcription factors appear to be the major factors for the DNA
methylation regulation, participating in both methylation and demethylation changes.
Ectopic GATA6 overexpression induces binding site-directed DNA demethylation
Our data suggested the GATA family is a crucial factor for regulating
DNA methylation during hepatocyte differentiation, mainly contributing to the
demethylation that occurs in DE differentiation. Of the GATA proteins, GATA4 and
GATA6 were consistent with the pattern of mRNA expression and are known to be
essential TFs for the DE differentiation stage [6–8]. Therefore, we focused the following
analysis on possible epigenetic functions o f G ATA4 and GATA6 in DE differentiation.
Firstly, we performed qRT-PCR to confirm the expression changes of GATA4 and
GATA6 during the DE differentiation stage. Expression of both GATA4 and GATA6
started increasing from 48 hours after induction of the differentiation and were
maximized at 66 hours and 60 hours, respectively, suggesting that GATA6 expression
precedes GATA4 expression (Fig. 3A).
preprint (which was not certified by peer review) is the author/funder. All rights reserved. No reuse allowed without permission.
The copyright holder for thisthis version posted December 17, 2020. ; https://doi.org/10.1101/2020.12.16.423165doi: bioRxiv preprint

Furthermore, GATA6 expression increased drastically, greater than 1,000-fold
at 60 hours compared with 48 hours, whereas GATA4 expression increased only 4-fold
at 66 hours compared with 48 hours, indicating the dominant impact of GATA6 (Fig.
3A). Indeed, GATA6 is reported to be an upstream factor of GATA4[11]. Therefore, we
next overexpressed GATA6 in HEK293T cells, followed by methylome analysis to
investigate the role of GATA6 in regulating DNA demethylation. In the HEK293T cells
overexpressing GATA6, we identified 1,280 and 4,696 methylated and demethylated
CpGs, as compared with mock control transduced cells (Fig. 3B). The motif
overrepresentation analysis for the differentially methylated regions revealed that the
Fig. 3 GATA6-mediated binding site-directed DNA demethylation.
(A) qRT-PCR analysis for GATA4 (left) and GATA6 (right). X- and Y-axes show time
points of differentiation (hours from differentiation initiation) and fold-change
(compared with 0 hours, log
2
scaled), respectively. (B) Scatter plot showing M-value
of each probe. X- and Y-axes show M-values of the control sample and GATA6-
overexpressing sample, respectively. Dotted lines represent △M = 2 or -2. Green
and red dots are methylated and demethylated probes, respectively, and the number
of each probe is shown at the upper left and lower right. (C) Distribution of enrichment
score for the GATA6 binding motif within ±5,000 bp of methylated (left) and
demethylated (right) CpG probes in GATA6-overexpressing 293T cells. X- and Y-axes
show distance from probe CpG position and enrichment score, respectively.
Horizontal lines are enrichment score = 0.
preprint (which was not certified by peer review) is the author/funder. All rights reserved. No reuse allowed without permission.
The copyright holder for thisthis version posted December 17, 2020. ; https://doi.org/10.1101/2020.12.16.423165doi: bioRxiv preprint
GATA6 binding motif was significantly overrepresented at the demethylated regions but
not at methylated regions in the GATA6 overexpressing cells, indicating that GATA6
functions in binding site-directed DNA demethylation (Fig. 3C).
DNA demethylation accompanies GATA6 binding during iPS-DE differentiation
To investigate the dynamics by which GATA6 regulates DNA demethylation,
we performed finer time-course transcriptome and methylome analyses during the time-
window of GATA6 emergence (after 0 hours (h), 48 h, 54 h, 60 h, 66 h, and 72 h of the
differentiation process) (Fig. 4A). T, a marker of the primitive-streak, was upregulated
at 48 h and was downregulated after 54 h. DE markers were upregulated during the
period 48 h-to-72 h (Fig. S3A). In agreement with the qRT-PCR analysis (Fig. 3A), the
expression of GATA6 was slightly upregulated at 48 h and drastically increased after 48
h (Fig. S3A). Hence, our data indicate DE commitment occurs during the period 48 h -
to- 72 h into the differentiation process.
By comparing adjacent time points, we identified 120 (0 h -to- 48 h), 94 (48 h -
to- 54 h), 26 (54 h -to- 60 h), 19 (60 h -to- 66 h), and 50 (66 h -to- 72 h) methylated
CpGs and 220 (0 h -to- 48 h), 226 (48 h -to- 54 h), 33 (54 h -to- 60 h), 27 (60 h -to- 66
h), and 27 (66 h -to- 72 h) demethylated CpGs, respectively (Fig. 4B). However, we did
not find the GATA6 binding motif overrepresented at those demethylated regions during
any interval (Fig. S3B). Because the time intervals between adjacent time points are 6
hours except for the initial period (0 h -to- 48 h), the changes in methylation levels may
not be enough to be detected as demethylation (△M > 2). Indeed, the GATA6 binding
motif was overrepresented at the regions demethylated between 0 h and 72 h and these
demethylated regions tend to be continuously demethylated from 0 h (Fig. S3C and D).
Therefore, to investigate whether the GATA6 binding motif is overrepresented for the
cumulative changes in methylation, we compared the regions demethylated at each time
point with that at 0 h. We identified 220 (0 h -to- 48 h), 236 (0 h -to- 54 h), 416 (0 h -to-
60 h), 876 (0 h -66 h), and 620 (0 h -to- 72 h) demethylated-CpGs (Fig. 4C). Because
these demethylated CpGs include those that were demethylated in the earlier time point
preprint (which was not certified by peer review) is the author/funder. All rights reserved. No reuse allowed without permission.
The copyright holder for thisthis version posted December 17, 2020. ; https://doi.org/10.1101/2020.12.16.423165doi: bioRxiv preprint
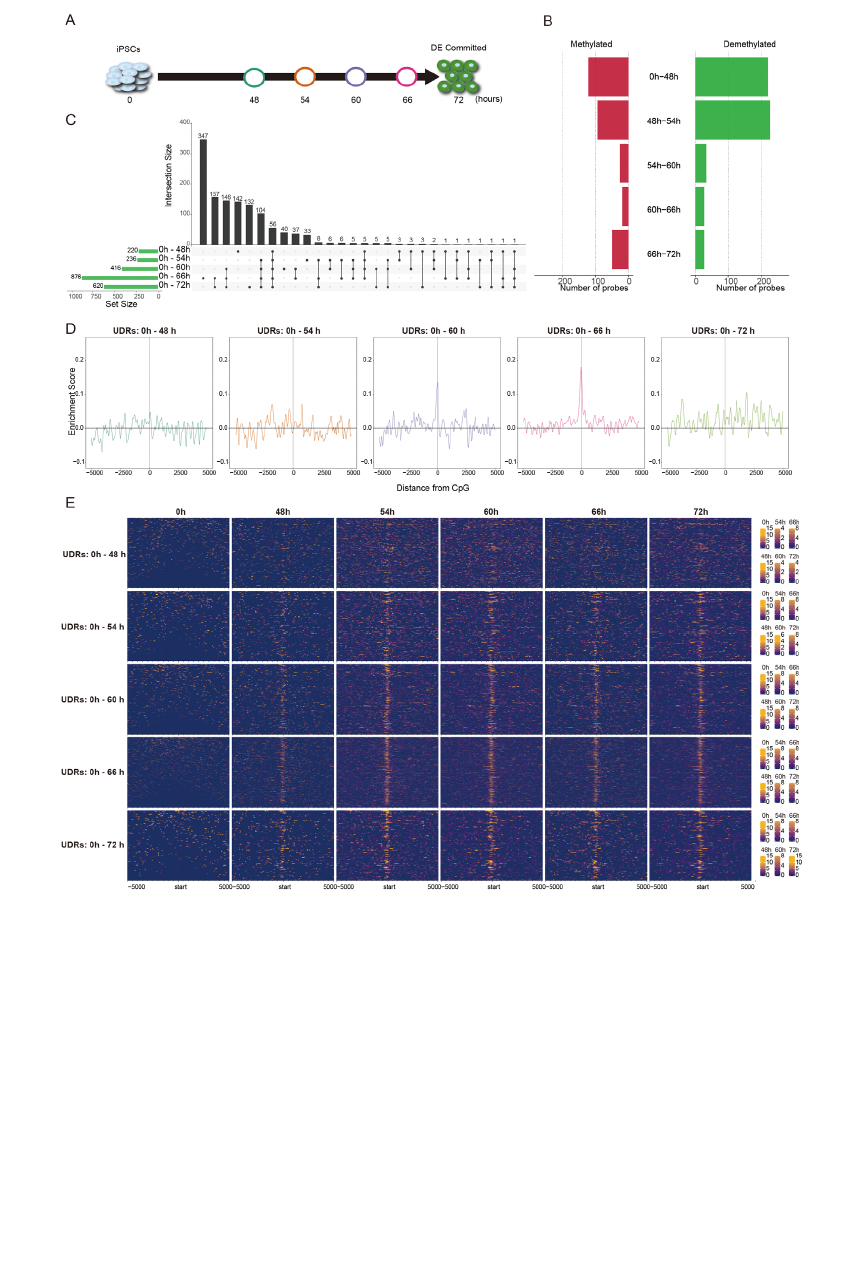
and maintained the hypo-methylated status, we only selected the demethylated CpGs
Fig. 4 GATA6-mediated DNA demethylation analysis during DE differentiation
(A) Schematic illustration of time-course sampling of DE differentiation. (B) The
number of differentially methylated probes. The left bar plot (red) is methylation and
the right bar plot (green) is demethylation. (C) UpSet plot showing the demethylated
probes at each comparison. The vertical bars indicate the number of intersecting
demethylated probes between comparisons, denoted by the connected black circles
below the histogram. The horizontal bars show the demethylated probe set size. (D)
Distribution of enrichment score for the GATA6 binding motif within ±5,000 bp of
demethylated CpG probes at each time point compared with undifferentiated iPS
cells (0 hours). X- and Y-axes show distance from probe CpG position and
enrichment score, respectively. Horizontal and vertical lines are enrichment score = 0
and demethylated CpG position, respectively. The colors of each plot represent
colors of timepoints shown in Fig. 4A. (E) Enrichment heatmap showing coverage of
GATA6 ChIPmentation reads at a range of ± 5 kbp from demethylated CpGs. Each
time point is horizontally aligned and each of the UDRs are vertically aligned. Dark
blue is low coverage and orange is high coverages.
preprint (which was not certified by peer review) is the author/funder. All rights reserved. No reuse allowed without permission.
The copyright holder for thisthis version posted December 17, 2020. ; https://doi.org/10.1101/2020.12.16.423165doi: bioRxiv preprint
that were newly detected as demethylated CpGs at each timepoint (referred to as
uninherited demethylated CpGs) to clarify the effects of each additional time period.
GATA6 motif overrepresentation analysis in the vicinity of these uninherited
demethylated CpG (uninherited demethylated regions: UDRs) revealed the GATA6
binding motif was overrepresented at 0 h -to- 60 h and 0 h -to- 66 h (Fig. 4D). To further
substantiate the overrepresentation of the GATA6 binding motif at the UDRs, we
performed ChIPmentation, which can provide evidence for actual physical interactions
between genomic regions and GATA6[59]. Consistent with the expression pattern of
GATA6, GATA6 binding was not enriched at UDRs during the period 0 h -to- 48 h,
indicating the irrelevance of GATA6 during this period (Fig. 4E). In contrast, unlike
binding motif overrepresentation, ChIPmentation showed interactions between GATA6
protein and most of the UDRs of all comparisons apart from the 0 h -to- 48 h, consistent
with the expression pattern of the GATA6 (Fig. 4E, Fig. S3A). Because ChIPmentation
is more direct evidence of TF binding, we assumed that GATA6 binds to the
demethylated regions after 48 h. Thus, our results suggest that GATA6 plays a major
role in regulating DNA demethylation during DE differentiation.
The interrelation between DNA demethylation and chromatin status during iPS-DE
differentiation
The majority of the demethylated regions were not promoters but other types of
regulatory regions such as enhancers and non-annotated regulatory regions (Fig. S4).
Therefore, we investigated the chromatin status of the demethylated regions. Active
regulatory regions transcribe several classes of transcripts, including mRNA, promoter-
upstream transcripts (PROMPTs), and enhancer RNAs (eRNAs), which are typically
transcribed within ± 250 bp from the center of the regulatory region[60]. Thus, the
transcription level serves as an indicator of chromatin activity. Therefore, to investigate
the chromatin activity of the demethylated regions, we measured the average TPM of
the UDRs (± 250 bp regions from the uninherited demethylated CpGs) by CAGE. The
average TPMs of the UDRs were prone to increase as differentiation proceeds in all
preprint (which was not certified by peer review) is the author/funder. All rights reserved. No reuse allowed without permission.
The copyright holder for thisthis version posted December 17, 2020. ; https://doi.org/10.1101/2020.12.16.423165doi: bioRxiv preprint

comparisons except for the 0 h -to- 48 h, indicating the activation of gene regulatory
regions (Fig. 5A).
Fig. 5 Chromatin status at demethylated regions.
(A) Change in average TPM of demethylated regions during DE differentiation. X- and
Y-axis represents timepoint and relative average TPM (vs. average TPM of 0 h),
respectively. The light-green shade is the standard deviation. (B) Heatmaps showing
Omni-ATAC-seq read coverage at a range of ± 5 kbp from demethylated CpGs. Each
time point is horizontally aligned and each of the UDRs are vertically aligned. Red is
higher coverage of Omni-ATAC-seq reads. (C) A representative screenshot showing
DNA demethylated regions, GATA6 ChIPmentation read coverage and OmniATAC-
read coverage.
preprint (which was not certified by peer review) is the author/funder. All rights reserved. No reuse allowed without permission.
The copyright holder for thisthis version posted December 17, 2020. ; https://doi.org/10.1101/2020.12.16.423165doi: bioRxiv preprint
To further analyze the interrelation between G ATA 6-mediated DNA
demethylation and chromatin status, we measured chromatin accessibility by Omni-
ATA C -seq[61]. Chromatin accessibility at the UDRs increased between 0 h and 48 h
and was maintained over the following timepoints at most of the demethylated regions
(Fig. 5B), in agreement with the transcription pattern and GATA6 binding (Fig. 4E, Fig.
S2A, Fig. 5B). Notably, the demethylated regions noted during DE differentiation were
only marginally accessible in iPS cells (0 h), although GATA6 is not expressed at that
time, suggesting that target regions of the GATA6-mediated DNA demethylation are
pre-defined by chromatin accessibility (Fig. 5B and 5C).
Taking advantage of our time-course multi-omics dataset, we compared the
kinetics of GATA6 expression, GATA6 binding to the genome (ChIPmentation),
methylation change (M-value), and chromatin status (ATA C -seq and Transcript) (Fig.
6A). Overall, the kinetics of GATA6 binding, chromatin accessibility, and transcription
observed the same trends, regardless of the UDRs. Although GATA6 expression was
constantly increasing after 48 h, GATA6 binding plateaued at 54 h, although it was
somewhat decreased at 66 h. GATA6 transcription levels increased during 0 h-to-48 h
and the expression level was maintained afterward with only slight fluctuations. Of
note, chromatin accessibility increased in the period 0 h -to-54 h and then decreased
after peaking, in correlation with the methylation change. Thus, the chromatin activation
was achieved before the DNA demethylation occurring during DE differentiation.
Discussion
In the present study, by applying transcriptome and TFBM overrepresentation
analyses for differentially methylated regions, we comprehensively identified putative
DNA methylation-regulating TFs active during hepatocyte differentiation. Of these TFs,
our results provide multiple strands of evidence that GATA6 is a primary epigenome
regulator for the iPSC-to-DE differentiation.
preprint (which was not certified by peer review) is the author/funder. All rights reserved. No reuse allowed without permission.
The copyright holder for thisthis version posted December 17, 2020. ; https://doi.org/10.1101/2020.12.16.423165doi: bioRxiv preprint

Our data suggest that many TFs participate in modulating DNA methylation
dynamics in a stage-specific manner. We previously reported that TF-mediated
regulation of DNA methylation predominantly manifests as demethylation[45].
Consistent with that report, we found many TFBMs at demethylated regions during
hepatocyte differentiation and the methylation change of these TFBMs tended to be
correlated with the expression of corresponding TFs. On the other hand, some TFBMs
such as POU5F1 (also known as OCT3/4) were overrepresented mainly at the
methylated regions during the iPSC-to-DE differentiation and the expression of the
corresponding TFs was inversely correlated with methylation change (Fig. 2B and C;
Fig. S2A). In comparison, GATA4 and GATA6 showed binding motif
overrepresentation at methylated regions of the hepatoblast differentiation stage when
GATA4 and GATA6 expression decreases (Fig. 2B and E). Thus, even the gain of
methylation may result from the loss of hypo-methylation maintenance by DNA
demethylating-TFs. Interestingly, GATA4 and GATA6 binding motifs are also
Fig. 6 Multi-omics kinetic analysis
(A) Line plots showing changes in each demethylated region's omics data. X-axis is
log
2
fold-change (FC) for read coverages of ATAC-seq and ChIPmentation for
GATA6 (left scale), and -△M-value (left scale); TPM for GATA6 expression (right
scale). Y-axis represents the time points of the differentiation. (B) A schematic
illustration showing a model of interrelation between GATA6-mediated DNA
demethylation and chromatin status.
preprint (which was not certified by peer review) is the author/funder. All rights reserved. No reuse allowed without permission.
The copyright holder for thisthis version posted December 17, 2020. ; https://doi.org/10.1101/2020.12.16.423165doi: bioRxiv preprint
overrepresented at demethylated regions of the DE differentiation stage when GATA4
and GAT6 expression increases, showing the dual roles of GATA4 and GATA6 (Fig. 2D
and E). To summarize, our data suggest that TF-mediated regulation of DNA
methylation acts in both the gain and loss of methylation.
Our data also suggest that HNF4A participates in DNA demethylation during
the hepatoblast differentiation stage (Fig. 2D). HNF4A is a crucial TF for hepatocyte
differentiation and functions, and is reported to be required during liver development for
establishment of 5-hydroxymethyl cytosine (5hmC) via interactions with TET3
[3,4,9,62]. An intermediate modification occurring during DNA demethylation, 5hmC
has a short half-life and is converted to 5fC and 5caC by TET proteins[36–41]. Then,
5fC and 5caC are rapidly converted to unmodified cytosines by base-excision repair.
Because the methylation array analyses used in the present study do not distinguish
between methylated cytosine and 5hmC, our results suggest that HNF4A-induced 5hmC
is immediately converted to unmodified cytosine.
Out of the putative DNA-demethylating TFs that we identified, our data
demonstrated that GATA6 plays a pivotal role in DNA demethylation during DE
differentiation. GATA6 mRNA expression started increasing at 48 h and was
dramatically upregulated during the DE differentiation stage (Fig. 3A and Fig. S2A). In
parallel with the expression, binding of GATA6 proteins to the vast majority of
demethylated regions was detected and this was maintained through differentiation (Fig.
4E, Fig. 6A), suggesting GATA6 promotes DNA demethylation at its binding sites. In
support of this molecular function of GATA6, ectopic expression of GATA6 in HEK
293T cells proved GATA6-mediated binding site-directed DNA demethylation (Fig.
3C). Thus, these results demonstrate that GATA6 is a crucial regulator of DNA
demethylation for early hepatic development, and acts in a binding site-directed manner.
preprint (which was not certified by peer review) is the author/funder. All rights reserved. No reuse allowed without permission.
The copyright holder for thisthis version posted December 17, 2020. ; https://doi.org/10.1101/2020.12.16.423165doi: bioRxiv preprint
In the analysis of the iPS cells -to- DE time-course, GATA6 binding motif
overrepresentation was not consistent with the results from ChIPmentation for GATA6.
Although ChIPmentation showed GATA6 protein binding at the UDRs of all
comparisons except 0h -to- 48 h, binding motif overrepresentation was only detected at
the UDRs of the 0 h -to- 60 h and 0 h-to- 66 h comparisons. For the GATA6 binding
motif overrepresentation analysis, we used the GATA6 PWM of the IMAGE motif
database, which includes the canonical GATA binding motif GATW (W = A or T).
However, GATA-binding proteins can bind various motifs that differ from the canonical
GATA -binding motif with comparable affinities [63]. Therefore, TFBM
overrepresentation analysis using a known motif database may underestimate the TF
binding. Another possibility is that ChIPmentation includes indirect binding of GATA6
via their co-factors. For instance, Friend Of GATA (FOG) proteins, which are co-factors
of GATA proteins, have been reported to play essential roles in mediating DNA loop
formation[64]. Thus, TFBM overrepresentation analysis with a known motif may not be
completely reflecting actual TF binding. Nevertheless, TFBM overrepresentation has a
value in predicting the TF binding because it is only based on in-silico analysis without
experimental fluctuation. It is also noteworthy that ChIPmentation and ChIP-seq depend
highly on the quality of the antibody, which often leads to experimental unreliability.
We also found a relationship between GATA6-mediated DNA demethylation
and chromatin activation. Notably, chromatin accessibilities of GATA6 binding regions
are already slightly accessible in iPS cells (Fig. 4E), although GATA6 is not expressed
at that stage. GATA6 appears to be a pioneer factor that directly binds to permissive
heterochromatin and primes the opening of chromatin [65–69]. Consistent with this, our
result indicates that the targets of GATA6-mediated DNA demethylation are
preliminarily marked by marginal chromatin accessibility. Thus, the chromatin
accessibility assay preliminarily indicates the target regions for TF-mediated regulation
of methylation.
preprint (which was not certified by peer review) is the author/funder. All rights reserved. No reuse allowed without permission.
The copyright holder for thisthis version posted December 17, 2020. ; https://doi.org/10.1101/2020.12.16.423165doi: bioRxiv preprint
Further multi-omic kinetics analysis suggested the temporal relationships that
exist between GATA6-mediated DNA demethylation and chromatin activity.
Interestingly, chromatin accessibility increased from 0 h -to- 54 h and then declined
afterward, although DNA methylation decreased. This is inconsistent with the notion
that DNA methylation is correlated with closed chromatin. The methyl-group of
methylated cytosine lies in the major groove of the DNA double helix, which hinders
the interaction of TFs with DNA. On the other hand, DNA demethylation increases the
affinity of the TFs for their binding site. Therefore, the decrease in chromatin
accessibility may be due to occupation of the opened chromatin by TFs. In fact, the
chromatin accessibility assay reflects not only the presence of open chromatin or
nucleosome density but also TF binding[70]. Thus, our results indicate that the
chromatin accessibility assay may not correctly reflect the chromatin activity.
Although the underlying molecular mechanisms have not been investigated in
this study, our analysis proposes a sequential reaction takes place, coordinated with the
expression pattern of TFs. DNA-demethylating TFs firstly bind to the permissive
heterochromatin sites where the TFBM are located. They then open and activate the
chromatin at the binding sites, and finally complete DNA demethylation (Fig. 6B). This
sequential reaction may be due to differences in reaction times between chromatin
remodeling and DNA demethylation, because the level of DNA methylation
progressively decreases from the beginning of the differentiation process. While
chromatin remodeling is an enzymatic reaction, DNA demethylation is achieved by
several mechanisms, including passive DNA demethylation, which depends on cell
division. Cell division is a complex process composed of multiple steps, and taking
more time than a single enzymatic reaction. Therefore, even if timing for the initiation
step is the same, the total reaction time to completion may differ between chromatin
remodeling and DNA demethylation.
preprint (which was not certified by peer review) is the author/funder. All rights reserved. No reuse allowed without permission.
The copyright holder for thisthis version posted December 17, 2020. ; https://doi.org/10.1101/2020.12.16.423165doi: bioRxiv preprint

In addition to GATA6 having an essential role in physiological endoderm cell
development, GATA6 haploinsufficiency causes several diseases such as neonatal
diabetes mellitus, cardiomyopathy, and pancreatic agenesis[71–73]. In the present study,
we found a novel function of GATA6, regulating binding site-directed DNA
demethylation. Hence, epigenetic abnormalities may also be associated with the
pathology of these diseases already linked to GATA6. Hence, epigenetic analyses of
these diseases deserves to be a priority and may provide novel insights into underlining
molecular mechanisms.
Conclusions
We identified multiple putative DNA methylation-regulating TFs acting at
distinct stages throughout hepatocyte differentiation, which are likely involved in DNA
demethylation and maintenance of hypo-methylation. Our data suggest that multiple
TFs cooperatively modulate the DNA methylation landscape during cellular
differentiation. A finer scale analysis of the time-course throughout DE differentiation
showed the crucial role of GATA6-mediated DNA methylation regulation, which is
gradually completed upon the rapid activation of chromatin.
Methods
Cell culture and in vitro differentiation
The 201B7 human iPS cell line was acquired from the RIKEN BioResource Center
(BRC) and was cultured in a Cellartis® DEF-CS™ Culture System (Takara Bio Inc.,
Shiga, Japan). For in vitro hepatocyte differentiation and DE differentiation, we used the
Cellartis® Hepatocyte Differentiation Kit (Takara Bio Inc.) and the Cellartis
®
DE
Differentiation Kit (Takara Bio Inc.), respectively, according to the manufacturers’
instructions.
Methylation array analysis
Genomic DNA was isolated using a NucleoSpin® Tissue Kit (Macherey-Nagel, Düren,
Germany). The methylation array used an Infinium Human methylationEPIC BeadChip
preprint (which was not certified by peer review) is the author/funder. All rights reserved. No reuse allowed without permission.
The copyright holder for thisthis version posted December 17, 2020. ; https://doi.org/10.1101/2020.12.16.423165doi: bioRxiv preprint

(Illumina, San Diego, CA), according to the manufacturer's instructions. Data was
processed as previously described.
Cap Analysis Gene Expression
Total RNA was extracted using NucleoSpin® RNA (Macherey-Nagel). CAGE libraries
were prepared as previously described. Briefly, 3 μg of total RNA from each sample
were used in reverse transcription reactions with random primers. The 5′ end cap
structure was biotinylated and captured with streptavidin-coated magnetic beads
(Thermo Fisher). After ligation of 5′ and 3′ adaptors, second-strand cDNA was
synthesized, followed by digestion with exonuclease I (New England BioLabs). The
purified CAGE libraries were sequenced using single-end reads of 50 bp on the Illumina
HiSeq 2500 (Illumina, USA). The extracted CAGE tags were then mapped to the human
hg19 genome by STAR. The tags per million (TPM) were calculated for each
FANTOM5 TSS peak and regions extended ± 250 bp from each differentially
methylated CpG. Gene expression levels of each gene were computed as the sum of
multiple TSS peaks associated with a single gene.
Omni-ATAC-seq
Omni-ATA C -seq libraries were prepared as previously described[61]. Briefly, 5 × 10
4
cells were stored at -80 °C in STEM CELLBANKER® (Takara Bio Inc.) until use. The
cells were washed with PBS and nuclei were extracted. The extracted nuclei were
resuspended in 50 μl of transposition mix (100 nM TED1 (Illumina), 0.01% digitonin,
and 0.1% Tween-20, in TD buffer (Illumina)) and incubated at 37 °C for 30 min with
1,000 RPM mixing. DNA was extracted from the reaction mixture with Zymo DNA
Clean and Concentrator (Zymo Research, CA, USA). DNA library was prepared using
NEBNext® Ultra™ DNA Library Prep Kit for Illumina® (New England BioLabs) with
5cycles of pre-amplification and 3 to 7 cycles of PCR amplification. Amplified DNA
library was purified with Zymo DNA Clean and Concentrator (Zymo Research),
followed by two size-selection steps with SPRIselect (1:0.6 and 1:0.2 sample vol. to
beads vol.; Beckman Coulter, CA, USA). The libraries' size distribution was determined
by Bioanalyzer (Agilent Technologies, CA, USA), and the concentration of the libraries
preprint (which was not certified by peer review) is the author/funder. All rights reserved. No reuse allowed without permission.
The copyright holder for thisthis version posted December 17, 2020. ; https://doi.org/10.1101/2020.12.16.423165doi: bioRxiv preprint

was quantified by GenNext NGS Library Quantification Kit (Toyobo Co., Ltd., Osaka,
Japan). The Omni-ATAC -seq libraries were sequenced using 150 bp paired-end reads on
the HiSeq X (Illumina). The obtained sequence reads were mapped to the human hg19
genome by bowtie2.
Lentivirus preparation and transduction
GATA6 and ORF were sub-cloned into the CSII-EF-RfA-IRES2-puro vectors using the
Gateway LR reaction (Thermo Fisher Scientific Inc.). GATA6 lentivirus vectors were
produced by using the LV-MAX Lentiviral Production System (Thermo Fisher
Scientific Inc.) according to the manufacturer's instructions. The resulting lentivirus
vectors were transduced to 293T cells, as described previously.
Quantitative reverse transcription PCR (qRT-PCR)
qRT-PCR was performed as previously described[45] with primers shown in table S1.
ChIPmentation
ChIPmentation was performed using a ChIPmentation for Transcription Factor kit
(Diagenode) according to the manufacturer's instructions. Briefly, the cells were
collected and fixed with 1% formaldehyde for 8 minutes at RT. The fixed cells were
lysed, and chromatin was sheared by sonication using a Picoruptor® (Diagenode) for 10
cycles. The sheared chromatin derived from one million cells was subjected to magnetic
immunoprecipitation and tagmentation using an SX-8G IP-STAR® Compact
Automated System (Diagenode) with the anti-GATA6 antibody (D61E4, Cell Signaling
Technology, Inc.). The immunoprecipitated samples were stripped from the magnetic
beads and subjected to end repair and reverse cross-linking. The Illumina sequence
compatible sequencing libraries were amplified by nine cycles of PCR. The sequencing
libraries were cleaned up using AMPure XP beads (1:1.8 sample vol. to beads vol.;
Beckman Coulter). The size distribution of the libraries were determined by Bioanalyzer
(Agilent Technologies). The concentration of the libraries was quantified by GenNext
NGS Library Quantification Kit (Toyobo Co., Ltd). The ChIPmentation libraries were
sequenced using 150 bp paired-end reads on the HiSeq X (Illumina). The sequence
reads that were obtained were mapped to the human hg19 genome by bowtie2.
preprint (which was not certified by peer review) is the author/funder. All rights reserved. No reuse allowed without permission.
The copyright holder for thisthis version posted December 17, 2020. ; https://doi.org/10.1101/2020.12.16.423165doi: bioRxiv preprint

Computational Methods
Functional analysis of differentially methylated regions
GO analysis of differentially methylated regions was performed using GREAT[53].
Enriched GO lists were summarized based on Semantic Similarity by the GOsemSim R
package.
Screening of DNA methylation-regulating transcription factors
TFBM overrepresentation analysis was performed as previously described with an
additional modification. Briefly, sequences located ± 5 kbp from the methylated or
demethylated probe positions and the same number of randomly selected probes were
extracted from version hg19 of the human genome sequence. TFBM identification was
performed using the matchPWM command of the Biostrings package of Bioconductor
with the PWM database of Integrated analysis of Motif Activity and Gene Expression
changes of transcription factors (IMAGE). Out of the overrepresented motifs, the
corresponding genes whose CAGE tag per million ≥ 50 at the time points where the TF
binding motif was overrepresented were selected as DNA methylation-regulating
transcription factors.
Correlation matrix
The correlation coefficient of all combinations of two clusters was computed using the
M-values. The correlation coefficients were visualized as the correlation matrix
heatmap. The clusters were ordered based on hierarchical clustering, which was
calculated using the hclust and dist functions of the R stats package with the default
settings.
Functional analysis of differentially methylated regions
Differentially methylated CpGs that were identified as △M > 2 and ± 100 bp extended
regions from the differentially methylated CpGs were used as differentially methylated
regions. The differentially methylated regions were subjected to GREAT analysis using
the submitGreatJob function implemented in the rGREAT R package with background
data, which is with the regions extended ± 100 bp for all methylation array probes.
Log
10
FDR and ratio between the numbers of hit regions and all differentially
preprint (which was not certified by peer review) is the author/funder. All rights reserved. No reuse allowed without permission.
The copyright holder for thisthis version posted December 17, 2020. ; https://doi.org/10.1101/2020.12.16.423165doi: bioRxiv preprint

methylated regions of the Top10 overrepresented GOs (Biological Process) were
visualized.
Annotation of differentially methylated regions
Gene promoters were defined as 1 kbp upstream and 200 bp downstream regions of
genes in gencode human release version 19. The enhancers used in this study were
FANTOM 5 human phase 1 and 2 permissive enhancers. Non-promoter and non-
enhancer regions were defined as unannotated regions. The complete overlap between
uninherited demethylated CpGs and each regulatory region was counted.
Coverage analysis of GATA6 ChIPmentation and Omni-ATAC-seq
Bigwig Coverage files of CAGE and Omni-ATA C -seq were computed using
bam2wig.py. The read coverage was visualized in the range between ± 5 kbp from the
demethylated CpGs using the EnrichedHeatmap function implemented in the
EnrichedHeatmap R package.
List of abbreviations
TFs, transcription factors; TFBM, transcription factor binding motif; PBS, Phosphate-
buffered saline; DE, definitive endoderm; UDRs, uninherited demethylated regions
Declarations
Ethics approval and consent to participate
Not applicable.
Consent for publication
Not applicable.
Competing interests
The authors declare that they have no competing interests.
Funding
This work was supported by Grant-in-Aid for Scientific Research (C) (19K08852) to TS
from Japan Society for the Promoting Science. This work was also supported by a
preprint (which was not certified by peer review) is the author/funder. All rights reserved. No reuse allowed without permission.
The copyright holder for thisthis version posted December 17, 2020. ; https://doi.org/10.1101/2020.12.16.423165doi: bioRxiv preprint

research grant from the Ministry of Education, Culture, Sport, Science and Technology
of Japan for the RIKEN Center for Integrative Medical Sciences.
Authors' contributions
TS participated in the study's design, devised the methodology, performed the statistical
analyses, carried out the molecular biology studies, acquired the funding, and drafted
the manuscript. SM, EF, MK, YM, YT, JL, HN, SA, and YS carried out the molecular
biology experiments. HS helped to draft the manuscript, acquired the funding, and
supervised the study. All authors read and approved the final manuscript.
Acknowledgments
We thank Chung-Chau Hon for useful advice in data analysis. We thank Jing-ru Li for
experiment supports. We thank Horoyuki Miyoshi and RIKEN BRC for providing
lentivirus plasmids. We are grateful to RIKEN IMS, Laboratory for Comprehensive
Genomic Analysis, for the Hiseq 2500 sequencing.
preprint (which was not certified by peer review) is the author/funder. All rights reserved. No reuse allowed without permission.
The copyright holder for thisthis version posted December 17, 2020. ; https://doi.org/10.1101/2020.12.16.423165doi: bioRxiv preprint

References
1. Eferl R, Sibilia M, Hilberg F, Fuchsbichler A, Kufferath I, Guertl B, et al. Functions
of c-Jun in liver and heart development. J Cell Biol. The Rockefeller University Press;
1999;145:1049–61. http://www.jcb.org
2. Hilberg F, Aguzzi A, Howells N, Wagner EF. C-Jun is essential for normal mouse
development and hepatogenesis. Nature. Nature Publishing Group; 1993;365:179–81.
https://www.nature.com/articles/365179a0
3. Tirona RG, Lee W, Leake BF, Lan L Bin, Brimer Cline C, Lamba V, et al. The
orphan nuclear receptor HNF4α determines PXR- and CAR-mediated xenobiotic
induction of CYP3A4. Nat Med. Nature Publishing Group; 2003;9:220–4.
http://www.nature.com/naturemedicine
4. Jiang F, Yeo C-W, Lee S-S, Oh M-K, Ghim J-L, Shon J-H, et al. Effect of HNF4α
genetic polymorphism G60D on the pharmacokinetics of CYP2D6 substrate tolterodine
in healthy Korean individuals. Pharmacogenet Genomics. 2013;23:175–9.
http://journals.lww.com/01213011-201303000-00009
5. Pontoglio M, Barra J, Hadchouel M, Doyen A, Kress C, Bach JP, et al. Hepatocyte
nuclear factor 1 inactivation results in hepatic dysfunction, phenylketonuria, and renal
Fanconi syndrome. Cell. Cell Press; 1996;84:575–85.
http://www.cell.com/article/S0092867400810338/fulltext
6. Matsuda K, Kobune Y, Noda C, Ichihara A. Expression of GATA-binding
transcription factors in rat hepatocytes. FEBS Lett. FEBS Lett; 1994;353:269–72.
https://pubmed.ncbi.nlm.nih.gov/7957872/
7. Watt AJ, Zhao R, Li J, Duncan SA. Development of the mammalian liver and ventral
pancreas is dependent on GATA4. BMC Dev Biol. BioMed Central; 2007;7:37.
http://bmcdevbiol.biomedcentral.com/articles/10.1186/1471-213X-7-37
8. Zhao R, Watt AJ, Li J, Luebke-Wheeler J, Morrisey EE, Duncan SA. GATA6 Is
Essential for Embryonic Development of the Liver but Dispensable for Early Heart
Formation. Mol Cell Biol. American Society for Microbiology; 2005;25:2622–31.
http://mcb.asm.org/
preprint (which was not certified by peer review) is the author/funder. All rights reserved. No reuse allowed without permission.
The copyright holder for thisthis version posted December 17, 2020. ; https://doi.org/10.1101/2020.12.16.423165doi: bioRxiv preprint
9. Li J, Ning G, Duncan SA. Mammalian hepatocyte differentiation requires the
transcription factor HNF-4α. Genes Dev. Cold Spring Harbor Laboratory Press;
2000;14:464–74. www.genesdev.org
10. Koutsourakis M, Langeveld A, Patient R, Beddington R, Grosveld F. The
transcription factor GATA6 is essential for early extra-embryonic development.
Development. 1999;126:723–32. http://www.ncbi.nlm.nih.gov/pubmed/9895320
11. Morrisey EE, Tang Z, Sigrist K, Lu MM, Jiang F, Ip HS, et al. GATA6 regulates
HNF4 and is required for differentiation of visceral endoderm in the mouse embryo.
Genes Dev. Cold Spring Harbor Laboratory Press; 1998;12:3579–90.
www.genesdev.org
12. Matsunaga E, Gonzalez FJ. Specific Cytosine Demethylations within the First
Exons of the Rat CYP2D3 and CYP2D5 Genes Are Associated with Activation of
Hepatic Gene Expression during Development. DNA Cell Biol. DNA Cell Biol;
1990;9:443–52. https://pubmed.ncbi.nlm.nih.gov/2206401/
13. Curradi M, Izzo A, Badaracco G, Landsberger N. Molecular Mechanisms of Gene
Silencing Mediated by DNA Methylation. Mol Cell Biol. American Society for
Microbiology; 2002;22:3157–73. /pmc/articles/PMC133775/?report=abstract
14. Guo H, Zhu P, Yan L, Li R, Hu B, Lian Y, et al. The DNA methylation landscape of
human early embryos. Nature. Nature Publishing Group; 2014;511:606–10.
https://www.nature.com/articles/nature13544
15. Smith ZD, Meissner A. DNA methylation: Roles in mammalian development
[Internet]. Nat. Rev. Genet. Nature Publishing Group; 2013. p. 204–20.
www.nature.com/reviews/genetics
16. Bird A. DNA methylation patterns and epigenetic memory [Internet]. Genes Dev.
Cold Spring Harbor Laboratory Press; 2002. p. 6–21.
http://www.genesdev.org/cgi/doi/10.1101/
17. Hackett JA, Azim Surani M. DNA methylation dynamics during the mammalian life
cycle [Internet]. Philos. Trans. R. Soc. B Biol. Sci. Royal Society; 2013.
/pmc/articles/PMC3539357/?report=abstract
preprint (which was not certified by peer review) is the author/funder. All rights reserved. No reuse allowed without permission.
The copyright holder for thisthis version posted December 17, 2020. ; https://doi.org/10.1101/2020.12.16.423165doi: bioRxiv preprint
18. Tronche F, Rollier A, Bach I, Weiss MC, Yaniv M. The rat albumin promoter:
cooperation with upstream elements is required when binding of APF/HNF1 to the
proximal element is partially impaired by mutation or bacterial methylation. Mol Cell
Biol. American Society for Microbiology; 1989;9:4759–66. http://mcb.asm.org/
19. Piechocki MP, Burk RD, Ruch RJ. Regulation of connexin32 and connexin43 gene
expression by DNA methylation in rat liver cells. Carcinogenesis. Oxford University
Press; 1999;20:401–6. https://academic.oup.com/carcin/article/20/3/401/2526607
20. Vieira I, Sonnier M, Cresteil T. Developmental expression of CYP2E1 in the human
liver Hypermethylation control of gene expression during the neonatal period. Eur J
Biochem. Blackwell Publishing Ltd.; 1996;238:476–83.
https://febs.onlinelibrary.wiley.com/doi/full/10.1111/j.1432-1033.1996.0476z.x
21. Hammons GJ, Yan-Sanders Y, Jin B, Blann E, Kadlubar FF, Lyn-Cook BD.
Specific site methylation in the 5′-flanking region of CYP1A2: Interindividual
differences in human livers. Life Sci. Pergamon; 2001;69:839–45.
22. Yokomori N, Kobayashi R, Moore R, Sueyoshi T, Negishi M. A DNA methylation
site in the male-specific P450 (Cyp 2d-9) promoter and binding of the heteromeric
transcription factor GABP. Mol Cell Biol. American Society for Microbiology;
1995;15:5355–62. http://mcb.asm.org/
23. Yokomori N, Nishio K, Aida K, Negishi M. Transcriptional regulation by HNF-4 of
the steroid 15α-hydroxylase p450 (Cyp2a-4) gene in mouse liver. J Steroid Biochem
Mol Biol. Pergamon; 1997;62:307–14.
24. Kwon MS, Kim SJ, Lee SY, Jeong JH, Lee ES, Kang HS. Epigenetic silencing of
the sulfotransferase 1A1 gene by hypermethylation in breast tissue. Oncol Rep.
Spandidos Publications; 2006;15:27–32. http://www.spandidos-
publications.com/10.3892/or.15.1.27/abstract
25. Dannenberg LO, Edenberg HJ. Epigenetics of gene expression in human hepatoma
cells: Expression profiling the response to inhibition of DNA methylation and histone
deacetylation. BMC Genomics. BioMed Central; 2006;7:181.
https://bmcgenomics.biomedcentral.com/articles/10.1186/1471-2164-7-181
preprint (which was not certified by peer review) is the author/funder. All rights reserved. No reuse allowed without permission.
The copyright holder for thisthis version posted December 17, 2020. ; https://doi.org/10.1101/2020.12.16.423165doi: bioRxiv preprint
26. Sgodda M, Aurich H, Kleist S, Aurich I, König S, Dollinger MM, et al. Hepatocyte
differentiation of mesenchymal stem cells from rat peritoneal adipose tissue in vitro and
in vivo. Exp Cell Res. Academic Press Inc.; 2007;313:2875–86.
27. Yoshida Y, Shimomura T, Sakabe T, Ishii K, Gonda K, Matsuoka S, et al. A role of
Wnt/β-catenin signals in hepatic fate specification of human umbilical cord blood-
derived mesenchymal stem cells. Am J Physiol Liver Physiol. American Physiological
Society; 2007;293:G1089–98.
https://www.physiology.org/doi/10.1152/ajpgi.00187.2007
28. Stock P, Staege MS, Müller LP, Sgodda M, Völker A, Volkmer I, et al. Hepatocytes
Derived From Adult Stem Cells. Transplant Proc. Elsevier; 2008;40:620–3.
29. Hashimoto K, Kouno T, Ikawa T, Hayatsu N, Miyajima Y, Yabukami H, et al.
Single-cell transcriptomics reveals expansion of cytotoxic CD4 T cells in
supercentenarians. Proc Natl Acad Sci U S A. 2019;116.
30. Xie S, Wang Z, Okano M, Nogami M, Li Y, He WW, et al. Cloning, expression and
chromosome locations of the human DNMT3 gene family. Gene. Elsevier;
1999;236:87–95.
31. Jeltsch A. Molecular enzymology of mammalian DNA methyltransferases. Curr Top
Microbiol Immunol. Springer, Berlin, Heidelberg; 2006. p. 203–25.
https://link.springer.com/chapter/10.1007/3-540-31390-7_7
32. Kim JK, Samaranayake M, Pradhan S. Epigenetic mechanisms in mammals
[Internet]. Cell. Mol. Life Sci. Springer; 2009. p. 596–612.
/pmc/articles/PMC2780668/?report=abstract
33. Yen R whay C, Vertino PM, Nelkin BD, Yu JJ, El-deiry W, Cumaraswamy A, et al.
Isolation and characterization of the cDNA encoding human DNA methyltransferase.
Nucleic Acids Res. Oxford University Press; 1992;20:2287–91.
/pmc/articles/PMC312343/?report=abstract
34. Goll MG, Bestor TH. Eukaryotic cytosine methyltransferases [Internet]. Annu. Rev.
Biochem. Annu Rev Biochem; 2005. p. 481–514.
https://pubmed.ncbi.nlm.nih.gov/15952895/
preprint (which was not certified by peer review) is the author/funder. All rights reserved. No reuse allowed without permission.
The copyright holder for thisthis version posted December 17, 2020. ; https://doi.org/10.1101/2020.12.16.423165doi: bioRxiv preprint
35. Ohno R, Nakayama M, Naruse C, Okashita N, Takano O, Tachibana M, et al. A
replication-dependent passive mechanism modulates DNA demethylation in mouse
primordial germ cells. Dev. Oxford University Press for The Company of Biologists
Limited; 2013;140:2892–903. https://dev.biologists.org/content/140/14/2892
36. Tahiliani M, Koh KP, Shen Y, Pastor WA, Bandukwala H, Brudno Y, et al.
Conversion of 5-methylcytosine to 5-hydroxymethylcytosine in mammalian DNA by
MLL partner TET1. Science (80- ). American Association for the Advancement of
Science; 2009;324:930–5.
www.sciencemag.org/cgi/content/full/1169786/DC1VOL324SCIENCEwww.sciencema
g.org
37. Ito S, Dalessio AC, Taranova O V., Hong K, Sowers LC, Zhang Y. Role of tet
proteins in 5mC to 5hmC conversion, ES-cell self-renewal and inner cell mass
specification. Nature. Nature Publishing Group; 2010;466:1129–33.
https://www.nature.com/articles/nature09303
38. Ito S, Shen L, Dai Q, Wu SC, Collins LB, Swenberg JA, et al. Tet proteins can
convert 5-methylcytosine to 5-formylcytosine and 5-carboxylcytosine. Science (80- ).
American Association for the Advancement of Science; 2011;333:1300–3.
www.sciencemag.org/cgi/content/full/333/6047/1296/DC1
39. Kohli RM, Zhang Y. TET enzymes, TDG and the dynamics of DNA demethylation
[Internet]. Nature. Nature Publishing Group; 2013. p. 472–9.
https://www.nature.com/articles/nature12750
40. He YF, Li BZ, Li Z, Liu P, Wang Y, Tang Q, et al. Tet-mediated formation of 5-
carboxylcytosine and its excision by TDG in mammalian DNA. Science (80- ).
American Association for the Advancement of Science; 2011;333:1303–7.
www.sciencemag.org/cgi/content/full/science.1210597/DC1
41. Maiti A, Drohat AC. Thymine DNA glycosylase can rapidly excise 5-
formylcytosine and 5-carboxylcytosine: Potential implications for active demethylation
of CpG sites. J Biol Chem. American Society for Biochemistry and Molecular Biology;
2011;286:35334–8. http://www.jbc.org/
preprint (which was not certified by peer review) is the author/funder. All rights reserved. No reuse allowed without permission.
The copyright holder for thisthis version posted December 17, 2020. ; https://doi.org/10.1101/2020.12.16.423165doi: bioRxiv preprint
42. Inoue A, Shen L, Dai Q, He C, Zhang Y. Generation and replication-dependent
dilution of 5fC and 5caC during mouse preimplantation development. Cell Res. Nature
Publishing Group; 2011;21:1670–6. www.cell-research.com
43. Song CX, He C. Potential functional roles of DNA demethylation intermediates
[Internet]. Trends Biochem. Sci. NIH Public Access; 2013. p. 480–4.
/pmc/articles/PMC4013277/?report=abstract
44. Suzuki T, Shimizu Y, Furuhata E, Maeda S, Kishima M, Nishimura H, et al.
RUNX1 regulates site specificity of DNA demethylation by recruitment of DNA
demethylation machineries in hematopoietic cells. Blood Adv. 2017;1.
45. Suzuki T, Maeda S, Furuhata E, Shimizu Y, Nishimura H, Kishima M, et al. A
screening system to identify transcription factors that induce binding site-directed DNA
demethylation. Epigenetics and Chromatin. 2017;10:60.
https://epigeneticsandchromatin.biomedcentral.com/articles/10.1186/s13072-017-0169-
6
46. de la Rica L, Rodríguez-Ubreva J, García M, Islam ABMMK, Urquiza JM,
Hernando H, et al. PU.1 target genes undergo Tet2-coupled demethylation and
DNMT3b-mediated methylation in monocyte-to-osteoclast differentiation. Genome
Biol. BioMed Central; 2013;14:R99.
http://genomebiology.biomedcentral.com/articles/10.1186/gb-2013-14-9-r99
47. Costa Y, Ding J, Theunissen TW, Faiola F, Hore TA, Shliaha P V., et al. NANOG-
dependent function of TET1 and TET2 in establishment of pluripotency. Nature. Nature
Publishing Group; 2013;495:370–4. https://www.nature.com/articles/nature11925
48. Guilhamon P, Eskandarpour M, Halai D, Wilson GA, Feber A, Teschendorff AE, et
al. Meta-analysis of IDH-mutant cancers identifies EBF1 as an interaction partner for
TET2. Nat Commun. Nature Publishing Group; 2013;4:1–9.
www.nature.com/naturecommunications
49. Fujiki K, Shinoda A, Kano F, Sato R, Shirahige K, Murata M. PPARγ-induced
PARylation promotes local DNA demethylation by production of 5-
preprint (which was not certified by peer review) is the author/funder. All rights reserved. No reuse allowed without permission.
The copyright holder for thisthis version posted December 17, 2020. ; https://doi.org/10.1101/2020.12.16.423165doi: bioRxiv preprint
hydroxymethylcytosine. Nat Commun. Nature Publishing Group; 2013;4:1–8.
www.nature.com/naturecommunications
50. Sardina JL, Collombet S, Tian T V., Gómez A, Di Stefano B, Berenguer C, et al.
Transcription Factors Drive Tet2-Mediated Enhancer Demethylation to Reprogram Cell
Fate. Cell Stem Cell. Cell Press; 2018;23:727-741.e9.
51. Murata M, Nishiyori-Sueki H, Kojima-Ishiyama M, Carninci P, Hayashizaki Y, Itoh
M. Detecting expressed genes using CAGE. Methods Mol Biol. Humana Press Inc.;
2014;1164:67–85. https://link.springer.com/protocol/10.1007/978-1-4939-0805-9_7
52. Hay DC, Zhao D, Fletcher J, Hewitt ZA, McLean D, Urruticoechea-Uriguen A, et
al. Efficient Differentiation of Hepatocytes from Human Embryonic Stem Cells
Exhibiting Markers Recapitulating Liver Development In Vivo. Stem Cells. Wiley;
2008;26:894–902. http://doi.wiley.com/10.1634/stemcells.2007-0718
53. McLean CY, Bristor D, Hiller M, Clarke SL, Schaar BT, Lowe CB, et al. GREAT
improves functional interpretation of cis-regulatory regions. Nat Biotechnol.
2010;28:495–501.
54. Yu G, Li F, Qin Y, Bo X, Wu Y, Wang S. GOSemSim: An R package for
measuring semantic similarity among GO terms and gene products. Bioinformatics.
Oxford Academic; 2010;26:976–8.
http://bioconductor.org/packages/2.6/bioc/html/GOSemSim.html
55. Madsen JGS, Rauch A, Van Hauwaert EL, Schmidt SF, Winnefeld M, Mandrup S.
Integrated analysis of motif activity and gene expression changes of transcription
factors. Genome Res. Cold Spring Harbor Laboratory Press; 2018;28:243–55.
http://www.genome.org/cgi/doi/10.1101/gr.227231.117.
56. Fuest M, Willim K, MacNelly S, Fellner N, Resch GP, Blum HE, et al. The
transcription factor c-Jun protects against sustained hepatic endoplasmic reticulum
stress thereby promoting hepatocyte survival. Hepatology. John Wiley & Sons, Ltd;
2012;55:408–18. http://doi.wiley.com/10.1002/hep.24699
57. Hasselblatt P, Rath M, Komnenovic V, Zatloukal K, Wagner EF. Hepatocyte
survival in acute hepatitis is due to c-Jun/AP-1-dependent expression of inducible nitric
preprint (which was not certified by peer review) is the author/funder. All rights reserved. No reuse allowed without permission.
The copyright holder for thisthis version posted December 17, 2020. ; https://doi.org/10.1101/2020.12.16.423165doi: bioRxiv preprint
oxide synthase. Proc Natl Acad Sci U S A. National Academy of Sciences;
2007;104:17105–10. www.pnas.org/cgi/content/full/
58. Behrens A, Sibilia M, David JP, Möhle-Steinlein U, Tronche F, Schütz G, et al.
Impaired postnatal hepatocyte proliferation and liver regeneration in mice lacking c-jun
in the liver. EMBO J. John Wiley & Sons, Ltd; 2002;21:1782–90.
https://www.embopress.org/doi/full/10.1093/emboj/21.7.1782
59. Schmidl C, Rendeiro AF, Sheffield NC, Bock C. ChIPmentation: Fast, robust, low-
input ChIP-seq for histones and transcription factors. Nat Methods. Nature Publishing
Group; 2015;12:963–5. http://chipmentation.computational-epigenetics.org/.
60. Andersson R, Sandelin A. Determinants of enhancer and promoter activities of
regulatory elements [Internet]. Nat. Rev. Genet. Nature Research; 2020. p. 71–87.
www.nature.com/nrg
61. Corces MR, Trevino AE, Hamilton EG, Greenside PG, Sinnott-Armstrong NA,
Vesuna S, et al. An improved ATAC-seq protocol reduces background and enables
interrogation of frozen tissues. Nat Methods. Nature Publishing Group; 2017;14:959–
62. https://www.nature.com/articles/nmeth.4396
62. Thakur A, Wong JCH, Wang EY, Lotto J, Kim D, Cheng J, et al. Hepatocyte
Nuclear Factor 4‐Alpha Is Essential for the Active Epigenetic State at Enhancers in
Mouse Liver. Hepatology. John Wiley and Sons Inc.; 2019;70:1360–76.
https://onlinelibrary.wiley.com/doi/abs/10.1002/hep.30631
63. Merika M, Orkin SH. DNA-binding specificity of GATA family transcription
factors. Mol Cell Biol. American Society for Microbiology; 1993;13:3999–4010.
/pmc/articles/PMC359949/?report=abstract
64. Vakoc CR, Letting DL, Gheldof N, Sawado T, Bender MA, Groudine M, et al.
Proximity among distant regulatory elements at the β-globin locus requires GATA-1
and FOG-1. Mol Cell. Elsevier; 2005;17:453–62.
http://www.molecule.org/cgi/content/full/17/3/453/
preprint (which was not certified by peer review) is the author/funder. All rights reserved. No reuse allowed without permission.
The copyright holder for thisthis version posted December 17, 2020. ; https://doi.org/10.1101/2020.12.16.423165doi: bioRxiv preprint
65. Fisher JB, Pulakanti K, Rao S, Duncan SA. GATA6 is essential for endoderm
formation from human pluripotent stem cells. Biol Open. Company of Biologists Ltd;
2017;6:1084–95. http://bio.biologists.org/
66. Cirillo LA, Lin FR, Cuesta I, Friedman D, Jarnik M, Zaret KS. Opening of
compacted chromatin by early developmental transcription factors HNF3 (FoxA) and
GATA-4. Mol Cell. Elsevier; 2002;9:279–89.
http://www.cell.com/article/S1097276502004598/fulltext
67. Zaret K. Developmental competence of the gut endoderm: Genetic potentiation by
GATA and HNF3/fork head proteins. Dev. Biol. Academic Press Inc.; 1999. p. 1–10.
68. Zaret KS, Watts J, Xu J, Wandzioch E, Smale ST, Sekiya T. Pioneer factors, genetic
competence, and inductive signaling: Programming liver and pancreas progenitors from
the endoderm. Cold Spring Harb Symp Quant Biol. Cold Spring Harbor Laboratory
Press; 2008. p. 119–26. http://symposium.cshlp.org/content/73/119
69. Mayran A, Drouin J. Pioneer transcription factors shape the epigenetic landscape
[Internet]. J. Biol. Chem. American Society for Biochemistry and Molecular Biology
Inc.; 2018. p. 13795–804. http://www.jbc.org/
70. Galas DJ, Schmitz A. DNAase footprinting a simple method for the detection of
protein-DNA binding specificity. Nucleic Acids Res. Oxford Academic; 1978;5:3157–
70. https://academic.oup.com/nar/article/5/9/3157/2380868
71. Kodo K, Nishizawa T, Furutani M, Arai S, Yamamura E, Joo K, et al. GATA6
mutations cause human cardiac outflow tract defects by disrupting semaphorin-plexin
signaling. Proc Natl Acad Sci U S A. National Academy of Sciences; 2009;106:13933–
8. http://genome.lbl.gov/vista/
72. De Franco E, Shaw-Smith C, Flanagan SE, Shepherd MH, Hattersley AT, Ellard S.
GATA6 mutations cause a broad phenotypic spectrum of diabetes from pancreatic
agenesis to adult-onset diabetes without exocrine insufficiency. Diabetes. American
Diabetes Association; 2013;62:993–7. /pmc/articles/PMC3581234/?report=abstract
preprint (which was not certified by peer review) is the author/funder. All rights reserved. No reuse allowed without permission.
The copyright holder for thisthis version posted December 17, 2020. ; https://doi.org/10.1101/2020.12.16.423165doi: bioRxiv preprint
73. Allen HL, Flanagan SE, Shaw-Smith C, De Franco E, Akerman I, Caswell R, et al.
GATA6 haploinsufficiency causes pancreatic agenesis in humans. Nat Genet. Nature
Publishing Group; 2012;44:20–2. http://www.nature.com/naturegenetics/.
preprint (which was not certified by peer review) is the author/funder. All rights reserved. No reuse allowed without permission.
The copyright holder for thisthis version posted December 17, 2020. ; https://doi.org/10.1101/2020.12.16.423165doi: bioRxiv preprint
