
FISHERIES FINAL REPORT SERIES | NO. 149
Survey of Recreational Fishing in New South
Wales and the ACT, 2013/14
L. D. West, K. E. Stark, J. J. Murphy, J. M. Lyle and F. A. Ochwada-Doyle

Published by the NSW Department of Primary Industries
Survey of Recreational Fishing in New South Wales and the ACT, 2013/14
NSW DPI – Fisheries Final Report Series No. 149
First published December 2015
ISSN 2204-8669*
More information
Mr. Jeff Murphy, Fisheries NSW, Department of Primary Industries, PO Box 5106, Wollongong NSW 2520
www.dpi.nsw.gov.au
Acknowledgments
Funding for this project was provided by the New South Wales (NSW) Recreational Fishing Saltwater Trust and NSW
Department of Primary Industries (NSW DPI).
Cover image: Glenn Biclar, Graham Grocott, Brian James, Duy Khang Ngo, Hanz Kilian, James Milicevic, Warren
Robinson, Michael Sephton and Glen Towler.
© State of New South Wales through the Department of Trade and Investment, Regional Infrastructure and Services, 2016. You may copy, distribute
and otherwise freely deal with this publication for any purpose, provided that you attribute the NSW Department of Primary Industries as the owner.
Disclaimer: The information contained in this publication is based on knowledge and understanding at the time of writing (March 2016). However,
because of advances in knowledge, users are reminded of the need to ensure that information upon which they rely is up to date and to check currency
of the information with the appropriate officer of the Department of Primary Industries or the user’s independent adviser.
*Before July 2004, this report series was published by NSW Fisheries as the ‘NSW Fisheries Final Report Series’ with ISSN 1440-3544. Then, following
the formation of the NSW Department of Primary Industries it was published as the ‘NSW Department of Primary Industries – Fisheries Final Report
Series’ with ISSN 1449-9967. It was then published by Industry & Investment NSW as the ‘Industry & Investment NSW – Fisheries Final Report Series’
with ISSN 1837-2112. It is now published as the ‘NSW Trade and Investment – Fisheries Final Report Series’ with ISSN 2204-8669.

West et al. NSW/ACT Recreational Fishing Survey – 2013/14
i NSW Department of Primary Industries, December 2015
Contents
Contents i
List of tables v
List of figures vi
Acknowledgments xi
Non-technical summary xiii
Introduction 1
Background 1
Developments since the NRFS 2
Developments in other Jurisdictions 2
Recent Development Work by Fisheries NSW 2
Important Notes to the Reader 3
Report Structure Acknowledgment 5
Survey Methods and Analysis 6
Survey Scope 6
Survey Methods 6
Survey Overview 6
Screening Survey 7
Diary Survey 8
Non-intending Fisher Follow-up Survey 9
Wash-up/Attitudinal Survey 9
Regions 9
Sampling Strata 9
Fishing Zones 11
Fishing Effort 12
Fishing Methods 12
Catch 13
Data Expansion and Analysis 13
Data Expansion 13
Statistical Uncertainty 14
Sample and Response Profiles 15
Screening Survey 15
Diary Survey 16
Non-intending Fisher Follow-up Survey 17
Wash-up/Attitudinal Survey 17

West et al. NSW/ACT Recreational Fishing Survey – 2013/14
ii NSW Department of Primary Industries, December 2015
Fisher Characteristics 19
Fishing Participation 19
Age and Gender 20
Fishing Effort 21
Overview 21
Water Body 23
Fishing Platform 23
Fishing Method 25
Fishing Zones 25
Seasonality of Fishing Activity 26
Catch 28
Total Catch, Harvest and Release 28
Reasons for Release 31
Targeted Fishing 33
Harvest Weights 33
Catch by Water Body 35
Catch by Method 37
Line Fishing 38
Catch by Fishing Platform 39
Key Species 40
Bream 41
Dusky Flathead 42
Sand Flathead 43
Leatherjacket 44
Mulloway 45
Australian Salmon 46
Silver Trevally 47
Snapper 48
Tailor 49
Sand Whiting 50
Yellowtail Kingfish 51
Blue Mackerel 52
Mullet 53
Yellowtail Scad 54
Australian Bass 55
European Carp 56

West et al. NSW/ACT Recreational Fishing Survey – 2013/14
iii NSW Department of Primary Industries, December 2015
Golden Perch 57
Murray Cod 58
Redfin Perch 59
Trout 60
Blue Swimmer Crab 61
Mud Crab 62
Yabby (freshwater) 63
Regional Fisheries 64
North Coast Fishing Zone 65
Mid North Coast Fishing Zone 66
Hunter Fishing Zone 67
Sydney Fishing Zone 68
Mid South Coast Fishing Zone 69
South Coast Fishing Zone 70
Murray/South West Fishing Zone 71
Darling/North West Fishing Zone 72
The ACT Fishing Zone 73
Boat Ownership and Vessel Characteristics 74
Household Boat Ownership – June 2013 74
Boats used for Recreational Fishing – June 2013 to May 2014 75
Recreational Fishing Boat Profiles 76
Size of Boats 76
Usage Levels for Recreational Fishing 76
Main Propulsion 77
Boat Storage and Access 78
Electronic Fishing Aids 78
Market Value of Fishing Boats 79
Other Results: Wash-up/Attitudinal Survey 80
Recreational Fishing Motivations 80
Satisfaction with Fishing 81
Other Attitudinal Information 82
Fishing Club Membership and Final Survey Questions 83
Comparison of Key Survey Results – 2000/01 and 2013/14 84
Comparability of Results 84
Fisher Characteristics 84
Participation – Overall and Regionally 84

West et al. NSW/ACT Recreational Fishing Survey – 2013/14
iv NSW Department of Primary Industries, December 2015
Participation by Age and Gender 86
Fishing Effort 88
Catch 91
Broad Catch Rates – Line Fishing 95
Definitions and Methods 95
Broad Catch Rates 95
Boats 97
Club Membership and Attitudinal Results 99
References 101
Appendices 104

West et al. NSW/ACT Recreational Fishing Survey – 2013/14
v NSW Department of Primary Industries, December 2015
List of tables
Table 1 NSW/ACT private dwelling population (number of households) as at June 2013, sample
size and sample loss/response profiles for the Screening Survey, by stratum. ..................... 15
Table 2 Household response profiles for the Diary Survey, by stratum............................................... 16
Table 3 Sample size (households) and sample loss/response profiles for the non-intending
fisher follow-up survey, by stratum. ........................................................................................ 17
Table 4 Estimated number of persons and days fished by NSW/ACT residents aged five years
and older who fished in freshwater or saltwater in NSW or the ACT during 2013/14.
SE is standard error. ............................................................................................................... 21
Table 5 Annual catch (total, kept and released numbers) and proportion released of key species
in NSW/ACT waters during 2013/14, by residents aged five years and older. SE is
standard error; values in bold indicate relative standard error > 40%; values in italics
indicate fewer than 30 households recorded catches of the species. .................................... 30
Table 6 Comparative summary of the proportion of the total catch of key species in NSW/ACT
waters during 2013/14 that was released by residents aged five years and older. ................ 31
Table 7 Reasons for release - proportions (%) of total numbers of key species released in NSW/
ACT waters during 2013/14, by residents aged five years and older. Values in bold
indicate relative standard error > 40%; values in italics indicate fewer than 30 households
recorded catches of the species. ............................................................................................ 32
Table 8 Comparative summary of the proportion of the recreational catch (kept and released) of
key species that was taken by targeted effort in NSW/ACT waters during 2013/14, by
residents aged five years and older. ....................................................................................... 33
Table 9 Harvest of key species in NSW waters by NSW/ACT residents, aged five years and
older - indicative estimates of the total weight (tonnes), compared with estimates for the
commercial fisheries sector during 2013/14. .......................................................................... 35
Table 10 Annual recreational catch (kept and released numbers) of key fish species in NSW/ACT
waters by line fishing mode during 2013/14 and proportions taken by bait or lure/fly, by
residents aged five years and older. SE is standard error; values in bold indicate relative
standard error > 40%; values in italics indicate fewer than 30 households recorded
catches of the species............................................................................................................. 38
Table 11 Comparative summary of the proportion of the total recreational catch (kept and
released) of key species taken in NSW/ACT waters by boat-based fishing during
2013/ 14, by residents aged five years and older. .................................................................. 39
Table 12 Numbers of fishing boats by overall length (grouped) and proportion of all usage for
recreational fishing in 2013/14, i.e. boats owned by NSW/ACT resident fishing
households. SE is standard error; values in bold indicate relative standard error > 40%;
values in italics indicate fewer than 30 households reporting boat ownership. SE is
standard error; values in bold indicate relative standard error > 40%; values in italics
indicate fewer than 30 households reporting boat ownership................................................. 77
Table 13 Numbers of fishing boats by overall length (grouped) and main propulsion method - i.e.
boats used for recreational fishing in 2013/14 and owned by NSW/ACT resident fishing
households. SE is standard error; values in bold indicate relative standard error > 40%;
values in italics indicate fewer than 30 households reporting boat ownership. ...................... 77
Table 14 Numbers of fishing boats by overall length (grouped) and main storage/access mode -
i.e. boats used for recreational fishing in 2013/14 and owned by NSW/ACT resident fishing
households. SE is standard error; values in bold indicate relative standard error > 40%;
values in italics indicate fewer than 30 households reporting boat ownership. ...................... 78
Table 15 Numbers of fishing boats by overall length (grouped) and echo sounder/fish finder
availability, i.e. boats used for recreational fishing in 2013/14 and owned by NSW/ACT
resident fishing households. SE is standard error; values in bold indicate relative
standard error > 40%; values in italics indicate fewer than 30 households reporting
boat ownership. ....................................................................................................................... 78
Table 16 Numbers of fishing boats by overall length (grouped) and global positioning system
(GPS) availability, i.e. boats used for recreational fishing in 2013/14 and owned by
NSW/ACT resident fishing households. SE is standard error; values in bold indicate
relative standard error > 40%; values in italics indicate fewer than 30 households
reporting boat ownership......................................................................................................... 79

West et al. NSW/ACT Recreational Fishing Survey – 2013/14
vi NSW Department of Primary Industries, December 2015
Table 17 Numbers of fishing boats by overall length (grouped) and market value (total and
attributed to fishing), i.e. boats used for recreational fishing in 2013/14 and owned by
NSW/ACT resident fishing households. SE is standard error; values in bold indicate
relative standard error > 40%; values in italics indicate fewer than 30 households
reporting boat ownership......................................................................................................... 79
Table 18 Relative importance of motivational factors for recreational fishing - as reported by the
main/key fisher aged 15 years or more in resident households with recreational fishing
activity in NSW/ACT waters during 2013/14. SE is standard error; values in bold indicate
relative standard error > 40%; values in italics indicate fewer than 30 fishing households
responded. .............................................................................................................................. 81
Table 19 Relative importance of motivational factors for recreational fishing - by fishers aged 15
years and over in resident households with recreational fishing activity in NSW/ACT
waters - comparison of results from 2001 and 2014. ............................................................ 100
List of figures
Figure 1 Survey components diagram - Survey of Recreational Fishing in NSW/ACT, 2013/14 ........... 7
Figure 2 Map of NSW and the ACT, showing ABS-based, residential survey strata used for
sample stratification and population benchmarks. .................................................................. 10
Figure 3 Map of NSW and the ACT showing fishing zones used for reporting fishing activities. ......... 12
Figure 4 Estimated number (A) and proportion (B) of the NSW/ACT resident population aged five
years and older who fished recreationally in NSW or the ACT in the 12 months prior to
June 2013 by stratum. Error bars represent one standard error and the dotted line
represents the participation rate for NSW/ACT as a whole. ................................................... 19
Figure 5 Estimated number (A) and proportion (B) of the NSW/ACT resident population aged five
years and older who fished recreationally in NSW or the ACT in the 12 months prior to
June 2013 by age group and gender. Error bars represent one standard error. ................... 20
Figure 6 Distribution of fishing effort by annual days fished for the NSW/ACT resident population
aged five years and older who fished recreationally in NSW or the ACT during 2013/14. ..... 22
Figure 7 Relationship between the number of fishers and their cumulative fishing effort (days
fished) for NSW/ACT residents aged five years and older who fished recreationally in
NSW or the ACT during 2013/14. Dotted lines indicate that 80% of the fishers accounted
for just over 40% of the total days fished. ............................................................................... 22
Figure 8 Fishing effort (fisher days) by water body type for the NSW/ACT resident population aged
five years and older who fished recreationally in NSW or the ACT during 2013/14. Error
bars represent one standard error. ......................................................................................... 23
Figure 9 Fishing effort (fisher days) by water body type and fishing platform for the NSW/ACT
resident population aged five years and older who fished recreationally in NSW or the
ACT during 2013/14. Error bars represent one standard error. .............................................. 24
Figure 10 Shore-based fishing effort (fisher days) by water body and shore type (natural or man-
made) for the NSW/ACT resident population aged five years and older who fished
recreationally in NSW or the ACT during 2013/14. Error bars represent one standard
error. ........................................................................................................................................ 24
Figure 11 Fishing effort (fisher days) by fishing method for the NSW/ACT resident population aged
five years and older who fished recreationally in NSW or the ACT during 2013/14. Error
bars represent one standard error. ......................................................................................... 25
Figure 12 Fishing effort (fisher days) by fishing zone for the NSW/ACT resident population aged
five years and older who fished recreationally in NSW or the ACT during 2013/14.
Standard errors (SEs) are provided in Appendix 13. .............................................................. 26
Figure 13 Fishing effort (fisher days) by season for the NSW/ACT resident population aged five
years and older who fished recreationally in NSW or the ACT during 2013/14. Error bars
represent one standard error. ................................................................................................. 26
Figure 14 Fishing effort (fisher days) by month for the NSW/ACT resident population aged five
years and older who fished recreationally in NSW or the ACT during 2013/14. Error bars
represent one standard error. ................................................................................................. 27
Figure 15 Catch estimates (kept and released) of key species by residents aged five years and
older in NSW/ACT waters during 2013/14, by water body. Error bars represent one
standard error. ......................................................................................................................... 36

West et al. NSW/ACT Recreational Fishing Survey – 2013/14
vii NSW Department of Primary Industries, December 2015
Figure 16 Catch estimates (kept and released) of key species by residents aged five years and
older in NSW/ACT waters during 2013/14, by fishing method. Error bars represent one
standard error. ......................................................................................................................... 37
Figure 17 Characteristics of the recreational fishery for bream in NSW during 2013/14 – total
catch (numbers kept and released) by NSW/ACT residents by: A) proportion (%) by
fishing zone; B) kept and released; C) boat and shore-based fishing; D) water body
fishing zone; B) kept and released; C) boat and shore-based fishing; D) water body fished;
E) fishing method; and F) seasonality. Error bars represent one standard error, with
equivalent data for A) fishing zones in Appendix 13. .............................................................. 41
Figure 18 Characteristics of the recreational fishery for Dusky Flathead in NSW during 2013/14
– total catch (numbers kept and released) by NSW/ACT residents by: A) proportion (%)
by fishing zone; B) kept and released; C) boat and shore-based fishing; D) water body
fished; E) fishing method; and F) seasonality. Error bars represent one standard error,
with equivalent data for A) fishing zones in Appendix 13. ...................................................... 42
Figure 19 Characteristics of the recreational fishery for Sand Flathead in NSW during 2013/14 –
total catch (numbers kept and released) by NSW/ACT residents by: A) proportion (%) by
fishing zone; B) kept and released; C) boat and shore- based fishing; D) water body
fished; E) fishing method; and F) seasonality. Error bars represent one standard error,
with equivalent data for A) fishing zones in Appendix 13. ...................................................... 43
Figure 20 Characteristics of the recreational fishery for leatherjacket in NSW during 2013/14 –
total catch (numbers kept and released) by NSW/ACT residents by: A) proportion (%) by
fishing zone; B) kept and released; C) boat and shore-based fishing; ; D) water body
fished; E) fishing method; and F) seasonality. Error bars represent one standard error,
with equivalent data for A) fishing zones in Appendix 13. ...................................................... 44
Figure 21 Characteristics of the recreational fishery for Mulloway in NSW during 2013/14 – total
catch (numbers kept and released) by NSW/ACT residents by: A) proportion (%) by
fishing zone; B) kept and released; C) boat and shore-based fishing; D) water body
fished; E) fishing method; and F) seasonality. Error bars represent one standard error,
with equivalent data for A) fishing zones in Appendix 13. ...................................................... 45
Figure 22 Characteristics of the recreational fishery for Australian Salmon in NSW during 2013/14 –
total catch (numbers kept and released) by NSW/ACT residents by: A) proportion (%) by
fishing zone; B) kept and released; C) boat and shore-based fishing; D) water body
fished; E) fishing method; and F) seasonality. Error bars represent one standard error,
with equivalent data for A) fishing zones in Appendix 13. ...................................................... 46
Figure 23 Characteristics of the recreational fishery for Silver Trevally in NSW during 2013/14 – total
catch (numbers kept and released) by NSW/ACT residents by: A) proportion (%) by
fishing zone; B) kept and released; C) boat and shore-based fishing; D) water body
fished; E) fishing method; and F) seasonality. Error bars represent one standard error,
with equivalent data for A) fishing zones in Appendix 13. ...................................................... 47
Figure 24 Characteristics of the recreational fishery for Snapper in NSW during 2013/14 – total catch
(numbers kept and released) by NSW/ACT residents by: A) proportion (%) by fishing
zone; B) kept and released; C) boat and shore-based fishing; D) water body fished; E)
fishing method; and F) seasonality. Error bars represent one standard error, with
equivalent data for A) fishing zones in Appendix 13. .............................................................. 48
Figure 25 Characteristics of the recreational fishery for Tailor in NSW during 2013/14 – total catch
(numbers kept and released) by NSW/ACT residents by: A) proportion (%) by fishing
zone; B) kept and released; C) boat and shore-based fishing; D) water body fished; E)
fishing method; and F) seasonality. Error bars represent one standard error, with
equivalent data for A) fishing zones in Appendix 13. .............................................................. 49
Figure 26 Characteristics of the recreational fishery for Sand Whiting in NSW during 2013/14 – total
catch (numbers kept and released) by NSW/ACT residents by: A) proportion (%) by
fishing zone; B) kept and released; C) boat and shore-based fishing; D) water body
fished; E) fishing method; and F) seasonality. Error bars represent one standard error,
with equivalent data for A) fishing zones in Appendix 13. ...................................................... 50
Figure 27 Characteristics of the recreational fishery for Yellowtail Kingfish in NSW during 2013/14 –
total catch (numbers kept and released) by NSW/ACT residents by: A) proportion (%) by
fishing zone; B) kept and released; C) boat and shore-based fishing; D) water body
fished; E) fishing method; and F) seasonality. Error bars represent one standard error,
with equivalent data for A) fishing zones in Appendix 13. ...................................................... 51

West et al. NSW/ACT Recreational Fishing Survey – 2013/14
viii NSW Department of Primary Industries, December 2015
Figure 28 Characteristics of the recreational fishery for Blue Mackerel in NSW during 2013/14 – total
catch (numbers kept and released) by NSW/ACT residents by: A) proportion (%) by
fishing zone; B) kept and released; C) boat and shore-based fishing; D) water body
fished; E) fishing method; and F) seasonality. Error bars represent one standard error,
with equivalent data for A) fishing zones in Appendix 13. ...................................................... 52
Figure 29 Characteristics of the recreational fishery for mullet in NSW during 2013/14 – total catch
(numbers kept and released) by NSW/ACT residents by: A) proportion (%) by fishing
zone; B) kept and released; C) boat and shore-based fishing; D) water body fished; E)
fishing method; and F) seasonality. Error bars represent one standard error, with
equivalent data for A) fishing zones in Appendix 13. .............................................................. 53
Figure 30 Characteristics of the recreational fishery for Yellowtail Scad in NSW during 2013/14 –
total catch (numbers kept and released) by NSW/ACT residents by: A) proportion (%) by
fishing zone; B) kept and released; C) boat and shore-based fishing; D) water body
fished; E) fishing method; and F) seasonality. Error bars represent one standard error,
with equivalent data for A) fishing zones in Appendix 13. ...................................................... 54
Figure 31 Characteristics of the recreational fishery for Australian Bass in NSW during 2013/14 –
total catch (numbers kept and released) by NSW/ACT residents by: A) proportion (%) by
fishing zone; B) kept and released; C) boat and shore-based fishing; D) water body
fished; E) fishing method; and F) seasonality. Error bars represent one standard error,
with equivalent data for A) fishing zones in Appendix 13. ...................................................... 55
Figure 32 Characteristics of the recreational fishery for European Carp in NSW/ACT waters during
2013/14 – total catch (numbers kept and released) by residents by: A) proportion (%) by
fishing zone; B) kept and released; C) boat and shore-based fishing; D) water body
fished; E) fishing method; and F) seasonality. Error bars represent one standard error,
with equivalent data for A) fishing zones in Appendix 13. ...................................................... 56
Figure 33 Characteristics of the recreational fishery for Golden Perch in NSW/ACT waters during
2013/14 – total catch (numbers kept and released) by residents by: A) proportion (%) by
fishing zone; B) kept and released; C) boat and shore-based fishing; D) water body
fished; E) fishing method; and F) seasonality. Error bars represent one standard error,
with equivalent data for A) fishing zones in Appendix 13. ...................................................... 57
Figure 34 Characteristics of the recreational fishery for Murray Cod in NSW/ACT waters during
2013/14 – total catch (numbers kept and released) by residents by: A) proportion (%) by
fishing zone; B) kept and released; C) boat and shore-based fishing; D) water body
fished; E) fishing method; and F) seasonality. Error bars represent one standard error,
with equivalent data for A) fishing zones in Appendix 13. ...................................................... 58
Figure 35 Characteristics of the recreational fishery for Redfin Perch in NSW/ACT waters during
2013/14 – total catch (numbers kept and released) by residents by: A) proportion (%) by
fishing zone; B) kept and released; C) boat and shore-based fishing; ; D) water body
fished; E) fishing method; and F) seasonality. Error bars represent one standard error,
with equivalent data for A) fishing zones in Appendix 13. ...................................................... 59
Figure 36 Characteristics of the recreational fishery for trout in NSW during 2013/14 – total catch
(numbers kept and released) by NSW/ACT residents by: A) proportion (%) by fishing
zone; B) kept and released; C) boat and shore-based fishing; D) water body fished; E)
fishing method; and F) seasonality. Error bars represent one standard error, with
equivalent data for A) fishing zones in Appendix 13. .............................................................. 60
Figure 37 Characteristics of the recreational fishery for Blue Swimmer Crab in NSW during 2013/14
– total catch (numbers kept and released) by NSW/ACT residents by: A) proportion (%)
by fishing zone; B) kept and released; C) boat and shore-based fishing; D) water body
fished; E) fishing method; and F) seasonality. Error bars represent one standard error,
with equivalent data for A) fishing zones in Appendix 13. ...................................................... 61
Figure 38 Characteristics of the recreational fishery for Mud Crab in NSW during 2013/14 – total
catch (numbers kept and released) by NSW/ACT residents by: A) proportion (%) by
fishing zone; B) kept and released; C) boat and shore-based fishing; D) water body
fished; E) fishing method; and F) seasonality. Error bars represent one standard error,
with equivalent data for A) fishing zones in Appendix 13. ...................................................... 62
Figure 39 Characteristics of the recreational fishery for freshwater yabbies in NSW during 2013/14 –
total catch (numbers kept and released) by NSW/ACT residents by: A) proportion (%) by
fishing zone; B) kept and released; C) boat and shore-based fishing; D) water body
fished; E) fishing method; and F) seasonality. Error bars represent one standard error,
with equivalent data for A) fishing zones in Appendix 13. ...................................................... 63

West et al. NSW/ACT Recreational Fishing Survey – 2013/14
ix NSW Department of Primary Industries, December 2015
Figure 40 Characteristics of the North Coast recreational fishery based on 2013/14 fishing activity
by NSW/ACT residents aged five years and older: A) fishing effort (fisher days) by
residential stratum; B) fisher days by platform; C) fisher days by water body type; and
D) total catch (numbers) for the key species. Error bars represent one standard error. ....... 65
Figure 41 Characteristics of the Mid North Coast recreational fishery based on 2013/14 fishing
activity by NSW/ACT residents aged five years and older: A) fishing effort (fisher days)
by residential stratum; B) fisher days by platform; C) fisher days by water body type; and
D) total catch (numbers) for the key species. Error bars represent one standard error. ....... 66
Figure 42 Characteristics of the Hunter recreational fishery based on 2013/14 fishing activity by
NSW/ACT residents aged five years and older: A) fishing effort (fisher days) by
residential stratum; B) fisher days by platform; C) fisher days by water body type; and
D) total catch (numbers) for the key species. Error bars represent one standard error. ....... 67
Figure 43 Characteristics of the Sydney recreational fishery based on 2013/14 fishing activity by
NSW/ACT residents aged five years and older: A) fishing effort (fisher days) by
residential stratum; B) fisher days by platform; C) fisher days by water body type; and
D) total catch (numbers) for the key species. Error bars represent one standard error. ....... 68
Figure 44 Characteristics of the Mid South Coast recreational fishery based on 2013/14 fishing
activity by NSW/ACT residents aged five years and older: A) fishing effort (fisher days)
by residential stratum; B) fisher days by platform; C) fisher days by water body type; and
D) total catch (numbers) for the key species. Error bars represent one standard error. ....... 69
Figure 45 Characteristics of the South Coast recreational fishery based on 2013/14 fishing activity
by NSW/ACT residents aged five years and older: A) fishing effort (fisher days) by
residential stratum; B) fisher days by platform; C) fisher days by water body type; and
D) total catch (numbers) for the key species. Error bars represent one standard error. ....... 70
Figure 46 Characteristics of the Murray/South West recreational fishery based on 2013/14 fishing
activity by NSW/ACT residents aged five years and older: A) fishing effort (fisher days)
by residential stratum; B) fisher days by platform; C) fisher days by by platform; C)
fisher days by water body type; and D) total catch (numbers) for the key species. Error
bars represent one standard error. ......................................................................................... 71
Figure 47 Characteristics of the Darling/North West recreational fishery based on 2013/14 fishing
activity by NSW/ACT residents aged five years and older: A) fishing effort (fisher days)
by residential stratum; B) fisher days by platform; C) fisher days by water body type; and
D) total catch (numbers) for the key species. Error bars represent one standard error. ....... 72
Figure 48 Characteristics of the ACT recreational fishery based on 2013/14 fishing activity by
NSW/ACT residents aged five years and older: A) fishing effort (fisher days) by
residential stratum; B) fisher days by platform; C) fisher days by water body type; and
D) total catch (numbers) for the key species. Error bars represent one standard error. ....... 73
Figure 49 Proportion (%) of fisher and non-fisher households in NSW and the ACT reporting boat
ownership as at June 2013, by residential stratum. Error bars represent one standard
error. ........................................................................................................................................ 74
Figure 50 Proportion (%) of NSW/ACT fisher households reporting boat ownership as at May 2014,
by residential stratum. Error bars represent one standard error. ........................................... 75
Figure 51 Number of boats owned by NSW/ACT fisher households and used for recreational fishing
in 2013/14, by residential stratum. Error bars represent one standard error. ........................ 76
Figure 52 Overall satisfaction with recreational fishing for the 12 month diary period – as reported
by the main/key fisher aged 15 years and older, in each resident household with fishing
activity in NSW/ACT waters. Error bars represent one standard error. ................................. 82
Figure 53 Recreational fishing participation in the 12 months prior to May 2000 and June 2013 by
residents aged five years and older in NSW/ACT waters: A) number of persons; and B)
proportion of the resident population. Error bars represent one standard error. ................... 85
Figure 54 Recreational fishing participation in the 12 months prior to May 2000 and June 2013 by
residents aged five years and older in NSW/ACT waters, by residential stratum: A)
number of persons; and B) proportion of the resident population. Error bars represent
one standard error. Note: the regional boundaries in 2000 differed slightly to those in
2013 - the Australian Statistical Geography Standard (ASGS) (Pink 2011). .......................... 86
Figure 55 Recreational fishing participation in the 12 months prior to May 2000 and June 2013 by
residents aged five years and older in NSW/ACT waters, by age group: A) number of
persons; and B) proportion of the resident population. Error bars represent one standard
error. ........................................................................................................................................ 87

West et al. NSW/ACT Recreational Fishing Survey – 2013/14
x NSW Department of Primary Industries, December 2015
Figure 56 Comparison of fishing effort (fisher days) by residents aged five years and older who
fished in NSW/ACT waters during 2000/01, compared with 2013/14 - by freshwater and
saltwater. Error bars represent one standard error. ............................................................... 88
Figure 57 Comparison of fishing effort (fisher days) by residents aged five years and older who
fished in NSW/ACT waters during 2000/01, compared with 2013/14 – by fishing platform
(boat and shore). Error bars represent one standard error.................................................... 89
Figure 58 Comparison of fishing effort (fisher days) by residents aged five years and older who
fished in NSW/ACT waters during 2000/01, compared with 2013/14 – by fishing method.
Error bars represent one standard error. ................................................................................ 89
Figure 59 Comparison of fishing effort (fisher days) by residents aged five years and older who
fished in NSW/ACT waters during 2000/01, compared with 2013/14 – by water body type.
Error bars represent one standard error. ................................................................................ 90
Figure 60 Comparison of fishing effort (fisher days) by residents aged five years and older who
fished in NSW/ACT waters during 2000/01, compared with 2013/14 – by fishing zone.
Error bars represent one standard error. ................................................................................ 90
Figure 61 Total catch numbers (kept and released), harvest numbers (kept), and proportion (%) of
the total catch released for key marine species, by residents aged five years and older
who fished in NSW/ACT waters during 2000/01, compared with 2013/14. Error bars
represent one standard error. ................................................................................................. 92
Figure 62 Total catch numbers (kept and released), harvest numbers (kept), and proportion (%) of
the total catch released for key freshwater species, by residents aged five years and older
who fished in NSW/ACT waters during 2000/01, compared with 2013/14. Error bars
represent one standard error. ................................................................................................. 94
Figure 63 Mean line fishing catch rates of ‘desirable’ finfish species, by residents aged five years
and older who fished in NSW/ACT waters during 2000/01, compared with 2013/14 – by
saltwater and freshwater. Error bars represent one standard error. ...................................... 96
Figure 64 Mean line fishing catch rates of key saltwater and freshwater finfish species/groups by
residents aged five years and older who fished in NSW/ACT waters during 2000/01,
compared with 2013/14. Error bars represent one standard error. ....................................... 97
Figure 65 Proportion (%) of recreational fishing boats used by residents in NSW/ACT waters during
2000/01, compared with 2013/14 – by main propulsion method. Error bars represent one
standard error. ......................................................................................................................... 98
Figure 66 Proportion (%) of recreational fishing boats used by residents in NSW/ACT waters during
2000/01, compared with 2013/14 – with availability of: A) echo sounder or ‘fish finder’;
and B) global positioning system (GPS). Error bars represent one standard error. .............. 99
Figure 67 Comparison of overall satisfaction with recreational fishing for the 12 month diary period –
as reported by fishers in resident households with fishing activity in NSW/ACT waters in
2000/01, compared with 2013/14. Error bars represent one standard error. ...................... 100

West et al. NSW/ACT Recreational Fishing Survey – 2013/14
xi NSW Department of Primary Industries, December 2015
Acknowledgments
The support of all Fisheries NSW staff in various technical, administrative and operational areas
has greatly contributed to the success of this project, including the various reviewers of this
report: Bob Creese, Michael Lowry, Peter Turnell and Bryan Van der Walt. Thanks also to Jim
Craig for providing commercial fisheries data for weight estimation and especially to Joe Neilson
and Geoff Barrett for their help in developing the GIS coding system for the Diary Survey data.
Other important contributors include:
• firstly, a special acknowledgment to Shirley Munro - our longest serving interviewer, with
close to 50 years direct experience in household surveys (including with ABS). Shirley
has now decided to retire, even though the quality of her work has never diminished in all
this time. Indeed Shirley has consistently delivered the highest response rates and the
lowest error rates of all our interviewers and not surprisingly, maintained her “No.1”
ranking throughout this survey – despite celebrating her 82
nd
birthday in the final month
of the Diary Survey. You’ve had an astonishing career Shirl and you’re leaving very big
shoes to fill - we’re all going to miss you!
• the various photographers who provided the high quality images for this report and also
for the cover page of our Species Identification Guide for the Diary Survey: Glenn Biclar,
Graham Grocott, Brian James, Duy Khang Ngo, Hanz Kilian, James Milicevic, Warren
Robinson, Michael Sephton and Glen Towler;
• Patrick Tully, for the high quality images of various fish and other species contained in
this report and also, to Roger Swainston (ANIMA.net.au) for the many high quality
species images used in our Species Identification Guide;
• Aldo Steffe, formerly Fisheries NSW – for his significant inputs in the initial development
phase of this project and particularly, his ‘devil’s advocacy’ role in assessment of new
methodologies and various research options;
• Ken Pollock, Professor of Applied Ecology and Statistics, North Carolina State University
– especially for his advice in the initial development of the hybrid survey methodology,
which will no doubt prove to be a highly cost-effective approach in the future. Once
again, Ken’s dedication and expertise in terms of innovative recreational fisheries
research have emerged here;
• Simon Wotherspoon, University of Tasmania – for his ongoing assistance in refining the
RecSurvey analysis package and particularly in identifying various options, issues and
solutions for future dual-frame/hybrid surveys;
• Cheryl Munro, Assistant Survey Manager, Kewagama Research – for her primary role in
the recruitment of all new interviewing and office staff, an enormous task with the many
hundreds of applicants. Also, for her involvement in the training and ongoing
management of these staff, along with database development and all data editing;
• Kirrily McInnes, Recreational Fisheries Monitoring Unit, Fisheries Queensland – for her
invaluable assistance in the training of new interviewing staff and in handling all day-to-
day management of the state-wide survey in Queensland, which was conducted largely
in parallel to the NSW/ACT survey;
• our dedicated and professional team of highly-experienced and new interviewers: Colin
and Janette Buchanan, Peta Catt, Sharyn Clelland, Susan Collins, Bel Dobson, Suzy
Downes, Pip Jacobson, Lisa Kruck, Shirley Lines, Frances Lyrmont, Kellie Merriman,
Shirley Munro (mentioned above), Virginia Murphy, Robyn and Terry Parry, Karen
Rodwell, Kathleen Sammon, Leanne Staff, Deb Taylor and Jane Thrum; Once again,

West et al. NSW/ACT Recreational Fishing Survey – 2013/14
xii NSW Department of Primary Industries, December 2015
our interviewers have set the standard in terms of response rates and data quality for
telephone/diary surveys;
• our specialist data entry and editing staff whose attention to detail and accuracy are
always very much appreciated: Joanne Berridge, Amanda Smith, Lynn Taylor and Alicia
Trinder;
• finally and most importantly, the many thousands of residents who so willingly
participated in the various surveys – especially, the fishers in the Diary Survey for their
interest and continued co-operation over the 12 month period.

West et al. NSW/ACT Recreational Fishing Survey – 2013/14
xiii NSW Department of Primary Industries, December 2015
Non-technical summary
Survey of Recreational Fishing in New South Wales and the ACT, 2013/14
Principal investigators:
Consultant Staff: Kewagama Research – Laurie West
(Managing Director) and sub-consultants: Kate Stark and
Jeremy Lyle
77 Redwood Rd, Doonan, QLD 4562
Phone: 07 5471 1426
Departmental Staff: Jeff Murphy and Faith Ochwada-Doyle
C/-Port Stephens Fisheries Institute
Locked Bag 1
NELSON BAY NSW 2315
Phone: 02 4982 1232
Objectives
To provide detailed ‘big picture’ information for recreational fishing in NSW and ACT waters, by
residents aged five years and older. Data elements included:
• fishing participation levels – by age, gender and residential region;
• detailed annual catch and effort information – by fishing method, platform (boat or shore),
water body type (e.g. ocean waters, estuaries, rivers and lakes/dams) and for nine
defined fishing zones;
• boat ownership levels and profiling of the recreational fishing ‘fleet’; and
• the opinions of recreational fishers and other attitudinal information.
Also, optimum comparability was required with the National Recreational Fishing Survey (NRFS,
2000/01), thereby enabling direct comparison of key survey results between the two periods.
Key words
Recreational fishing, Telephone/diary survey
Summary
Background and Development Work
The NRFS was the first comprehensive assessment of recreational fishing in Australia and
provided a range of ‘big picture’ information (as noted above) for each state and territory (Henry
and Lyle, 2003). Since then, various jurisdictions have conducted state/territory-wide surveys to
provide comparable information to the NRFS. In each of these studies, the main survey
instrument (an ‘off-site’ telephone/diary survey) has been the same – with stratified random
sampling from ‘White Pages’ telephone listings and expansion of all survey results to Australian
Bureau of Statistics (ABS) estimates of the resident population for the state/territory concerned.
Analysis of these surveys has been conducted using a customised analysis package
(RecSurvey; Lyle et al., 2009a).
Since the NRFS, Fisheries NSW has conducted a number of ‘on-site’ surveys, including several
with large spatial and temporal scales, e.g. the Recreational Fishing Surveys in the Greater
Sydney Region (Steffe et al., 2011). Also, in the lead-up to the present survey, extensive

West et al. NSW/ACT Recreational Fishing Survey – 2013/14
xiv NSW Department of Primary Industries, December 2015
development work was undertaken to optimise data quality and utility for telephone/diary surveys
– a key feature of which, has been the development and application of ‘dual-frame/hybrid’
sampling.
In the current survey, White Pages sampling comprised the ‘core’ sample frame and has
provided direct comparibility with NRFS data for NSW and the ACT, as for telephone/diary
surveys in other jurisdictions. Also, as an integral part of the hybrid survey design,
supplementary sampling was undertaken of licence holders from the NSW Recreational Fishing
Fee (RFF) database. However by design, the results from this component are the subject of
separate analysis and reporting. Therefore, all substantive survey results in this report refer to
the White Pages sample frame for NSW/ACT residents, together with comparable data from the
NRFS.
Survey Methods
In the present survey, participation rates and the demographic profiles of resident recreational
fishers were assessed through a regionally-stratified, random telephone survey of over 9,400
NSW/ACT households – comprising over 22,000 residents aged five years and older. This
Screening Survey also identified households with an intention to fish in the coming 12 months
and in the subsequent Diary Survey, the fishing activities of nearly 1,700 households were
monitored in detail between June 2013 and May 2014. All survey information was recorded by
specialist interviewers through regular telephone contact with diarists and over 11,800 person-
based fishing events were reported by more than 2,000 recreational fishers. Note: as for many
state/territory-wide surveys since the NRFS, fishing-related expenditure information was not
collected in the survey.
A Wash-up/Attitudinal Survey was conducted as the final contact with diarists to collect boat
ownership details and examine fishers’ opinions and attitudes to various fishing-related matters.
Also, a sample of households from the original Screening Survey that reported no intention to
fish was re-contacted at the end of the diary period to identify and account for any unexpected
fishing (the Non-intending Fisher Follow-up Survey). Response rates across all survey
components were exceptionally high (often in excess of 90%) – confirming both the high levels
of interest and co-operation by recreational fishers and the performance standards of the survey
instrument. By calibrating against ABS population benchmarks (as at June 2013) and applying
non-response adjustments, all survey results (including participation, effort, catch and boat
ownership) have been expanded to represent the resident population of NSW and the ACT,
aged five years and older.
Key Results
Fishing Participation
An estimated 849,249 (SE 27,639) NSW/ACT residents aged five years and older fished at least
once in Australian waters in the twelve months prior to June 2013, representing a participation
rate of 11.9% (SE 0.4%). The vast majority (98.5%) of these residents fished in NSW or ACT
waters during this time (836,632 residents; SE 27,456) representing a participation rate of 11.7%
(SE 0.4%).
This report focuses on the latter group, namely residents who fished in NSW or ACT waters.
While close to half (45%) of all recreational fishers resided in the Sydney region, this also
represented the lowest participation rate (8.6%). The highest participation rate (20.7%) occurred
in the south-east of the state. Males accounted for well over two-thirds of the recreational
fishers with a participation rate of 16.9%, compared with 6.6% for females. Although the highest
number of fishers was in the 30-44 years age group (217,639 persons), children (5-14 years)
had the highest participation rate (19.6%). Persons in the 60 years plus age group had the
lowest rate of participation (6.7%).

West et al. NSW/ACT Recreational Fishing Survey – 2013/14
xv NSW Department of Primary Industries, December 2015
Fishing Effort
During the 12 months between June 2013 and May 2014, resident fishers aged 5 years and
older accounted for an estimated 3,181,035 fisher days in NSW or ACT waters – or an average
of 4.3 days per fisher. However, as with most recreational fisheries, the distribution of fishing
effort was highly skewed, with a relatively small number of fishers (20%) accounting for a high
proportion (almost 60%) of total fisher days.
The majority (79%) of all recreational fishing activity occurred in saltwater – primarily estuaries,
followed by inshore and offshore waters. Over half of all freshwater fishing occurred in rivers, as
opposed to lakes and dams. Shore-based fishing accounted for 59% of all fisher days and line
fishing (whether with bait or lures) was the dominant fishing method at 93% of the total effort.
The use of pots or traps was relatively minor, along with nets, diving and other methods (e.g.
digging and hand-collecting).
Regionally, the six coastal fishing zones accounted for the vast majority (84%) of all fisher days,
with the Mid South Coast (22%) and Sydney (19%) having the highest activity levels. The three
inland zones accounted for 16% of total fisher days, with the majority (10%) in the Murray/South
West zone. In terms of seasonality, the summer period accounted for a third (33%) of total
fisher days, followed by autumn (25%), spring (23%) and winter (19%).
Catch
Resident recreational fishers captured a diverse range of scalefish, elasmobranchs (sharks and
rays), crustaceans, molluscs and other taxa, with an estimated 14,059,634 organisms caught
during the 12 month survey period. Of the total catch, 7,843,644 (56%) were retained and the
remaining 6,215,990 (44%) were released. Fish (scalefish and elasmobranchs) accounted for
75% of the total catch by numbers, followed by crustaceans (21%), worms (2%), cephalopods
and molluscs (at 1% each).
In terms of saltwater fish, bream was the most common species group caught (an estimated
2,205,656), followed by the various flathead species (2,103,835), Snapper (755,350) and the
whiting species group (733,620). Among the freshwater fish, European Carp (500,164) was the
main species caught, followed by Australian Bass (195,802), Murray Cod (165,557) and trout
(Brown and Rainbow – a total of 157,975).
The smaller crustacean species dominated the remainder of the total catch (by numbers) –
saltwater nippers (1,415,852), followed by saltwater prawns (728,843) and freshwater shrimp
(409,711). Freshwater yabbies (275,108) accounted for the majority of the larger crustaceans,
followed by Blue Swimmer Crab (73,501), Mud Crab (48,634) and rock lobster (26,507).
Overall, 44% of all species caught were released (or discarded), with the highest rates of release
(>75%) for species such as Australian Bass, Mulloway, Murray Cod, Red Rock Cod, sharks and
rays, Snapper and wrasse/gropers. By contrast, the lowest release rates (<25%) occurred for
species such as European Carp, Blue Mackerel, Trumpeter Whiting, tunas and various
crustaceans. In terms of reasons for release, ‘small size’ was the primary release reason for
over two-thirds of all species groups and especially for major ‘table’ species, such as bream,
flathead, whiting, key freshwater finfish, the various crustaceans and squid. Large catches (‘too
many’ or ‘over bag limit’) were the primary release reason for Freshwater Shrimp and various
small bait species. ‘Catch and release’ emerged as the primary release reason for Australian
Salmon and Australian Bass, with ‘un-wanted’ the main reason for Red Rock Cod, sharks and
rays and various other scalefish.
Total recreational harvest weights were estimated for 10 key species and compared with
commercial fisheries data. Recreational catches exceeded commercial landings for 5 of the 10
species – namely: 71% of the total harvest of Dusky Flathead; 67% for Sand Flathead; 63% for
both Mulloway and Tailor; and 52% for Yellowtail Kingfish. The recreational catches of bream,

West et al. NSW/ACT Recreational Fishing Survey – 2013/14
xvi NSW Department of Primary Industries, December 2015
Sand Whiting and Snapper were slightly lower than commercial landings (ranging from 40-49%
of the total harvest), whereas the recreational catch of Australian Salmon and Silver Trevally
were substantially smaller than the commercial harvest (both at 14% of the overall total).
Catch and effort data for some 23 key species have been examined in detail, based on fishing
zone, fishing method, fishing platform, water body type and seasonality. All such results are
also available for many other key species/groups in various tables and appendices throughout
the report. The characteristics of regional fisheries (fishing zones) have also been examined in
detail, namely the levels of fishing effort by where fishers resided, fishing platform, water body
type and total catch estimates for the key species in each area.
Boat Ownership
In the Screening Survey, boat ownership was broadly assessed with 11% of all NSW/ACT
households reporting ownership of at least one boat, as at June 2013. Substantially higher
ownership levels (38%) emerged among households with any fishing activity in the previous 12
months, compared with 6% for non-fishing households.
Boat ownership and profiling information was also assessed in the Wash-up/Attitudinal Survey
for those households with any fishing activity during the diary period. In response, an estimated
180,622 (or 44% of) fishing households reported ownership of at least one boat, for a total of
230,118 boats – or close to 1.3 boats per household. Over three-quarters (76%) of these boats
were used for fishing during the diary period, resulting in an estimated recreational fishing ‘fleet’
of 173,895 boats. Most of these boats were powered/trailer boats, with two-thirds (66%) less
than 5 metres in length. Echo sounders were reported in a majority (56%) of the fleet and 39%
with GPS units. The estimated total market value of the recreational fishing fleet as at May 2014
was over $1.534 billion – an average of $8,826 per boat.
Recreational Fishing Motivations, Satisfaction and Final Questions
In the Wash-up/Attitudinal Survey, membership of a “fishing or diving club ... or association” was
assessed, with close to 6% of all fishers aged 5 years and older reporting current membership.
Fishers were also asked to rate the importance of eight motivational factors in relation to
recreational fishing. The highest general importance rating (95% with at least ‘quite important’)
emerged for “to be outdoors, in the fresh air ... to enjoy nature”, followed by “to relax or unwind”
(92%) and “the enjoyment or sport of catching fish, crabs etc” (85%). Social factors also scored
highly, with “to spend time with your family” and “to spend time with your friends”, both around
80%. Lower ratings emerged for “to catch fresh fish/crabs etc. for food” (58%), followed by “to
be on your own ... to get away from people” (41%) and “to compete in fishing competitions of
any kind” (less than 5%).
Respondents were also asked to rate their satisfaction with the overall quality of their fishing
during the diary period. In response, three-quarters (76%) of fishers reported being at least
quite satisfied, with similar general satisfaction rates across the residential strata and age
groups. All respondents reporting general dissatisfaction (24%) with their fishing were asked
their reasons and in many cases, low catch rates were cited as the main reason.
Comparison of Results – 2000/01 and 2013/14
As noted earlier, a key objective of the present survey was to optimise comparability with results
from the NRFS and to identify any changes or developments in the recreational fishery that
might have occurred over the thirteen year period. However, despite the fundamental
comparability and robust nature of the two studies, the issue of inter-annual variability between
the two surveys is a critical factor when interpreting any differences e.g. natural changes in
abundance of individual species. Other factors should also be considered, such as changes
over time in terms of: fishing practices (e.g. increased usage of lures); targeting preferences;
technology (e.g. GPS availability); and regulations, such as size and bag/possession limits.

West et al. NSW/ACT Recreational Fishing Survey – 2013/14
xvii NSW Department of Primary Industries, December 2015
The final results section in this report (‘Comparison of Key Survey Results – 2000/01 and
2013/14’, Page 84) provides detailed analysis of results from the two surveys and due to the
volume and complexity of this information, readers should routinely refer to this section for any
comparison or review purposes. However, several key findings have been noted below.
Firstly, participation rates for recreational fishing in NSW/ACT waters decreased from 16.6% of
the resident population aged five years and older in 2000 to 11.7% in 2013. Importantly,
decreased participation rates have also occurred in other states, territories and overseas. In
fact, based on results from various state/territory-wide surveys since the NRFS, the level of
decrease has been higher in most other jurisdictions. For example, in the same 13 year period,
the participation rate in Queensland decreased from 23.5% to 15.1% (Webley et al., in press).
Note: This report contains discussion of various contributing factors, e.g. the ‘ageing’ of the
population and also provides comparative information for levels of fishing effort (fisher days)
and total catch for key species (including harvest/kept and released components).
To assist with this comparative work, a broad catch rate analysis for line fishing was conducted
for ‘desirable’ key finfish species (both freshwater and saltwater), i.e. those fish generally
regarded as good ‘table’ quality or sportfish species. Among the ‘desirable’ fish species/groups,
the overall catch rates increased between the two surveys for various species (e.g. Yellowtail
Kingfish, Australian Salmon, Murray Cod and Mulloway), with relatively stable catch rates for
other species (e.g. bream, Snapper and the various flathead species) and decreased catch rates
in several cases (e.g. Tailor, Golden Perch, leatherjackets and the various whiting species).
However, when analysed more simply as the proportion of ‘zero’ catch versus ‘successful’ line
fishing days (i.e. at least some catch), little difference emerged – namely, ‘zero’ catch days
comprised 31% and 33% (respectively) of all line fishing days in the two periods.
Very similar boat ownership rates were assessed for NSW/ACT resident households between
the two periods (around one in ten households in both cases), with consistently higher
ownership rates among fishing households (34% and 38%, respectively), than for non-fishing
households (4% and 6%, respectively). Also, among the recreational fishing ‘fleet’, substantial
increases occurred in terms of the proportion of: kayaks and other ‘paddle’ craft (a doubling
between the two surveys); boats with echo sounder availability (over 50% more); and GPS
availability (more than triple).
The proportion of recreational fishers who were identified as being a member of a “fishing or
diving club ... or association” was very similar in the two surveys (6.1% and 5.7%, respectively).
Also, virtually no changes occurred in terms of the relative importance of eight motivational
factors for recreational fishing, as rated by respondents. For example, two non-catch related
factors scored the highest ratings in both surveys, firstly: “to be outdoors, in the fresh air ... to
enjoy nature” – where over 94% of fishers rated this factor as at least quite important in both
cases; then secondly “to relax or unwind”, with 92% reporting at least quite important in both
surveys. The third highest rating factor was catch-related, namely “for the enjoyment or sport of
catching fish, crabs, etc” with over 81% in both cases.
Respondents were also asked how satisfied they were with the overall quality of their fishing
during the 12 month diary period in both surveys – with 61% reporting being at least quite
satisfied in 2001, compared with a substantial increase to 76% in 2014.
Finally, the project has achieved all its goals and objectives, with an extensive range of data
available for NSW/ACT recreational fisheries. In addition to this report, a substantial database
has been established to support management and ongoing sustainability of fisheries resources.

West et al. NSW/ACT Recreational Fishing Survey – 2013/14
1 NSW Department of Primary Industries, December 2015
Introduction
Background
Catch and effort data are essential for effective research and management of both commercial
and recreational fisheries. Participation assessments, along with attitudinal and economic
information are also important. Typically, core monitoring data are more easily obtained for the
commercial fisheries sector, due to the smaller number of participants and the existence of
mandatory reporting requirements.
Over the years, the comparatively high cost of recreational fisheries research has led to a lack of
detailed information for this sector and particularly, on a state/territory-wide basis. Recognising
this need, in 1993 the Northern Territory government commissioned Kewagama Research to
develop and implement a survey methodology to collect this information – Fishcount (Coleman,
1998). This was the first study of its kind in Australia to provide detailed estimates of
recreational fishing on a jurisdiction-wide basis, including participation, catch, effort and fishing-
related expenditure.
Around that time, similar concerns in other jurisdictions led to the development of a national
policy for recreational fishing in Australia. The policy was released in 1994 and endorsed the
principle that “fisheries management decisions should be based on sound information including
fish biology, fishing activity, catches and economic and social values of recreational fishing”
(NRFWG, 1994). The policy recommended that a national survey of recreational fishing be
undertaken once every five years.
Following extensive consultation and development, the Commonwealth, state and territory
fisheries agencies implemented the National Recreational Fishing Survey (NRFS) in 2000. The
key objectives of the NRFS were: to determine participation rates in recreational fishing; profile
the demographic characteristics of recreational fishers; quantify recreational catch and effort;
collect data on expenditure by the recreational fishing sector; and assess attitudes and
awareness of recreational fishers to issues relevant to the fishery (Henry and Lyle, 2003).
The NRFS was implemented as a series of state/territory-wide surveys using a common
methodology, providing comparable information on an Australia-wide basis and including the
activity of visiting interstate fishers. In addition to nationally aggregated information, Henry and
Lyle (2003) provided summary statistics for each of the states and territories. Also, as an
integral part of the NRFS project, a separate survey of indigenous fishing activity was conducted
in coastal communities across northern Australia (WA, NT and QLD) and the results were
included in Henry and Lyle (2003).
In the absence of plans to repeat the national survey, in 2007/08 Tasmania and South Australia
successfully conducted state-wide surveys to provide up-to-date ‘big-picture’ information on
recreational fishing. These surveys employed the same methodology as the NRFS – namely, a
telephone/diary survey of households that were randomly sampled from White Pages telephone
directories. However by design, the fishing activity of interstate or overseas visitors was
excluded in these surveys. Also, in most of these surveys, fishing-related expenditure
information was not collected in the diary phase. Similar state/territory-wide surveys have since
been conducted in other jurisdictions, along with large-scale surveys of recreational fishing
licence holders in Victoria and Western Australia.
In the 20 years prior to the NRFS, Fisheries NSW completed some 27 recreational fisheries
assessments, with the majority being on-site (or ‘creel’) surveys at various spatial and temporal
scales. These studies were focused on particular segments of the recreational fishery, with
most conducted at the individual estuary level, for example: Henry (1984); Scanes (1988);
Williams et al. (1993); and West and Gordon (1994). Several other studies were conducted on
larger spatial scales, including assessments of: the state-wide trailer-boat fishery in marine

West et al. NSW/ACT Recreational Fishing Survey – 2013/14
2 NSW Department of Primary Industries, December 2015
waters (Steffe et al.,1996a); estuarine fishing effort and shore-based marine fishing on the North
Coast (Coffs Harbour to Tweed Heads; Steffe et al., 1996b); the state-wide charter fishing
industry (Steffe et al., 1999). The temporal scales of these research projects ranged from a few
months to annual studies (and longer).
The NRFS in 2000/01 was the first assessment of the entire recreational fishery in NSW and
enabled comparisons of the various components of marine, estuarine and freshwater fisheries.
In the period since the NRFS, Fisheries NSW has conducted a variety of on-site surveys (a total
of 13 projects), including: an assessment of Recreational Fishing Havens (Steffe, 2005a; Steffe
et al., 2005b); a survey of Sydney Harbour (Ghosn et al., 2010); and a major two-year study of
two estuaries (Hawkesbury River and Port Hacking) and marine boat-fishing in the Greater
Sydney Region, i.e. from Newcastle to Shellharbour (Steffe and Murphy 2011). In addition to the
above research, several biological studies have been conducted in terms of various species of
importance to recreational fishing (Stewart et al., 2010; and Hughes et al., 2011). The impact of
‘catch and release’ practices in recreational fishing has also been assessed (Broadhurst et al.,
2012; and Butcher et al., 2012).
Developments since the NRFS
Developments in other Jurisdictions
After detailed analysis and assessment of NRFS data, several improvements have been made
to subsequent state/territory-wide surveys. Firstly, to reduce respondent burden and optimise
response rates, certain question areas were deferred from the initial screening survey (see
’Screening Survey’, Page 7) until later in the study, e.g. detailed boat profiling information is now
routinely collected in the Wash-up/Attitudinal Survey for the recreational fishing ‘fleet’ (see
‘Wash-up/Attitudinal Survey’, Page 9). However, other data elements have been totally
excluded, e.g. profiling the labour force status and educational qualifications of fishers. By
contrast, additional question areas have been included, e.g. routine assessment of the reasons
for releasing fish and other species during the 12 month diary phase. Another feature of these
surveys is the routine collection of detailed ‘fishing site’ information during the diary period (see
further discussion in ‘Fishing Zones’, Page 11).
Since the NRFS, major improvements in statistical analyses have also become available through
development of a customised analysis package, known as RecSurvey (Lyle et al., 2009a). This
analysis package has been employed in the analysis of all state/territory-wide, general
population surveys since the NRFS – including the current survey and all re-analyses of
comparable NRFS data.
Recent Development Work by Fisheries NSW
In addition to the extensive on-site surveys discussed in ’Background’ (Page 1), Fisheries NSW
recognised the need for updated state-wide data (as per the NRFS) and in 2010/11 undertook a
major development project to identify data needs and evaluate various options for this research.
The project also focused on independent validation and ‘future-proofing’ of the NRFS survey
methodology and this early groundwork has been acknowledged in a recent development project
for the design and conduct of regular national surveys. This latter project is being co-ordinated
by the federal government (ABARES), with inputs from all state/territory agencies and specialist
consultant staff (Georgeson et al., in press).
At the time of the NRFS, over 80% of all resident households in Australia had a White Pages
listed home telephone. However since then, the proportion of White Pages listed households is
believed to have continually declined and although no current data are available, anecdotal
information suggests a current national coverage level of less than 70%.
In the 2010/11 NSW development project, a dual-frame (or ‘hybrid’) survey design was identified
as a cost-effective solution to this coverage issue. By employing two sampling frames, namely

West et al. NSW/ACT Recreational Fishing Survey – 2013/14
3 NSW Department of Primary Industries, December 2015
White Pages directories and the NSW Recreational Fishing Fee (RFF) database, broader
coverage would be provided in terms of licensed vs. exempt fishers and White Pages listed vs.
unlisted fishers (i.e. through the White Pages and RFF frames, respectively). Other benefits of
this approach include improved overall data precision and significantly lower total costs
(primarily diarist recruitment costs), due to naturally higher fishing participation rates in the RFF
vs. White Pages sample frames. It was therefore decided to further develop the hybrid survey
methodology for use in the current survey, on the basis that the White Pages directories would
provide the ‘core’ sample frame and therefore direct comparability with NRFS data for NSW. It
was also decided to include residents of the Australian Capital Territory (ACT), to provide cost-
effective coverage of their fishing activity in both NSW and ACT waters.
The secondary sample frame for the hybrid survey was identified as the NSW RFF database.
However to optimise cost-effectiveness, this was confined to long-term (i.e. 1 or 3 year) licence
holders residing in NSW or the ACT. Note: after extensive analysis of NRFS data, it emerged
that resident households containing at least one long-term licence holder, were assessed as
accounting for: 59% of all recreational fishers in NSW; 71% of annual days fished; 79% of the
total catch of all species; and 82% of the total harvest.
Further analysis of NRFS data showed that significant levels of fishing activity in NSW waters
were attributable to Victorian residents – including a majority of the total catch and effort in the
River Murray, e.g. for Murray cod and other key species. Accordingly, to provide important
supplementary information in this regard, a third sample frame was included in the current
survey, namely Victorian residents with a long-term (1 or 3 year) licence from the NSW RFF
database.
As detailed in ‘Sample and Response Profiles’ (Page 15), various performance indicators (e.g.
sample sizes and response rates) clearly demonstrate the success of the various survey
components of these three sample frames.
However by design, virtually all results contained in this report refer to the ‘core’ White Pages
sample frame – primarily to facilitate analysis and review of comparable NRFS data. That is,
results from the hybrid survey component for NSW/ACT residents are the subject of separate
analysis and reporting. In fact, the scope of final development work for this analysis is likely to
be broadened to include other forms of dual-frame/hybrid surveys (e.g. the use of boat
registration databases in certain jurisdictions). This extension has arisen as part of the current
ABARES development project and various aspects of this work are currently being discussed.
Finally, analysis and reporting of results from the third sample frame (Victorian resident/licence
holders) will also be undertaken separately.
Important development work has also been undertaken by Fisheries NSW staff in terms of GIS
coding of the location of each fishing activity/event as recorded in these telephone/diary surveys,
i.e. to achieve high resolution data, namely the latitude and longitude for each fishing event.
This work and its successful application in the current survey are further discussed in ‘Fishing
Zones’ (Page 11).
Essentially the same telephone/diary methodology developed for the NRFS has been employed
for the current survey, thereby optimising comparability with information collected in 2000/01.
This information includes: state/territory-wide participation rates and demographic profiles of
recreational fishers; catch and effort estimates for key methods, regions and species; fishing
boat profiles; and fisher attitudes and opinions. Note: as for many other state/territory-wide
surveys since the NRFS, fishing-related expenditure information was not collected in the survey.
Important Notes to the Reader
The remainder of this report comprises detailed discussion of: study scope, definitions and other
methodological issues (see ‘Survey Methods and Analysis’, Page 6); sampling issues and
response (see ’Sample and Response Profiles’, Page 15); with substantive survey results in

West et al. NSW/ACT Recreational Fishing Survey – 2013/14
4 NSW Department of Primary Industries, December 2015
‘Fisher Characteristics’ (Page 19) and all subsequent sections of the report. In reviewing these
results, the following important aspects should be considered:
• firstly, as discussed in ’Recent Development Work by Fisheries NSW’ (Page 2), virtually
all results contained in this report refer to the ‘core’ White Pages sample frame to provide
optimum comparability with NRFS data. That is, results from parallel sampling of the
NSW RFF database will be analysed and reported separately;
• also, the scope of this report is confined to the resident population of NSW and the ACT
(aged five years and older) and the survey results are predominantly focused on fishing
activities in NSW/ACT waters (as further defined in ’Survey Scope’, Page 6). However,
interstate fishing activity by NSW/ACT residents was also assessed and relevant results
have been included where appropriate, e.g. participation levels and days fished on an
Australia-wide basis;
• in accordance with the agreed reporting structure, the survey results have generally been
presented without interpretation or commentary – unless such information refers to
important definitions or methodological issues;
• the study findings are often presented as detailed tabulations of ‘expanded’ data – i.e.
estimates based on relevant Australian Bureau of Statistics (ABS) benchmark data
(households, persons) and in turn, related fishing effort and catch. However where
appropriate, some results are presented in graphic form (namely, histograms/bar charts)
and in all such cases, relevant data tabulations have been included as appendices;
• within the various tables and appendices in the report, individual results have routinely
been rounded to whole integers and therefore, some row or column totals may not add
exactly (usually +/- 1). Also, in the text of the report, proportional results have generally
been reported as rounded/whole percentages (e.g. 24% of the total catch – as opposed
to 23.7%). Therefore, in some cases, the total reported percentages may not equal
100% (due to rounding). However, in all tables and appendices, percentages have been
reported at the single, decimal point level;
• in terms of ‘non-sample error’ (e.g. non-response and reporting biases), optimum data
quality has been achieved through a range of measures/outcomes in the study, including
excellent response rates in all survey components (see ’Sample and Response Profiles’,
Page 15). Despite this, minor adjustments/calibrations have been applied through the
RecSurvey analysis package, in accordance with routine procedures detailed in Lyle et
al. (2009a);
• in any sample survey, estimate precision is affected by ‘sample error’ – due to the fact
that sampling was employed, as opposed to a total enumeration (or census) of the
population concerned. To account for this, standard errors (SEs) have been calculated
through the analysis package and included in all substantive figures, data tabulations and
appendices. Also, in cases where the significance of a particular result or change has
been reported, 95% confidence limits have been routinely applied (i.e. the SE x 1.96);
• however, where high levels of variability occur or small sub-samples are involved, these
SEs can be quite large in relation to the estimates concerned. To highlight these, cases
where the relative standard error (RSE) is greater than 40% of the estimate have been
routinely shown in bold text. Similarly, estimates derived from less than 30 households
(in the raw data) have been italicised. Further details on this issue are discussed in
’Statistical Uncertainty’ (Page 14);
• for completeness, all survey estimates from the analyses have been included in the data
tabulations and appendices, including some very small estimates. Also, ‘zero’ estimates
can commonly occur in these tables and importantly, this does not imply no such

West et al. NSW/ACT Recreational Fishing Survey – 2013/14
5 NSW Department of Primary Industries, December 2015
occurrence in the population overall – rather, that none was detected within the limits of
the survey sample. Therefore, readers should routinely interpret such results as ‘nil or
negligible’; and
• a large number of data tabulations, figures and appendices have been included in this
report – along with substantially more analyses which have been provided separately, in
anticipation of requests for more detailed data. Also, the various survey databases are
an output requirement of the project and, subject to error tolerances, considerable further
interrogation can be undertaken.
Report Structure Acknowledgment
The current survey employed an almost identical methodology to all telephone/diary surveys
(using White Pages sampling) conducted in other jurisdictions since the NRFS. These studies
were also analysed using the RecSurvey analysis package and much of the content and
structure of the first Tasmanian report (Lyle et al., 2009b) has been applied to subsequent
reports in South Australia (Jones 2009) and the Northern Territory (West et al., 2012), by
agreement with the authors and with appropriate acknowledgment. Similarly, the content and
structure of this report has been largely adapted from the original Tasmanian report and
especially in terms of the presentation of survey results in ’Fisher Characteristics’ (Page 19) and
all subsequent sections of the report. The contribution of our co-authors in this respect (and
many others) is very much appreciated.

West et al. NSW/ACT Recreational Fishing Survey – 2013/14
6 NSW Department of Primary Industries, December 2015
Survey Methods and Analysis
Data collection for the survey was based on a telephone/diary approach – an off-site
methodology developed to provide cost-effective data over large spatial scales, such as an
entire state. A detailed description of the telephone/diary design philosophy and methodology is
provided in Lyle et al. (2002a) and Henry and Lyle (2003). Data analysis procedures are
described in detail by Lyle et al. (2009a) and have been undertaken using the statistical
computing language R (R Core Team, 2013). An overview of the survey methodology and data
analysis is provided below.
Survey Scope
The telephone-diary survey encompassed the private dwelling (PD), resident population of NSW
and the ACT, aged five years and older, and their recreational fishing activity. Note: PD
residents account for over 98% of the total resident population and by definition, non-private
dwellings (NPD) include: hotels, motels, hospitals, nursing homes, military barracks and gaols.
Recreational fishing was broadly defined as the capture (or attempted capture) of aquatic
animals in Australian waters (freshwater, estuarine and marine), other than for commercial
purposes. Also, traditional fishing was excluded from the scope. However, any recreational
fishing by indigenous residents or commercial fishers was included. All recreational fishing
techniques and harvesting activities were considered in-scope, including dive and hand
collection, the use of pots, nets and spears, as well as various forms of line fishing.
As for most state/territory-wide surveys since the NRFS, the activities of interstate residents in
NSW/ACT waters were considered out-of-scope. By contrast, the current survey has been the
first such study since the NRFS to collect detailed participation, effort and catch data for
interstate fishing activity by in-scope (i.e. NSW/ACT) residents. However, as noted in ‘Important
Notes to the Reader’ (Page 3), the results in this report are predominantly focused on fishing
activities in NSW/ACT waters.
Survey Methods
Survey Overview
The telephone-diary methodology involved a two-phase survey design, the principal components
being an initial screening phase to gather profiling information from a sample of the resident
population and a subsequent, intensive phase, in which respondents provided detailed catch
and effort information over a 12 month period. In this second phase, effectively a longitudinal
panel survey, respondents were encouraged to use a simple ‘diary card’ to record key fishing
data. Respondents were then contacted regularly by survey interviewers who were responsible
for collecting this information. The underlying design philosophy is focused on minimising
respondent burden and maximising response rates and data quality.
Additional survey components included a non-intending fisher follow-up survey and a wash-
up/attitudinal survey. The non-intending fisher ‘call-backs’ involved a sample of households that
had indicated at screening that no residents were likely to do any recreational fishing during the
diary period. This component was designed to identify and account for ‘unexpected fishing’ that
may have occurred during the diary period. Finally, the opinions and attitudes of diarists to
fishing-related matters were assessed at the end of the diary period in a ‘Wash-up’ survey, along
with detailed boat-profiling information.
Consultant staff of Kewagama Research had primary responsibility for the design, conduct,
processing and analysis of all survey components, along with ultimate reporting for the study.
However, effective liaison was maintained with Fisheries NSW staff throughout the project and
especially in terms of various technical and biological issues.

West et al. NSW/ACT Recreational Fishing Survey – 2013/14
7 NSW Department of Primary Industries, December 2015
Figure 1 Survey components diagram - Survey of Recreational Fishing in NSW/ACT, 2013/14
Screening Survey
The primary role of the screening interview was to collect profiling information for all household
members (e.g. sex and age group), as well as establishing eligibility to participate in the
following diary phase. Profiling information was important not only to characterise the sample
population, but also to examine issues relating to representation and response.
The Screening Survey was administered as a structured interview by telephone with a random
sample of NSW/ACT households. The White Pages telephone directories provided the sample
frame, with obvious business numbers, non-private dwellings and multiple listings removed. For
each selected listing/telephone number, the suburb was also noted enabling the selection to be
assigned to a Statistical Area, Level 4 (SA4) – an ABS classification used to define 10 residential
strata for the survey (see ’Sampling Strata’, Page 9). Stratified random sampling was

West et al. NSW/ACT Recreational Fishing Survey – 2013/14
8 NSW Department of Primary Industries, December 2015
undertaken with a higher sampling rate for those strata with smaller resident populations (e.g.
the North West stratum) and lower sampling rates for the larger strata (e.g. Sydney). Within
each stratum, care was taken to ensure that the proportional breakdown of the sample at the
SA3 level (within each SA4) aligned with the known proportion of private dwellings based on
ABS data. Note: in addition to landline numbers, 5% of selected listings included mobile
numbers. In order to minimise non-contacts, at least 15 calls were made to each ‘live’ telephone
number. Disconnected numbers, business and facsimile numbers were treated as sample loss
and not replaced. The Screening Survey was conducted from March to May 2013.
Within each responding household, the demographic profiles (age group and gender) of all usual
residents were obtained. For residents aged five years and older, involvement in recreational
fishing over the previous 12 months and likelihood (expectation) of doing any recreational fishing
in the following 12 months was established. All respondents who had fished during the 12
months prior to interview were asked whether they had fished interstate and to estimate how
many days they had fished in the previous 12 months, by category (< 5 days, 5-9 days, 10-14
days, 15-19 days and 20 days or more). This latter detail was used as an index of avidity, rather
than a direct or accurate measure of prior fishing activity, which allowed fishers to be broadly
classified as (e.g.) infrequent, occasional or frequent fishers. Boat ownership was also
established for all households, regardless of whether they contained fishers or not. All
households in which at least one member (regardless of prior fishing history) expressed a
likelihood of fishing during the following 12 months were considered eligible for the second
(diary) phase of the study.
Diary Survey
All households identified as eligible for the Diary Survey were invited to participate in this phase
of the study. Fishing activity of all household members aged five years and older was monitored
between 1 June 2013 and 31 May 2014. The approach taken in this survey differed to
conventional angler diary surveys in two important ways: first the diary was employed more as a
‘memory jogger’ than a logbook; and second, responsibility for data collection rested with the
survey interviewers and not the diarists. Typically, response rates from other forms of diary
survey (e.g. mail-back surveys) are low and data quality can suffer in terms of completeness,
accuracy and consistency. Also, since the burden of maintaining the diary rests with the
respondent, instructions may be misinterpreted and data may be incomplete or ambiguous. The
need to periodically remind respondents to submit documentation creates a further problem,
whereby information that has not been diarised must be collected on the basis of recall, if at all.
By contrast, the telephone-diary approach employed in the current study (a form of panel
survey), effectively transferred the burden of data collection from the respondent to the survey
interviewer. Data collection was undertaken by brief telephone interview in which trained
interviewers recorded details of any fishing that had occurred since the last contact. The level of
fishing activity determined the frequency of such contact, but as a general rule, respondents
were called at least once a month, even if no fishing was planned.
All diarists were sent a survey kit, which included the diary card, a colour species identification
guide and an official covering letter for the survey. After receiving this, data requirements were
then explained to respondents in a brief telephone interview and the next contact arranged.
Respondents were encouraged to record basic information in their diaries, such as date,
location, start and finish times, and catch and release numbers. More detailed data, such as
target species, fishing method, platform (boat or shore), water body type (river, lake, estuary,
coastal, or offshore), and reasons for releasing any part of the catch, were collected for each
individual fishing event and recorded during the telephone interview. In the early stages of the
diary period, interviews were completed very soon after any planned fishing activity to optimise
respondents understanding of survey requirements. Then, by maintaining regular contact
(usually within a couple of weeks of any fishing activity), details of any non-diarised fishing were

West et al. NSW/ACT Recreational Fishing Survey – 2013/14
9 NSW Department of Primary Industries, December 2015
obtained with minimal concern in relation to recall bias. Furthermore, this approach enabled
interviewers to immediately clarify any ambiguities and ensure completeness of information.
This in turn, provided for greater data utility, where for example, fishing effort could be
apportioned between target fisheries, methods, fishing platform, and so on.
Non-intending Fisher Follow-up Survey
The objective of this ‘call-back’ survey was to account for those persons who may have
unexpectedly ‘dropped-in’ to the fishery, providing symmetry for those persons who
unexpectedly ‘dropped-out’ of the fishery – namely, those diarists who did no fishing during the
diary period, despite intending to do so.
A random sample was drawn from all households (at screening) that had indicated no intention
to go fishing during the diary period and these were re-contacted shortly after the Diary Survey.
Whether any fishing had occurred during the diary period was established in a brief telephone
interview, with particular care to identify whether there had been a change in the household (e.g.
telephone number re-allocated) and also that household members were the same as those at
screening. Respondents who were identified as not being residents of the household at the time
of screening were excluded from the analysis.
Further details were collected from those households in which fishing was reported, including
demographic profile (age group and gender), whether individual members had fished in
NSW/ACT waters and/or interstate, the number of days fished during the 12 months of the diary
period (by ‘avidity’ category). Boat ownership and usage for recreational fishing during the diary
period were also assessed.
Wash-up/Attitudinal Survey
This survey was conducted with diarists at the end of the diary period and was designed to
assess a range of information, including confirmation of the completeness of the diary data for
each household member (whether they had reported fishing or not). Although boat ownership
was generally assessed for all households in the Screening Survey, detailed boat profiling
information (e.g. length, main propulsion method, usage for fishing and current market value)
was collected in the Wash-up Survey for boats owned by households reporting any fishing
activity during the diary period – to provide an assessment of the recreational fishing ‘fleet’.
The opinions and attitudes of diarists were also obtained in terms of various fishing-related
matters, from the main/key fisher in each household, aged 15 years and older. Several
‘structured’ question sequences from the NRFS were included here (e.g. assessment of
satisfaction with fishing in the diary period), along with a series of ‘un-structured’ questions to
gather respondents’ opinions on a variety of fishing-related issues (see further details in ’Other
Results: Wash Up/Attitudinal Survey’, Page 80).
Regions
Sampling Strata
Initial household selection (i.e. telephone listing/number) was based on a stratified random
sample design using the ten residential strata, aligning to ABS Statistical Areas (SA4 level) in
the Australian Standard Geography Standard, (ASGS) (Pink 2011), as follows:
1) Sydney: comprising fifteen SA4 codes: 102, plus 115 through to 128 (inclusive);
2) Hunter: SA4 codes 106 and 111;
3) Illawarra: SA4 codes 107 and 114;
4) Richmond/Tweed: SA4 code 112;
5) Mid North Coast: SA4 codes 104 and 108;

West et al. NSW/ACT Recreational Fishing Survey – 2013/14
10 NSW Department of Primary Industries, December 2015
6) Central West/North: SA4 codes 103 and 110;
7) North West: SA4 code 105;
8) South East: SA4 code 101;
9) South West: SA4 codes 109 and 113;
10) ACT: SA4 code 801.
In most cases, these residential strata align exactly with the strata employed in the NRFS.
However, due to changes in some ABS boundaries since then, minor differences have occurred
in boundaries between the Hunter and Mid North Coast strata, resulting in approximately 16,000
resident households (or 6% of the Hunter) now classified as Mid North Coast (i.e. formerly the
northern Hunter area, now the southern Mid North Coast). A similar boundary change occurred
between the North West and Central West/North strata, with approximately 8,000 households
(15%) from the North West (eastern side), now classified as the Central West/North stratum.
Importantly, due to the contiguous and homogeneous nature of the households involved in these
two boundary changes, no significant differences have been assessed in terms of various survey
results, i.e. when comparing NRFS data (using the ‘old’ geography) to 2013/14 data using either
the ‘old’ or the ‘new’ geography.
A map of residential strata for the current survey is shown in Figure 2 and all survey results
referring to area of residence have been expanded to population benchmarks and analysed on
this basis. Note: two detached areas comprise residential stratum 6, namely 6a Central West
and 6b North.
Figure 2 Map of NSW and the ACT, showing ABS-based, residential survey strata used for sample
stratification and population benchmarks.
7 North West
4
Richmond/
Tweed
5 Mid North Coast
2 Hunter
1 Sydney
3 Illawarra
8
South East
9 South West
6a Central West
6b
North
ACT 10

West et al. NSW/ACT Recreational Fishing Survey – 2013/14
11 NSW Department of Primary Industries, December 2015
Fishing Zones
During the Diary Survey, interviewers collected detailed information about each fishing activity
(event) to enable classification of the fishing site using a GIS coding system (i.e. latitude and
longitude). Depending on the types of fishing location, different information was obtained by
interviewers, e.g. (i) for offshore fishing, a reef name or the distance and direction offshore from
a coastal town or feature; (ii) for estuarine fishing, the fishing site and estuary name (e.g. ABC
Point in XYZ Lake); and (iii) for major rivers, the nearest town and river name.
As discussed in ’Recent Development Work by Fisheries NSW’ (Page 2), all related procedures
and coding systems were primarily developed by staff from Fisheries NSW. After extensive
testing and refinement, the methodology has now been successfully applied to the many
thousands of fishing events in the 2013/14 survey database for NSW/ACT waters.
The primary objective of this high-resolution, spatial classification system is to optimise flexibility
in regional coding for surveys of this kind. In fact, whereas regional analysis of the current
survey has been conducted on a comparable basis to the NRFS, major separate research work
has already been conducted using different regional coding (i.e. five coastal Bio-regions in
NSW). Importantly, due to the ‘big-picture’ nature of these surveys, this coding system should
not be used to focus in on any small areas – unless a relatively large amount of fishing activity
took place there and adequate data precision was achieved.
Although detailed catch and effort information can be provided from the current survey for all
NRFS fishing regions, major estuaries and rivers – for practical purposes, the results in this
report have been confined to nine* fishing zones (which are directly comparable with the NRFS
zones):
1) North Coast;
2) Mid North Coast;
3) Hunter;
4) Sydney;
5) Mid South Coast;
6) South Coast;
7) Murray/South West;
8) Darling/North West;
9) ACT.
* Note: Lord Howe Island comprises fishing zone 10. Although no fishing activity was reported
for this area by diarists in the White Pages sampling frame, several fishing events were reported
by diarists in the licence frame (RFF) component.
Other fishing location information was also collected in the Diary Survey in terms of water body
type: marine waters > or < 5kms from the coastline; estuarine waters; freshwater rivers; and
freshwater lakes/dams, public or private.
A map of the nine fishing zones is shown in Figure 3 and all results from the diary phase of the
survey have been routinely analysed on this basis.

West et al. NSW/ACT Recreational Fishing Survey – 2013/14
12 NSW Department of Primary Industries, December 2015
Figure 3 Map of NSW and the ACT showing fishing zones used for reporting fishing activities.
Fishing Effort
Fishing information was collected on an ‘event’ basis, where an event was defined as a discrete
fishing episode and the actual household member(s) involved in the event were recorded.
Separate fishing events were defined where there was a change in fishing region or water body
type, target species and/or fishing method. As a result, a day’s fishing trip could comprise more
than one event; e.g. fishers may gather bait prior to line fishing for flathead. Both the gathering
of bait and the subsequent fishing were considered to be separate events since the effort
expended in the capture of bait cannot be attributed to the capture of any flathead and vice
versa. Similarly, the use of passive fishing gear (such as crab pots) at the same time as line
fishing, were recorded as separate fishing events. The delineation of fishing activity in this
manner provided an ability to analyse effort (and catch) on the basis of fishing method and target
species/fishery. Furthermore, four measures of effort have been applied, namely the number of
fishers, fisher days (i.e. separate days on which some form of fishing was undertaken by a
fisher), fishing events and hours fished. However, fisher days has been used as the primary
measure of fishing effort in this report.
It should also be noted that person-based effort has been routinely calculated and included in
this report for all fishing methods. However, for passive fishing methods, the numbers of
pots/traps and nets were also recorded in the Diary Survey and this information is available in
the database for more detailed analysis of related fishing effort as required, e.g. the number of
pot/person days of effort.
Fishing Methods
A variety of fishing/harvesting methods were reported by diarists, but for most analysis
purposes, the following reporting categories have been defined: line fishing (bait and/or
North
Coast
Mid
North Coast
Hunter
Sydney
Mid South Coast
South Coast
ACT
9
8
Darling/North West
7
Murray/South West
1
2
3
4
5
6
L. Macquarie
Broken Bay
L. Illawarra
Jervis Bay
Twofold Bay
Tuross R.
Botany Bay
Tweed R.
Wallis L.
Myall L.

West et al. NSW/ACT Recreational Fishing Survey – 2013/14
13 NSW Department of Primary Industries, December 2015
lure/jig/fly lines); pot/trap (baited, passive use); net (including scoop and drag/seine nets); dive
collection (underwater spearfishing and hand collection by snorkel, scuba or hookah); and other
methods (e.g. other hand collection and the use of pumps and spades).
Catch
A Species Identification Guide including clear colour images was provided to all diarists to
optimise the accuracy of species identification in the survey. A key factor here is that the
resolution required for individual species must recognise the identification capabilities of fishers,
from a lowest-common-denominator perspective. Although excellent reporting accuracy can be
achieved at the species level in some instances (confirmed through on-site surveys – Lyle and
Campbell, 1999; Lyle et al., 2002b), species groupings were required where fishers could not
reasonably be expected to delineate particular species, even with the aid of the Species
Identification Guide. For example, iconic species such as Snapper were readily recognisable,
whereas identification to the species level for bream or leatherjackets was not always
achievable. On the other hand, three key species of flathead (Dusky, Sand and Tiger) were
shown to be readily identified by diarists, with the aid of the Species Identification Guide – where
differences in the tail colours/patterns were clearly depicted.
For the purpose of reporting catches, individual species (e.g. Dusky Flathead and Sand Whiting)
have been used in many cases, with species groups in other cases (e.g. bream and
leatherjackets) and broad taxonomic groupings required in some instances (e.g. sharks and
rays). However, certain species or species groups were represented by very few records,
making it necessary to pool these into broader taxonomic categories for analysis (principally,
‘Scalefish, other’). Complete details of all taxa reported in catches and the relevant catch
analysis groupings are provided in Appendix 2.
Catches were reported as numbers of individuals kept or harvested and numbers released or
discarded by species. In some cases (mainly prawns and shrimp), respondents reported
catches in units of weight or volume and these were converted to numbers by application of
mean weight estimates for these species.
Data Expansion and Analysis
Data Expansion
Data analysis was based on a stratified random survey design using single stage cluster
sampling – with the household representing the primary sampling unit (PSU) and residents
within the household, the secondary sampling unit (SSU). In determining household and
individual expansion factors, an integrated approach was applied that adjusted for non-response
and calibrated against population benchmarks (Lyle et al., 2009a).
Adjustment for non-response at screening was partly based on fishing propensity determined
amongst households that refused to complete the screening interview, but at least answered the
question about whether or not household members had fished in the previous 12 months.
However, no such adjustment was required for the non-contact group, for which no significant
differences have been assessed in terms of fishing propensity. This was achieved through
analysis of the response group and the number of calls required to complete the interview, i.e.
participation rates did not change as the number of required calls increased (up to 15). Previous
non-response assessments and follow-up surveys have also confirmed these findings.
Calibration against ABS-based benchmark data as at June 2013 was implemented for residents
in each stratum, taking account of household and person-based demographics. The population
benchmarks required for the various state/territory-wide surveys since the NRFS were not
routinely published (nor available from ABS) and were constructed by consultant staff, using
data provided by ABS in various forms – namely for the current survey:

West et al. NSW/ACT Recreational Fishing Survey – 2013/14
14 NSW Department of Primary Industries, December 2015
1) household and person estimates (by age group and sex) at the SA4 level for private
dwelling residents of NSW and the ACT, as at June 2011 (from customised tables
provided by ABS, based on the 2011 Census);
2) projected numbers of households as at June 2013 by state/territory and capital city
components from ABS publication, Catalogue No: 3236.0 (based on 2011 Census data
and published in March 2015);
3) changes in Estimated Resident Population (ERP) counts of persons (by age group and
sex) at the SA4 level for residents of NSW and the ACT, between June 2011 and June
2013 from ABS publications, Catalogue No’s: 3235.0 and 3101.0 (published in August
2014 and December 2014, respectively).
Using diary phase uptake and completion rates for eligible households, further non-response
adjustment was applied to expansion factors in calculating catch and effort information. This
adjustment was made sensitive to the avidity classification for the household (the maximum
avidity index for a member of the household determined at screening) and residential stratum.
Not all eligible fishers actually fished during the diary period and in the survey design these are
referred to as the unexpected ‘drop-outs’ from the fishery. In order to take account of
unexpected ‘drop-ins’ to the fishery, an additional adjustment was necessary and was based on
the Non-intending Fisher Follow-up Survey. This adjustment was made sensitive to the avidity
index reported for ‘drop-ins’ and residential stratum. A full account of the analytical process is
provided by Lyle et al. (2009a).
A final non-response adjustment was applied to expansion of results for the Wash-up/Attitudinal
Survey – despite very high response rates achieved among households completing the diary
phase. In the survey database and related outputs, this procedure has been referred to as the
Phase 3 calibration, with the screening and diary survey calibrations being Phases 1 and 2,
respectively.
Unless otherwise indicated, parameter estimates provided in this report are based on expanded
data, scaled-up to represent the population rather than the sample from which they were
derived.
Statistical Uncertainty
As discussed in ’Important Notes to the Reader’ (Page 3), all parameter estimates have some
statistical uncertainty and this can be expressed in terms of standard error (SE), which indicates
the extent to which the estimate might have varied from the true population value due to chance
and sampling of the population. There are about two chances in three (67%) that sample
estimates will vary by less than one SE and about 19 chances in 20 (95%) that the difference
from the true population value will be less than two SEs. It should be noted that as survey data
are disaggregated, for example by region or method, SEs expressed as a percentage of the
estimate (known as relative standard error or RSE) naturally increase and there may become a
point where the disaggregated estimates become unreliable.
In interpreting survey estimates, consideration needs to be given to: a) the magnitude of the
RSE; and b) the actual number of households that contributed records to the estimate.
Estimates with RSEs of 40% or greater (implying a 95% confidence range of around ± 80% or
higher) have been highlighted in the various tables and are regarded as imprecise. As a further
precaution, estimates derived from records involving fewer than 30 households have been
highlighted, since they may be particularly influenced by the activities of very few fishers.

West et al. NSW/ACT Recreational Fishing Survey – 2013/14
15 NSW Department of Primary Industries, December 2015
Sample and Response Profiles
Screening Survey
Table 1 provides a summary of the numbers of private-dwelling households in NSW and the
ACT as at June 2013 (based on customised ABS Census and ERP data), along with sampling
details and response profiles relating to the Screening Survey. Since sampling was undertaken
without replacement for sample loss (e.g. disconnected numbers, non-private dwellings, etc), the
net sample was reduced from a gross sample of 14,908 to 12,461 – of which 9,412 households
(75.5%) fully responded to the Screening Survey. Response rates were generally lower in the
more densely populated strata. Overall, information on recreational fishing and demographic
profiling was collected for 22,041 residents aged five years and older.
Among the 2,447 cases of sample loss (Table 1), the vast majority (1,993 or 81%) referred to
disconnected telephone numbers, i.e. numbers that remained disconnected for the three month
period of the Screening Survey. Other forms of sample loss were: 117 business-only numbers;
35 non-private private dwellings or holiday homes; 173 permanent fax/email lines; and 129 non-
functioning/’dead’ telephone lines.
Non-responding households (3,049 in Table 1) accounted for 24.5% of the net sample and are
dissected as follows: 523 full refusals (4.2%); 1,064 part refusals (8.5%); 1,267 full non-contacts
(10.2%); 191 language/communication difficulties (1.5%); and 4 others (<1%). As noted in ’Data
Expansion’ (Page 13), any uncertainty in terms of recreational fishing participation is limited to a
minority of the non-response group and predominantly, the full refusals where the participation
rates of the part refusals were applied by stratum, in the analysis.
Table 1 NSW/ACT private dwelling population (number of households) as at June 2013, sample
size and sample loss/response profiles for the Screening Survey, by stratum.
Although sampling of the NSW Licence Frame (RFF) is the subject of separate analysis and
reporting (as discussed in ‘Recent Development Work by Fisheries NSW’, Page 2), sampling
and response profiles for the Screening Survey of NSW/ACT residents are summarised as
follows: an initial sample of 1,634 households; 204 sample loss; 1,430 net sample; 149 non-
Residential stratum
1
Total
households
Initial
sample
Sample
loss
Net
sample
Non-
response
Full
response
Respons
e rate
Sydney
1,713,988
4,746
800
3,946
1,294
2,652
67.2%
Hunter
242,864
1,448
193
1,255
252
1,003
79.9%
Illawarra
170,498
1,188
189
999
235
764
76.5%
Richmond/Tweed
98,349
1,059
187
872
169
703
80.6%
Mid North Coast
143,945
1,009
154
855
121
734
85.8%
Central West/North
154,988
1,210
229
981
208
773
78.8%
North West
46,963
1,053
197
856
154
702
82.0%
South East
88,608
836
125
711
149
562
79.0%
South West
107,975
1,080
186
894
173
721
80.6%
ACT
145,347
1,279
187
1,092
294
798
73.1%
Total
2,913,525
14,908
2,447
12,461
3,049
9,412
75.5%
Note:
1
Defined according to ABS Statistical Areas (SA4 level) - see ’Sampling Strata’ (Page 9) and
Figure 2

West et al. NSW/ACT Recreational Fishing Survey – 2013/14
16 NSW Department of Primary Industries, December 2015
response; 1,281 full response; representing a response rate of 90%. Almost identical results
were achieved for the third sampling frame (i.e. Victorian residents in the NSW RFF) as follows:
an initial sample of 519 households; 67 sample loss; 452 net sample; 47 non-response; 405 full
response; representing a response rate of 90%.
Diary Survey
Table 2 summarises response profiles for the Diary Survey, with 2,008 households (21% of the
full response group at screening) identified as having at least one resident (aged five years and
older) with an intention to do some recreational fishing anywhere in Australia during the diary
period (June 2013 to May 2014). Of these eligible households, 1,802 (89.7%) agreed to take
part in the Diary Survey and among these, 1,681 (93.3%, or 83.7% among eligibles) fully
responded. Importantly, of the 121 households failing to complete the Diary Survey, only 11
declined to continue, 62 were ongoing non-contacts and the remaining 48 were disconnected
numbers or untraceable cases of re-locations.
In total, 1,681 NSW/ACT households, representing 4,433 residents aged five years and older,
completed the Diary Survey, with consistent response rates across all strata. Some 1,174 of
these households (70%) reported fishing activity during the diary period, comprising 2,028
fishers and a total of 11,801 person-based fishing events.
Overall, by comparison with other general population surveys and traditional mail-back diary
studies, the response rates achieved in all components of this study are exceptionally high and
provide an important performance indicator in terms of the efficacy of the survey instrument.
Table 2 Household response profiles for the Diary Survey, by stratum.
Residential
stratum
Full
response
at
screening
Eligible
for the
diary
survey
Diary
survey
uptake
Diary
survey
completed
Uptake
rate
(among
eligibles)
Completion
rate
(among
uptake)
Completion
rate
(among
eligibles)
Sydney
2,652
376
325
298
86.4%
91.7%
79.3%
Hunter
1,003
221
197
192
89.1%
97.5%
86.9%
Illawarra
764
201
182
173
90.5%
95.1%
86.1%
Richmond/Tweed
703
164
150
137
91.5%
91.3%
83.5%
Mid North Coast
734
187
172
164
92.0%
95.3%
87.7%
Cent. West/North
773
175
162
152
92.6%
93.8%
86.9%
North West
702
172
152
139
88.4%
91.4%
80.8%
South East
562
159
145
140
91.2%
96.6%
88.1%
South West
721
190
176
159
92.6%
90.3%
83.7%
ACT
798
163
141
127
86.5%
90.1%
77.9%
Total
9,412
2,008
1,802
1,681
89.7%
93.3%
83.7%
Comparable response profiles for sampling of the NSW Licence Frame (RFF) for the Diary
Survey of NSW/ACT residents are summarised as follows: 1,148 eligible households (90% of
1,281 fully responding at screening); 1,100 Diary Survey uptake; 1,019 Diary Survey completion;
representing a completion rate of 93% among the uptake group and 89% among eligible
households. A total of 810 households (79%) fished in the period, comprising 1,348 fishers
aged 5 years or more and a total of 10,497 person-based fishing events.
Equivalent results for the third sampling frame (i.e. Victorian residents in the NSW RFF) are as
follows: 373 eligible households (92% of 405 fully responding at screening); 345 Diary Survey
uptake; 310 Diary Survey completion; representing a completion rate of 90% among the uptake

West et al. NSW/ACT Recreational Fishing Survey – 2013/14
17 NSW Department of Primary Industries, December 2015
group and 83% among eligible households. A total of 262 households (85%) fished in the
period, comprising 452 fishers aged 5 years or more and a total of 3,965 person-based fishing
events.
Non-intending Fisher Follow-up Survey
Response rates for this ‘call-back’ survey are presented in Table 3. Close to one third of the
7,404 households that indicated no intention to do any recreational fishing during the diary
period were selected at random and were followed up at the end of the diary period, to ascertain
whether any unexpected fishing had occurred. When sample loss (disconnected numbers,
different households, etc) is taken into account, an overall response rate of 84.9% was achieved
for this component of the study, again with consistently high response rates across residential
strata. Non-responding households (330 in Table 3) accounted for 15.1% of the net sample and
are dissected as follows: 50 full refusals (2.3%); 94 part refusals (4.3%); 167 full or part non-
contacts (7.7%); and 19 others (0.9%, mainly language/ communication difficulties). Within the
response group, 57 households (around 3%) were established as being different households to
those at the time of screening and were therefore excluded from the analysis. Among the
remainder, 80 households (4%) reported that at least one member had done some
(‘unexpected’) fishing during the diary period.
Table 3 Sample size (households) and sample loss/response profiles for the non-intending fisher
follow-up survey, by stratum.
Residential stratum
Initial
sample
Sample
loss
Net
sample
Non-
response
Full
response
Response
rate
Sydney
728
72
656
121
535
81.6%
Hunter
257
19
238
34
204
85.7%
Illawarra
186
15
171
21
150
87.7%
Richmond/Tweed
173
15
158
18
140
88.6%
Mid North Coast
182
23
159
28
131
82.4%
Central West/North
197
18
179
20
159
88.8%
North West
175
24
151
18
133
88.1%
South East
133
16
117
13
104
88.9%
South West
177
14
163
19
144
88.3%
ACT
207
18
189
38
151
79.9%
Total
2,415
234
2,181
330
1,851
84.9%
Non-intending Fisher Follow-up Surveys were also conducted for Screening Survey respondents
from both NSW RFF sampling frames, i.e. for NSW/ACT residents and Victorian residents.
However, the total number of non-intending fisher households from these frames was just 165
(<10% of full response at screening) and this is typical of licence frame sampling, where
naturally high levels of ‘intention to fish’ occur. Nevertheless, a stratified random sample of 70
such households was selected, with 55 fully-responding – representing a response rate of 83%,
after exclusion of sample loss (4 households).
Wash-up/Attitudinal Survey
By design, all 1,681 households completing the Diary Survey were included in the sample. No
sample loss was encountered and 1,607 households fully responded to the survey (95.6%).
Consistent response rates were achieved by stratum, but with slightly higher response rates for
fisher households (96.2%) than for non-fisher households (94.3%).

West et al. NSW/ACT Recreational Fishing Survey – 2013/14
18 NSW Department of Primary Industries, December 2015
Non-response (74 households, 4.4%) is dissected as follows: 14 full or part refusals (0.8%); 38
full or part non-contacts, incl. several who had moved permanently overseas (2.3%); and 22
others (1.3%, mainly illness-related).
Very high response rates were also achieved for Wash-up/Attitudinal Surveys conducted among
diarists who completed the Diary Survey from both NSW RFF sampling frames – for
NSW/ACT residents, 98.1% of 1,019 diarist households and for Victorian residents, 97.1% of
310 households. Among the 28 non-responding households: 4 were full or part refusals; 16
were full or part non-contacts and the remainder were mainly illness-related.

West et al. NSW/ACT Recreational Fishing Survey – 2013/14
19 NSW Department of Primary Industries, December 2015
Fisher Characteristics
Information presented in this section is based on the Screening Survey and is reported as
expanded estimates, adjusted for non-response (after Lyle et al., 2009a) to represent the
resident population of NSW and the ACT aged five years and older, as at June 2013. Detailed
information about recreational fishing participation by age, gender and residential stratum is
provided in Appendix 1. Also, participation rates are provided in this report, i.e. where the
number of fishers is expressed as a percentage of the relevant population.
Fishing Participation
An estimated 849,249 (SE 27,639) NSW/ACT residents aged five years and older fished at least
once in Australian waters in the twelve months prior to June 2013, representing a participation
rate of 11.9% (SE 0.4%). The vast majority (98.5%) of these residents fished in NSW or ACT
waters during this time (836,632 residents; SE 27,456) representing a participation rate of 11.7%
(SE 0.4%). The remainder of this section focuses on this latter group, namely residents who
fished in NSW or ACT waters. While close to half (45%) of all recreational fishers resided in the
Sydney residential stratum, this also represented the lowest participation rate (8.6%; SE 0.5%)
(Figure 4). Participation rates in other strata ranged from 11.6% (SE 1.1%) in the ACT up to
20.7% (SE 1.9%) in the South East.
Figure 4 Estimated number (A) and proportion (B) of the NSW/ACT resident population aged five
years and older who fished recreationally in NSW or the ACT in the 12 months prior to
June 2013 by stratum. Error bars represent one standard error and the dotted line
represents the participation rate for NSW/ACT as a whole.
A
B

West et al. NSW/ACT Recreational Fishing Survey – 2013/14
20 NSW Department of Primary Industries, December 2015
Age and Gender
Recreational fishing was more popular among males, with a participation rate of 16.9% (SE
0.5%) compared with 6.6% (SE 0.3%) for females who fished in NSW or the ACT during the 12
months prior to June 2013 (Appendix 1). By numbers, 2.5 times as many males (597,270; SE
19,265) than females (239,361; SE 11,880) fished during that time. The predominance of males
involved in fishing, by number and participation rate, was evident across all age groups (Figure
5) and also by region of residence (Appendix 1).
In terms of age groups, the highest number of recreational fishers occurred in the 30-44 years
age group (217,639 persons; SE 11,493), with the lowest number in the 60 years plus age group
(101,659 persons; SE 5,386). The highest participation rate occurred in the 5-14 years age
group (19.6%; SE 1.1%), with the lowest rate in the 60 years plus age group (6.7%; SE 0.4%).
Also, when age group and gender are considered, the highest participation rate occurred among
males in the 5-14 years age group (24.0%; SE 1.5%), with the lowest rate among females in the
60 years plus age group (2.5%; SE 0.3%)
Figure 5 Estimated number (A) and proportion (B) of the NSW/ACT resident population aged five
years and older who fished recreationally in NSW or the ACT in the 12 months prior to
June 2013 by age group and gender. Error bars represent one standard error.
A
B

West et al. NSW/ACT Recreational Fishing Survey – 2013/14
21 NSW Department of Primary Industries, December 2015
Fishing Effort
In this section, the fishing activities of respondents during the Diary Survey have been reported
as expanded estimates, adjusted for non-response (after Lyle et al., 2009a) to represent the
resident population of NSW and the ACT aged five years and older (as at June 2013) and their
fishing activities during the period June 2013 to May 2014.
Fishing effort can be expressed in various ways, including: the number of persons who fished at
least once; the total number of person days spent fishing (fisher days); actual time spent fishing
(fisher hours); or as fishing events (as defined in ‘Fishing Effort’, Page 12). However, ‘fisher
days’ has been the primary metric used in this section and various analyses have been included
in terms of fishing location (zone and water body type), fishing method, fishing platform and
seasonality.
Overview
An estimated 758,716 (SE 32,027) NSW/ACT residents aged five years and older fished at least
once in Australian waters during the 12 month diary period, representing a participation rate of
10.6% (SE 0.4%). The vast majority (97.3%) of these residents fished in NSW or ACT waters
during this time (738,447 residents; SE 31,494) representing a participation rate of 10.3% (SE
0.4%). Note: these estimates are based on resident population benchmarks as at June 2013 (as
for the Screening Survey), but are not directly comparable with results in ’Fisher Characteristics’
(Page 19) for several reasons. For example, population changes have not been accounted for
during the diary period and different reporting methods for fishing activity applied in the
Screening Survey (i.e. a recall basis), as opposed to the Diary Survey (i.e. longitudinal/diary
data).
The remainder of this section focuses on the fishing activities of residents who fished in NSW or
ACT waters during the diary period. However, comparable database information for interstate
fishing activities by NSW/ACT residents is also available for other jurisdictions (subject of
course, to standard error tolerances).
The estimated 738,447 NSW/ACT residents aged five years and older fished a total of 3,181,035
days during the 12 month period, at an average of 4.3 days per fisher. Overall, 27% of fishers
fished at least once in freshwater, while 84% fished at least once in saltwater – with 21% of the
effort (fisher days) in freshwater and 79% in saltwater (Table 4).
Table 4 Estimated number of persons and days fished by NSW/ACT residents aged five years and
older who fished in freshwater or saltwater in NSW or the ACT during 2013/14. SE is
standard error.
Freshwater
Saltwater
Total
Effort Number SE Number SE Number SE
Persons 200,705 12,772 618,934 30,511 738,447 31,494
Fisher days 656,831 50,208 2,525,499 156,151 3,181,035 169,699
The majority (79%) of fishers reported fishing on 5 or less days in NSW/ACT waters during the
diary period (2013/14), with a further 13% fishing 6-10 days, 4% reporting 11-15 days and
slightly more than 1% reporting 16-20 days (Figure 6). Only 2% of fishers reported more than 20
days of fishing in the period. The highly skewed nature of fishing activity is further emphasised
when individual fishers are ranked in order of their annual fishing effort (fisher days) and the
cumulative effect of adding each fisher’s effort to the progressive total is assessed (Figure 7).

West et al. NSW/ACT Recreational Fishing Survey – 2013/14
22 NSW Department of Primary Industries, December 2015
This analysis revealed that 20% of fishers accounted for almost 60% of the total fishing effort.
Such a relationship is very common in other recreational fisheries and highlights the fact that a
relatively small number of recreational fishers have a disproportionately large impact in terms of
total effort and catch. Thus, minor shifts in the dynamics of participation (based on activity
levels) at the upper end of the fishery can be expected to have significant implications on effort
(and catch) levels on a state/territory-wide basis.
Figure 6 Distribution of fishing effort by annual days fished for the NSW/ACT resident population
aged five years and older who fished recreationally in NSW or the ACT during 2013/14.
Figure 7 Relationship between the number of fishers and their cumulative fishing effort (days
fished) for NSW/ACT residents aged five years and older who fished recreationally in
NSW or the ACT during 2013/14. Dotted lines indicate that 80% of the fishers accounted
for just over 40% of the total days fished.
0
10
20
30
40
50
60
70
80
1-5 6-10 11-15 16-20 21-25 26-30 >30
% fishers
Days fished
0
20
40
60
80
100
0 20 40 60 80 100
Cumulative number fishers (% total)
Cumulative effort (% total days fished)

West et al. NSW/ACT Recreational Fishing Survey – 2013/14
23 NSW Department of Primary Industries, December 2015
Water Body
The vast majority (79%) of recreational fishing activity in NSW and the ACT was concentrated in
marine waters – with estuaries accounting for over half (56% or 1,795,958 fisher days) of the
total effort, followed by inshore waters (< 5km from the coastline – 22% or 695,542 fisher days)
and offshore waters (> 5km – <2% or 54,773 fisher days) (Figure 8, Appendix 6). Fishing in
freshwater represented around 21% of total fishing effort (660,623 fisher days) – of which, more
than half occurred in rivers (359,490 fisher days), as opposed to lakes and dams (300,533 fisher
days).
Note: estuaries within NSW waters were defined according to Roy et al. (2001). This
classification system includes several large ocean embayments or semi-enclosed bays that are
characterized by marine waters with little fresh water inflow, e.g. Botany Bay, Jervis Bay,
Batemans Bay and Twofold Bay. Also estuaries such as the Hawkesbury River, Port Jackson
and Port Hacking have large entrances and tidal ranges making conditions in these areas similar
to the open ocean. There are strong links between the fauna of estuaries and inshore marine
waters, hence many apparently ‘marine’ species are commonly found within NSW estuaries.
Figure 8 Fishing effort (fisher days) by water body type for the NSW/ACT resident population aged
five years and older who fished recreationally in NSW or the ACT during 2013/14. Error
bars represent one standard error.
Fishing Platform
Overall, the majority (75%) of recreational fishers fished at least once from the shore during the
diary period, accounting for 59% of total fisher days during 2013/14 (Appendix 10) – with shore-
based fishing dissected as follows: estuaries at 31% of total effort, followed by inshore waters
(14%), then freshwater areas (12% in total) (Figure 9).
Shore-based fishing was also classified in terms of natural structures (e.g. beach, rocks and
river banks) and man-made structures (e.g. jetties, bridges, dam walls and breakwaters). A
majority of shore-based effort in the diary period occurred from natural shore areas (79%) as
opposed to man-made structures (21%) (Figure 10) – with very high proportions of natural shore
fishing in freshwater areas (98%) and ocean waters (93%), as opposed to estuarine waters
(65%) where man-made platforms are generally more common. Also, a further dissection of all
natural shore-based activity for ocean waters showed that a majority occurred on ocean
beaches (294,144 fisher days; SE 25,972), as opposed to rock fishing (135,045 fisher days; SE
25,972).

West et al. NSW/ACT Recreational Fishing Survey – 2013/14
24 NSW Department of Primary Industries, December 2015
Over half (53%) of recreational fishers also fished at least once from a boat during the diary
period, accounting for 43% of total fisher days during 2013/14 (Appendix 10) – with boat-based
fishing dissected as follows: estuaries at 25% of total effort, followed by ocean waters (offshore
and inshore, 9% in total), then freshwater areas (8% in total) (Figure 9). Privately-owned boats
accounted for the vast majority (92%) of all boat-based fishing effort (fisher days), with hire boats
over 5% and charter boats 2%.
Figure 9 Fishing effort (fisher days) by water body type and fishing platform for the NSW/ACT
resident population aged five years and older who fished recreationally in NSW or the
ACT during 2013/14. Error bars represent one standard error.
Figure 10 Shore-based fishing effort (fisher days) by water body and shore type (natural or man-
made) for the NSW/ACT resident population aged five years and older who fished
recreationally in NSW or the ACT during 2013/14. Error bars represent one standard
error.
0
200
400
600
800
1000
1200
Offshore Inshore Estuary River Lake/dam
Fisher days (x000)
Boat
Shore
0
100
200
300
400
500
600
700
800
Ocean Estuary Freshwater
Fisher days (x000)
Natural
Manmade

West et al. NSW/ACT Recreational Fishing Survey – 2013/14
25 NSW Department of Primary Industries, December 2015
Fishing Method
Line fishing was by far the most common method used, with 99% of all NSW/ACT fishers using
lines (bait and/or artificial lures and jigs) at least once during 2013/14, accounting for 93% of all
fisher days (Figure 11, Appendix 8). Line fishing with bait accounted for a majority (71%) of all
fisher days, with lure and jig fishing at 22% of the total. Of the remainder, other/hand-collecting
methods accounted for 3% of all fisher days, followed by pot/trap fishing (2%), diving methods
(1%) and various types of net (mainly scoop nets) (1%).
Figure 11 Fishing effort (fisher days) by fishing method for the NSW/ACT resident population aged
five years and older who fished recreationally in NSW or the ACT during 2013/14. Error
bars represent one standard error.
Fishing Zones
The vast majority of fishing effort (84% of total fisher days) occurred in the six coastal fishing
zones, each of which ranges from the EEZ boundary in ocean waters through to estuarine and
freshwater catchments on the eastern side of the Great Dividing Range (Figure 12 and
Appendix 13). Among these zones, the Mid South Coast accounted for the highest proportion
(22%) of total fisher days, followed by Sydney (19%), the Hunter (15%), Mid North Coast (14%),
North Coast (10%) and South Coast (4%). Among the inland fishing zones, the Murray/South
West accounted for 10% of total fisher days, followed by the Darling/North West (6%) and the
much smaller ACT (<1%). Note: these areas are defined in ‘Fishing Zones’ (Page 11), along
with a detailed map in Figure 3.
0
500
1000
1500
2000
2500
3000
3500
Line Pot/trap Net Dive Other
Fisher days (x000)

West et al. NSW/ACT Recreational Fishing Survey – 2013/14
26 NSW Department of Primary Industries, December 2015
Figure 12 Fishing effort (fisher days) by fishing zone for the NSW/ACT resident population aged five
years and older who fished recreationally in NSW or the ACT during 2013/14. Standard
errors (SEs) are provided in Appendix 13.
Seasonality of Fishing Activity
The summer period (December 2013 to February 2014) accounted for a third (33%) of total
fishing days in the diary period, followed by autumn (March to May 2014 – 25%), spring
(September to November 2013 – 23%) and winter (June to August 2013 – 19%) (Figure 13,
Appendix 12). Also, holiday periods within each season had a notable impact, where 48% of all
fisher days in summer occurred in January, 49% of autumn fisher days in April, but to a lesser
extent in spring and winter (37% for both September and July, respectively) (Figure 14).
Figure 13 Fishing effort (fisher days) by season for the NSW/ACT resident population aged five
years and older who fished recreationally in NSW or the ACT during 2013/14. Error bars
represent one standard error.
10%
14%
15%
22%
19%
4%
6%
<1%
10%
0
200
400
600
800
1000
1200
Winter Spring Summer Autumn
Fisher days (x000)

West et al. NSW/ACT Recreational Fishing Survey – 2013/14
27 NSW Department of Primary Industries, December 2015
Figure 14 Fishing effort (fisher days) by month for the NSW/ACT resident population aged five years
and older who fished recreationally in NSW or the ACT during 2013/14. Error bars
represent one standard error.
2013 2014

West et al. NSW/ACT Recreational Fishing Survey – 2013/14
28 NSW Department of Primary Industries, December 2015
Catch
In this section, catches by respondents during the Diary Survey are reported as expanded
estimates, adjusted for non-response (after Lyle et al., 2009a) of the numbers of aquatic
organisms taken by the resident population of NSW and ACT aged five years and older (as at
June 2013), from their recreational fishing activity during the period June 2013 to May 2014.
Catches have been analysed in terms of: the numbers kept and released; the reasons for
release; species targeting; the location of the fishing activity (water body type); fishing method
and fishing platform. Also, some 23 species/groups have been separately assessed in ’Key
Species’ (Page 40), with details for the various fishing zones provided in ’Regional Fisheries’
(Page 64).
Recreational fishers captured a diverse range of scalefish, elasmobranchs (sharks and rays),
crustaceans, molluscs, and other taxa. A detailed listing of some 132 species and species
groupings is provided in Appendix 2. However, for effective analysis and reporting, some
species have been grouped (typically at the family level) – in recognition that fishers could not
reasonably be expected to delineate to the species level due to taxonomic similarities, and also
in cases where particular species were rarely reported. For practical purposes, most analyses in
this section refer to 45 key species/groups and a listing of the taxa that comprise each of these
groups is provided in Appendix 2.
Total Catch, Harvest and Release
For recreational fisheries assessment, total catch is generally divided into the component that is
kept or harvested (i.e. not returned to the water) and that which is released (i.e. returned to the
water whether alive or not). The harvested component may be used for a variety of purposes,
most commonly for consumption or for use as bait. The reasons for releasing or discarding
catch may include adherence to regulations (e.g. size and bag limits), ethical reasons (e.g. catch
and release fishing) or undesirability (e.g. poor eating quality, damaged or diseased). Catch
estimates are provided in detail in Appendix 2 and for the key species/groups in Table 5. Note:
a standard format for catch results has been applied throughout this report, namely where the
total catch (kept and released) is reported first, followed by the harvest/kept component, then the
released component (see Table 5).
All catch estimates in this report refer to fishing activity by residents in NSW and ACT waters
during the diary period. However, comparable database information for interstate fishing
activities by NSW/ACT residents is available for other jurisdictions (subject of course, to
standard error tolerances).
Overall, an estimated total catch of 14,059,634 organisms occurred in NSW/ACT waters, where
more than half (7,843,644) were retained and the remainder (6,215,990) were released or
discarded. Fish (scalefish, sharks and rays) dominated the catch, accounting for 75% of the
total numbers (10,562,697), followed by crustaceans (2,988,026), worms (262,178) cephalopods
(136,363), molluscs (109,295) and other taxa (1,074).
Among the saltwater finfish species, bream was the most common species group caught by
NSW/ACT recreational fishers, with an estimated total catch of 2,205,656. Flathead species,
(Dusky, Sand and Tiger) accounted for a similar total (2,103,835), followed by Snapper
(755,350), the whiting species (Sand, School and Trumpeter – 733,620), Luderick (428,213) and
Tailor (363,147). Apart from ‘Other small baitfish’, the estimated total catch for every other
saltwater finfish species/group did not exceed 200,000 for the 12 month period (Table 5).
In terms of freshwater finfish species, European Carp (500,164) dominated the total catch,
followed by Australian Bass (195,802), Murray Cod (165,557), trout (Brown and Rainbow –
157,975), with Golden Perch and Redfin Perch at slightly lower levels (Table 5).

West et al. NSW/ACT Recreational Fishing Survey – 2013/14
29 NSW Department of Primary Industries, December 2015
The non-fish species component of the total catch was dominated by crustaceans and in
particular, the smaller species such as saltwater nippers (a popular bait – 1,415,852), followed
by saltwater prawns (728,843) and freshwater shrimp (409,711). Among the larger crustaceans,
freshwater yabbies (275,108) dominated the catch, followed by Blue Swimmer Crabs (73,501),
Mud Crabs (48,634) and rock lobsters (26,507). Excluding key bait species, such as Pipis and
worms, the remainder of the non-fish species catch was mainly the various squid species
(111,799) (Table 5).
In total, 4,629,189 finfish were retained, indicating a harvest rate of less than half (44%) of the
total catch. Among saltwater finfish, the flathead group dominated the retained catch (961,344),
followed by bream (614,434), the whiting species (376,044), ‘Other small baitfish’ (313,551),
Luderick (250,074), Tailor (189,614) and Snapper (185,590). European Carp (498,735)
dominated the retained catch of freshwater finfish, followed by trout (107,819) and Golden Perch
(76,529) (Table 5).
Among other key taxa, significant numbers of freshwater yabbies (239,938) were harvested,
followed by squid (105,308), Blue Swimmer Crabs (50,637), Mud Crabs (30,052), rock lobsters
(23,216) and abalone (18,423). Among the smaller species, such as nippers, prawns, shrimp
and worms, substantial numbers were harvested during the 12 month period (Table 5).
Overall, 5,933,508 finfish were released, representing a majority (56%) of the total catch, with
varying release rates depending upon species (Table 5). The highest rates of release (>75%)
were evident for species such as Australian Bass, Mulloway, Murray Cod, Red Rock Cod,
sharks and rays, Snapper and wrasse/gropers (Table 6). The lowest rates of release (<25%)
occurred for Blue Mackerel, European Carp, tunas, Trumpeter Whiting, rock lobster, prawns,
shrimp, freshwater yabbies, squid and abalone (Table 6).
Note: in Table 5 overleaf, the 45 key species/groups have been presented in order of: (i) key
saltwater finfish species/groups, including sharks and rays; then (ii) other saltwater finfish
predominantly used as bait; (iii) key freshwater finfish species; (iv) scalefish, other – all other
saltwater and freshwater finfish species (see Appendix 2); (v) crustaceans; (vi) cephalopods; (vii)
molluscs; (viii) worms; and (ix) other taxa.

West et al. NSW/ACT Recreational Fishing Survey – 2013/14
30 NSW Department of Primary Industries, December 2015
Table 5 Annual catch (total, kept and released numbers) and proportion released of key species in
NSW/ACT waters during 2013/14, by residents aged five years and older. SE is standard
error; values in bold indicate relative standard error > 40%; values in italics indicate fewer
than 30 households recorded catches of the species.
Total
Kept
Released
%
Species/group
Number
SE
Number
SE
Number
SE
released
Bream
2,205,656
299,714
614,434
107,686
1,591,221
246,909
72.1
Flathead, Dusky
1,058,613
132,768
481,164
63,864
577,448
82,707
54.5
Flathead, Sand
962,892
181,433
440,763
98,777
522,129
89,480
54.2
Flathead, Tiger
82,330
31,558
39,417
14,738
42,913
19,117
52.1
Leatherjacket
116,622
26,752
71,269
21,133
45,353
11,091
38.9
Luderick
428,213
186,579
250,074
102,050
178,139
90,456
41.6
Mulloway
111,573
35,512
21,361
4,481
90,211
34,588
80.9
Red Rock Cod
151,531
34,435
6,430
3,022
145,100
33,952
95.8
Salmon, Australian
144,706
27,036
73,535
17,779
71,171
17,321
49.2
Sharks and rays
108,938
19,326
5,282
1,464
103,656
18,959
95.2
Silver Trevally
87,501
23,509
49,081
17,410
38,420
8,952
43.9
Snapper
755,350
144,387
185,590
29,943
569,760
135,449
75.4
Swallowtail Dart
118,935
39,889
43,275
18,872
75,661
25,676
63.6
Tailor
363,147
59,901
189,614
40,826
173,533
32,817
47.8
Tunas
57,047
28,585
46,333
24,191
10,714
4,953
18.8
Whiting, Sand
568,827
111,478
247,470
56,795
321,357
68,607
56.5
Whiting, School
11,807
4,278
4,995
2,078
6,813
2,645
57.7
Whiting, Trumpeter
152,986
104,916
123,580
100,107
29,406
18,174
19.2
Wrasse/gropers
111,800
34,111
19,303
6,674
92,497
32,607
82.7
Yellowtail Kingfish
96,115
29,791
35,134
13,720
60,981
22,968
63.4
Blue Mackerel
137,119
37,988
125,129
37,285
11,990
3,785
8.7
Mullet
98,859
26,572
71,725
21,899
27,134
11,388
27.4
Yellowtail Scad
143,230
41,272
90,182
33,361
53,048
19,684
37.0
Other small baitfish
318,010
150,408
313,551
150,072
4,459
3,320
1.4
Australian Bass
195,802
62,660
11,305
3,690
184,497
60,569
94.2
European Carp
500,164
84,945
498,735
84,914
1,428
1,074
0.3
Golden Perch
142,601
18,752
76,529
11,117
66,072
10,703
46.3
Murray Cod
165,557
29,865
20,816
4,383
144,741
28,013
87.4
Redfin Perch
136,279
52,588
44,426
14,649
91,853
47,557
67.4
Trout
157,975
38,760
107,819
32,450
50,156
10,846
31.7
Scalefish, other
872,515
108,496
320,868
52,788
551,647
70,964
63.2
Blue Swimmer Crab
73,501
20,944
50,637
14,220
22,864
9,014
31.1
Mud Crab
48,634
14,075
30,052
8,865
18,582
6,325
38.2
Rock lobster
26,507
14,273
23,216
12,501
3,291
2,798
12.4
Prawns (saltwater)
728,843
426,343
724,756
426,343
4,087
2,861
0.6
Shrimp (freshwater)
409,711
148,424
330,025
108,398
79,686
62,268
19.4
Nippers (saltwater)
1,415,852
403,605
1,319,066
367,909
96,787
71,069
6.8
Yabbies (freshwater)
275,108
92,992
239,838
89,047
35,270
18,012
12.8
Crustaceans, other
9,870
6,616
9,048
6,576
821
587
8.3
Squids
111,799
53,498
105,308
51,757
6,491
4,737
5.8
Cephalopods, other
24,564
14,173
13,136
9,871
11,428
4,889
46.5
Abalone
18,843
11,735
18,423
11,718
421
413
2.2
Pipis
90,452
31,719
87,760
31,272
2,692
2,653
3.0
Worms
262,178
94,992
262,178
94,992
0.0
Other taxa
1,074
1,004
1,013
1,002
62
61
5.7

West et al. NSW/ACT Recreational Fishing Survey – 2013/14
31 NSW Department of Primary Industries, December 2015
Table 6 Comparative summary of the proportion of the total catch of key species in NSW/ACT
waters during 2013/14 that was released by residents aged five years and older.
Proportion released
> 75%
51-75%
25-50%
< 25%
Australian Bass
Bream
Golden Perch
Blue Mackerel
Mulloway
Flathead, Dusky
Leatherjacket
European Carp
Murray Cod
Flathead, Sand
Luderick
Tunas
Red Rock Cod
Flathead, Tiger
Mullet
Whiting, Trumpeter
Sharks and rays
Redfin Perch
Salmon, Australian
Rock lobster
Snapper
Swallowtail Dart
Silver Trevally
Prawns (saltwater)
Wrasse/gropers
Whiting, Sand
Tailor
Shrimp (freshwater)
Whiting, School
Trout
Yabbies (freshwater)
Yellowtail Kingfish
Yellowtail Scad
Abalone
Blue Swimmer Crab
Squids
Mud Cab
Reasons for Release
The reasons why fish and other species are released cover a range of factors and motivations.
To assess this issue, respondents were asked (through careful, ‘neutral’ questioning) their
reasons for release and the numbers of each species, to which the particular reason applied for
each fishing event. This approach recognised that different reasons can apply to the numbers
released of a given species in a fishing event. Based on terminology used by the respondent,
the following release categories were identified and applied: ‘too small’ – that is, too small to be
retained (but not necessarily due to size limit regulations); ‘undersized’ – implying some
knowledge and adherence to size limit regulations; ‘too many’ – that is, in excess of personal
needs (but not necessarily due to bag limits); ‘over bag limit’ – implying some knowledge and
adherence to bag/possession limit regulations; ‘catch and release’ – a voluntary release ethic
associated with sportfishing (with no inference about fish size); ‘berried female’ – any egg-
bearing female crabs or other crustaceans; ‘unwanted’ – cases where the species was
considered by the respondent to be poor eating quality, including toxic/poisonous species (e.g.
toads and pufferfish). ‘Other’ reasons for release include: damaged; personal conservation of
certain species; and ‘too few’ – cases where the respondent was not catching enough (to keep
any at all). Note: by definition, any release of prohibited or threatened species was routinely
classified as ‘over the bag limit’ (i.e. a bag limit of zero).
Analysis of reasons for release for key species groups is presented in Table 7. Small size
(either ‘too small’ or ‘under-sized’), was the primary reason for release for over two-thirds of all
species groups and especially for major ‘table’ species, such as bream, flathead, whiting, key
freshwater finfish, various crustaceans and squid. Large catches (‘too many’ or ‘over bag limit’)
were the primary release reason for freshwater shrimp and various small bait species. ‘Catch
and release’ emerged as the primary release reason for Australian Salmon, and Australian Bass,
with ‘un-wanted’ the main reason for Red Rock Cod, sharks and rays and various other
scalefish.

West et al. NSW/ACT Recreational Fishing Survey – 2013/14
32 NSW Department of Primary Industries, December 2015
Table 7 Reasons for release - proportions (%) of total numbers of key species released in
NSW/ACT waters during 2013/14, by residents aged five years and older. Values in bold
indicate relative standard error > 40%; values in italics indicate fewer than 30 households
recorded catches of the species.
Total
number
released
Reason for release (%)
Species/group
Too
small
Under-
sized
Too
many
Over
bag
limit
Catch
&
release
Berried
female
Un-
wanted
Other
Bream
1,591,221
40.0
42.0
2.3
14.3
1.3
0.1
Flathead, Dusky
577,448
33.9
44.2
4.3
3.7
11.2
1.8
0.8
Flathead, Sand
522,129
35.7
58.4
1.5
0.3
3.8
0.3
0.1
Flathead, Tiger
42,913
15.1
70.6
13.0
1.3
Leatherjacket
45,353
29.9
31.9
1.2
1.9
35.2
Luderick
178,139
14.6
68.1
14.6
2.1
0.5
Mulloway
90,211
34.6
46.7
5.4
12.0
1.1
Red Rock Cod
145,100
9.8
12.2
0.0
2.4
75.6
Salmon, Australian
71,171
4.9
21.7
12.3
2.0
40.2
18.7
0.2
Sharks and rays
103,656
7.8
0.9
0.9
0.2
18.1
72.2
Silver Trevally
38,420
14.5
35.8
17.4
5.2
10.1
17.0
Snapper
569,760
43.1
52.0
2.3
0.2
2.1
0.2
Swallowtail Dart
75,661
35.3
13.6
22.2
0.6
28.3
Tailor
173,533
33.2
40.8
8.1
1.3
13.8
2.7
0.1
Tunas
10,714
3.5
45.8
33.6
8.8
8.3
Whiting, Sand
321,357
31.4
53.2
1.6
13.2
0.3
0.2
Whiting, School
6,813
32.3
67.7
Whiting, Trumpeter
29,406
48.5
50.6
0.9
Wrasse/gropers
92,497
5.3
37.0
4.0
0.3
11.7
41.7
Yellowtail Kingfish
60,981
29.1
68.8
0.3
1.2
0.5
Blue Mackerel
11,990
9.9
11.2
42.2
7.9
28.8
Mullet
27,134
1.0
66.2
20.8
10.6
1.4
Yellowtail Scad
53,048
4.6
30.8
18.5
6.3
22.9
16.8
Other small baitfish
4,459
72.2
27.8
Australian Bass
184,497
3.1
5.7
4.1
85.4
1.8
European Carp
1,428
31.2
68.8
Golden Perch
66,072
30.5
27.8
12.0
29.4
0.4
Murray Cod
144,741
9.4
49.7
2.5
28.9
9.4
0.1
Redfin Perch
91,853
14.1
6.7
6.9
66.1
6.2
Trout
50,156
27.9
37.1
6.6
28.1
0.3
Scalefish, other
551,647
16.3
26.6
6.4
0.8
5.8
44.1
0.0
Blue Swimmer Crab
22,864
61.8
14.1
2.0
20.7
1.5
Mud Crab
18,582
29.0
48.8
10.4
11.7
Rock lobster
3,291
15.6
84.4
Prawns (saltwater)
4,087
100.0
Shrimp (freshwater)
79,686
2.7
87.4
7.2
2.7
Nippers (saltwater)
96,787
71.1
1.9
27.0
Yabbies (freshwater)
35,270
48.2
26.5
3.4
21.9
Crustaceans, other
821
32.7
67.3
Squids
6,491
78.4
4.1
17.5
Cephalopods, other
11,428
36.3
27.4
36.3
Abalone
421
100.0
Pipis
2,692
100.0
Worms
62
100.0

West et al. NSW/ACT Recreational Fishing Survey – 2013/14
33 NSW Department of Primary Industries, December 2015
Targeted Fishing
Respondents were routinely asked whether they were fishing for particular species or not,
thereby enabling the effort and catch for each fishing event to be classified as being either
targeted or non-targeted. Respondents were asked to nominate up to two target species for
each event and thus, any resultant catch could be classified as targeted and non-targeted
components. However, in many cases, more general targets were reported, e.g. ‘reef fishing’ or
in the case of spearfishing and other diving, opportunistic catches were fairly common. An
understanding of targeted fishing behaviour provides insight into the level of specialisation and
value that recreational fishers attribute to particular species, as well as providing meaningful
measures of fishing success.
Targeted and non-targeted catch estimates by species are provided in Appendices 3 and 4 and
the proportion of the total catch attributed to targeted effort is summarised in Table 8 for key
species/groups. Overall, 62% of the total catch of all species was attributed to targeted fishing
effort. Of the key recreational species, the vast majority (>90%) of the Mud Crab and trout
catches were derived from targeted fishing effort, along with close to 100% for prawns, shrimp
and freshwater yabbies (Table 8; Appendix 3). By contrast, species such as European Carp,
Red Rock Cod and sharks/rays were quite rarely targeted (<20%) implying that catches of these
species were mostly incidental. However, for the majority of all key species, greater than half of
the total catch was attributed to targeted fishing effort (Table 8).
Table 8 Comparative summary of the proportion of the recreational catch (kept and released) of
key species that was taken by targeted effort in NSW/ACT waters during 2013/14, by
residents aged five years and older.
Proportion of the total catch targeted
< 20%
21-50%
51-70%
71-90%
> 90%
European Carp
Abalone
Bream
Australian Bass
Mud Crab
Leatherjacket
Blue Mackerel
Flathead, Dusky
Blue Swimmer Crab
Trout
Red Rock Cod
Mullet
Flathead, Sand
Golden Perch
Prawns (saltwater)
Sharks and rays
Salmon, Australian
Flathead, Tiger
Luderick
Shrimp (freshwater)
Silver Trevally
Snapper
Mulloway
Murray Cod
Yabbies (freshwater)
Whiting, School
Swallowtail Dart
Rock lobster
Redfin Perch
Wrasse/gropers
Tailor
Whiting, Sand
Squids
Yellowtail Scad
Yellowtail Kingfish
Tunas
Whiting, Trumpeter
Harvest Weights
Catch information reported during the Diary Survey was based on the numbers of fish kept or
released, rather than the weight of fish caught, since this information tends to be less reliable
when self-reported by recreational fishers. However, the weight of the recreational harvest is of
particular interest to resource managers, scientists and the various stakeholder groups. From a
stock assessment perspective, estimates of recreational harvest weights enable comparison
with the commercial sector, for which production is routinely reported by weight.
Recreational harvest weight estimates can be obtained for a given species by multiplying the
number of individual fish caught (and kept) by the average weight of an individual, using size
data from various fisheries datasets. However, individual species can vary by size over a range
of temporal and spatial scales. Fishing methods and skills can also have an impact here, as well
as size-selectivity differences between commercial and recreational fisheries. Ideally all of these

West et al. NSW/ACT Recreational Fishing Survey – 2013/14
34 NSW Department of Primary Industries, December 2015
factors should be taken into account when calculating average species weights. However, this
is rarely the case and the application of an average individual weight introduces additional
uncertainty to recreational harvest weight estimates, i.e. additional to the standard errors already
provided for harvest numbers. Furthermore, any grouping of species for reporting purposes can
confound this issue, due to variations in size among the species within the group.
This uncertainty can be reduced if ‘off-site’ diary surveys are supplemented by parallel ‘on-site’
monitoring programmes to collect accurate length data from recreational fishers – from a range
of locations and with strong temporal coverage. However, this was beyond the scope of the
2013/14 survey and in the absence of such data, it was decided to access a range of existing
data sources to approximate the average size of key species retained by recreational fishers.
These data sources were restricted to more recent on-site surveys within NSW for both
estuarine and marine environments (Murray-Jones and Steffe, 2000; Reid and Montgomery,
2005; Steffe and Murphy, 2011; Ochwada-Doyle et al., 2014).
As detailed in Appendix 5, separate calculations (mean weights) were applied to species caught
within estuaries and marine waters, due to the different size structures that can occur in each
case. Where recreational data were available, length/weight relationships have been used to
derive mean weights and these have been applied to survey harvest numbers to estimate total
harvest weights. Weight estimates for the commercial sector were obtained from reported
landings by NSW commercial fisheries. However, in cases where inadequate recreational
length data were available, mean weights were applied from the commercial fisheries data.
Table 9 presents ten selected species for weight comparisons between the recreational and
commercial fishery sectors. This list is restricted to species of key interest to commercial and
recreational fisheries management and also where harvest estimates from the survey were
considered sufficiently robust, i.e. the state-wide estimate for the kept component of the catch
had an RSE <40% and a minimum of 30 households reported the catch (refer Table 5).
For all the above reasons, it is strongly recommended that the recreational harvest weights in
this report be regarded as indicative only.
The results in Table 9 show that a majority of the total harvest weight in 2013/14 was attributable
to recreational fishing for five of the ten species – with over 71% of the total harvest for Dusky
Flathead, followed by Sand Flathead (> 67%), Mulloway and Tailor (both > 63%) and Yellowtail
Kingfish (> 52%). Bream, Sand Whiting and Snapper comprised less than half the total catch
(ranging from 49% down to 40%, respectively – with substantially lower proportions for
Australian Salmon (15%) and Silver Trevally (14%).

West et al. NSW/ACT Recreational Fishing Survey – 2013/14
35 NSW Department of Primary Industries, December 2015
Table 9 Harvest of key species in NSW waters by NSW/ACT residents, aged five years and older -
indicative estimates of the total weight (tonnes), compared with estimates for the
commercial fisheries sector during 2013/14.
Total (tonnes) %
Species/group Recreational Commercial Total recreational
Bream
330
343
672
49.1
Flathead, Dusky
288
115
404
71.4
Flathead, Sand
210
101
311
67.5
Mulloway
103
59
162
63.5
Salmon,
Australian
182 1,112 1,294 14.1
Silver Trevally
27
168
195
13.9
Snapper
148
220
368
40.2
Tailor
107
62
169
63.5
Whiting, Sand
69
79
148
46.5
Yellowtail Kingfish
120
109
229
52.5
Catch by Water Body
Catch details by water body type are provided in Appendices 6 and 7 and summarised for key
fish species in Figure 15. Of the total catch (kept and released) of all organisms taken by
NSW/ACT recreational fishers during 2013/14, a majority (59%) occurred in estuarine waters,
followed by inshore coastal waters (< 5 km; 23%), rivers (10%), lakes/dams (5%), and offshore
waters (3%).
In offshore waters (> 5 km), sand flathead were the main species caught and comprised 32% of
the total catch in that water body, followed by Snapper (14%), Yellowtail Kingfish (7%), Red
Rock Cod (5%) and a range of other species (at < 3% in each case) (Figure 15). Sand Flathead
were also the main species caught (20%) in inshore waters (< 5km), followed by bream (8%),
Snapper (7%), Tailor (6%) and a range of others species (at < 4% in each case).
In estuarine waters, bream were the main species caught (24%), followed by Dusky Flathead
(12%), prawns (9%, by numbers), Snapper (6%), Sand Whiting (6%) and a range of other
species (at < 4% in each case) (Fig 15). Note: refer earlier discussion in ‘Water Body’ (Page
23), regarding definitions of estuaries and the inclusion of large open bays, e.g. Batemans Bay
and Jervis Bay.
In freshwater rivers, European Carp (32%) was the main species caught, followed by shrimp
(27%, by numbers), Murray Cod (11%), yabbies (7%), Australian Bass and Golden Perch (at 6%
each) and all species at 3% or less (Fig 15). In freshwater lakes and dams, yabbies (25%) were
the main species caught, followed by trout (18%), Australian Bass (15%), Redfin Perch (13%),
Golden Perch and European Carp (at 9% each) and all other species at less than 5% each
(Figure 15).

West et al. NSW/ACT Recreational Fishing Survey – 2013/14
36 NSW Department of Primary Industries, December 2015
Figure 15 Catch estimates (kept and released) of key species by residents aged five years and older
in NSW/ACT waters during 2013/14, by water body. Error bars represent one standard
error.
0
20
40
60
80
100
120
140
160
180
200
Catch (x000)
Offshore
0
100
200
300
400
500
600
700
800
900
Catch (x000)
Inshore
0
500
1000
1500
2000
2500
Catch (x000)
Estuary
0
100
200
300
400
500
600
Catch (x000)
Rivers
0
50
100
150
200
250
300
Catch (x000)
Lake/Dam

West et al. NSW/ACT Recreational Fishing Survey – 2013/14
37 NSW Department of Primary Industries, December 2015
Catch by Method
Catch details by fishing method are provided in Appendices 8 and 9 and summarised for key
species in Figure 16. Overall, line fishing accounted for a majority (76%) of the total catch (kept
and released) of all organisms taken by NSW/ACT recreational fishers during 2013/14. Other
methods (primarily hand collecting, digging and pumping for small bait species) contributed a
further 13%, followed by nets (6%), pots and traps (5%) and diving (1%).
Fish accounted for the vast majority of the line catch, with bream (21%) the main species caught
by that method (Figure 16). Other species of significance included Dusky Flathead, (10%), Sand
Flathead (9%), Snapper (7%), Sand Whiting (5%) and a range of others species (at < 4% in
each case). Smaller crustacean species dominated the catch (by numbers) taken by pots and
traps (i.e. shrimp and yabbies), also by nets (mainly prawns) (Figure 16). In terms of diving, rock
lobster and abalone are prime targets and dominated the catch (Figure 16).
Figure 16 Catch estimates (kept and released) of key species by residents aged five years and older
in NSW/ACT waters during 2013/14, by fishing method. Error bars represent one
standard error.
0
500
1000
1500
2000
2500
3000
Catch (x000)
Line
0
100
200
300
400
500
600
Catch (x000)
Pot/trap
0
5
10
15
20
25
30
35
40
45
Catch (x000)
Dive
0
200
400
600
800
1000
1200
Catch (x000)
Net

West et al. NSW/ACT Recreational Fishing Survey – 2013/14
38 NSW Department of Primary Industries, December 2015
Line Fishing
Line fishing is practised using either baited hooks, artificial lures (hard body lures and soft
plastics) or flies and each line fishing event in the Diary Survey was further defined in terms of
whether bait or lures/flies were used. However, because some fishing events involved the use
of both modes, separate catch details were often not achievable – hence a third code (‘both’)
was applied. The relative importance of either bait or lure/fly fishing for many key fish species
has been assessed in Table 10. Bait fishing represented the primary capture mode for the vast
majority (over 80%) of these species, whereas lure/fly fishing was the main method for only five
species/groups: Australian Bass, Redfin Perch, trout, tunas and ‘other small baitfish’. However,
the popularity of lure/fly fishing has increased over the years, as has its significance in terms of
total catch (see further discussion in ‘Fishing Effort’, Page 88).
Table 10 Annual recreational catch (kept and released numbers) of key fish species in NSW/ACT
waters by line fishing mode during 2013/14 and proportions taken by bait or lure/fly, by
residents aged five years and older. SE is standard error; values in bold indicate relative
standard error > 40%; values in italics indicate fewer than 30 households recorded
catches of the species.
Bait
Lure/fly
Both
% Bait
only
% Lure
only
Species/group
Number
SE
Number
SE
Number
SE
Bream
1,907,047
287,850
144,869
46,651
150,290
32,011
86.6
6.6
Flathead, Dusky
630,192
79,632
326,404
88,642
100,792
21,102
59.6
30.9
Flathead, Sand
817,156
172,937
15,895
8,007
126,961
35,205
85.1
1.7
Flathead, Tiger
70,044
30,222
12,285
8,735
85.1
0.0
Leatherjacket
93,656
19,322
309
284
4,532
1,974
95.1
0.3
Luderick
405,420
186,178
2,763
1,836
10,090
5,469
96.9
0.7
Mulloway
94,255
34,833
12,361
4,594
4,957
1,907
84.5
11.1
Red Rock Cod
115,624
31,314
3,674
2,567
32,234
9,101
76.3
2.4
Salmon, Australian
103,880
21,545
29,401
11,784
11,236
5,281
71.9
20.3
Sharks and rays
89,565
17,221
5,507
2,208
13,840
8,306
82.2
5.1
Silver Trevally
66,672
18,807
4,771
2,294
15,963
6,910
76.3
5.5
Snapper
549,410
94,831
23,980
12,258
181,405
96,843
72.8
3.2
Swallowtail Dart
117,825
39,873
1,111
1,101
99.1
0.0
Tailor
244,642
46,230
83,712
28,319
34,537
10,450
67.4
23.1
Tunas
17,262
6,024
35,091
23,646
4,695
1,568
30.3
61.5
Whiting, Sand
509,007
101,816
35,332
17,483
24,368
8,723
89.5
6.2
Whiting, School
11,018
4,240
287
283
502
495
93.3
2.4
Whiting, Trumpeter
84,819
49,682
35,621
35,660
32,546
25,305
55.4
23.3
Wrasse/gropers
75,370
20,108
14,462
13,337
21,386
14,065
67.8
13.0
Yellowtail Kingfish
59,453
20,544
20,162
9,124
16,309
8,481
62.0
21.0
Blue Mackerel
109,195
34,721
9,209
4,547
18,716
9,641
79.6
6.7
Mullet
67,936
21,508
5,375
3,946
7,896
4,920
83.7
6.6
Yellowtail Scad
99,102
30,032
9,500
4,276
34,628
22,952
69.2
6.6
Other small baitfish
115,390
66,350
159,967
99,803
42,654
32,719
36.3
50.3
Australian Bass
50,468
27,559
139,826
52,980
5,507
5,446
25.8
71.4
European Carp
377,459
73,963
12,367
5,158
108,218
31,488
75.8
2.5
Golden Perch
87,360
13,561
34,260
9,276
20,863
5,513
61.3
24.0
Murray Cod
106,908
20,992
25,232
7,261
33,358
13,006
64.6
15.2
Redfin Perch
59,949
38,333
61,683
35,193
14,647
6,708
44.0
45.3
Trout
12,223
4,502
128,580
36,821
17,173
6,139
7.7
81.4
Scalefish, other
693,209
90,417
42,261
11,057
110,468
23,662
81.9
5.0

West et al. NSW/ACT Recreational Fishing Survey – 2013/14
39 NSW Department of Primary Industries, December 2015
Catch by Fishing Platform
Catch details by fishing platform are provided in Appendices 10 and 11 and summarised in
Table 11. Overall, boat-based and shore-based fishing accounted for equal proportions (50%
each) of the total catch (kept and released) of all organisms taken by NSW/ACT recreational
fishers during 2013/14. However, the proportions varied considerably between species
(Appendix 10) and a summary assessment of key species for boat-based fishing is provided
below (Table 11).
Table 11 Comparative summary of the proportion of the total recreational catch (kept and released)
of key species taken in NSW/ACT waters by boat-based fishing during 2013/14, by
residents aged five years and older.
Proportion of catch - boat-based
< 30%
31-50%
51-70%
71-90%
> 90%
Salmon, Australian
Bream
Leatherjacket
Flathead, Dusky
Flathead, Tiger
Swallowtail Dart
Luderick
Sharks and rays
Flathead, Sand
Whiting, Trumpeter
Mullet
Tailor
Silver Trevally
Mulloway
Yellowtail Kingfish
European Carp
Whiting, Sand
Tunas
Red Rock Cod
Blue Mackerel
Rock lobster
Mud Crab
Whiting, School
Snapper
Shrimp (freshwater)
Prawns (saltwater)
Wrasse/gropers
Yellowtail Scad
Yabbies (freshwater)
Golden Perch
Australian Bass
Abalone
Murray Cod
Redfin Perch
Trout
Squids
Blue Swimmer Crab

West et al. NSW/ACT Recreational Fishing Survey – 2013/14
40 NSW Department of Primary Industries, December 2015
Key Species
In the following section, some 23 key species/groups have been described in terms of: the
regional distribution of the total catch by fishing zone (Appendix 13); numbers kept and released
(Table 5); then total catch by fishing platform (Appendix 10), water body type (Appendix 6),
fishing method (Appendix 8, and Table 10) and season (Appendix 12).
Catch information was provided by fishers during the Diary Survey and is presented as
expanded estimates of the total catch by the resident population of NSW and the ACT aged five
years and older (as at June 2013) and their recreational fishing activity during the period June
2013 to May 2014.
Note: the species/groups included in this section refer to those with relatively large total catch
estimates for the period. However, species have routinely been excluded from this analysis,
where the RSE for the total catch estimate is greater than 40% or where the results were
provided by less than 30 households (refer Table 5). For example, the total catch estimate for
Luderick was quite large (428,213) and a relatively large number of households provided the
data. However among these, a small number of diarists reported very high annual/raw data
catches resulting in a greater than 40% RSE for the total catch. Similarly, the total catch
estimate for Trumpeter Whiting was 152,986, however the RSE was greater than 40% and less
than 30 households provided the data.

West et al. NSW/ACT Recreational Fishing Survey – 2013/14
41 NSW Department of Primary Industries, December 2015
Bream
Over half (52%) of the total recreational catch of bream (Acanthopagrus spp.) was taken in the
Sydney and Mid South Coast fishing zones (26% each), followed by the Mid North Coast (20%),
Hunter (14%), North Coast (12%) and South Coast (2%) (Figure 17A). The majority (72%) of all
bream caught were released (Figure 17B) and shore-based fishing (57%) accounted for over
half of the catch (Figure 17C). The vast majority of the catch was taken in estuarine waters
(88%), followed by inshore coastal waters (12%) and freshwater rivers (<1%) (Figure 17D).
Virtually all of the catch was taken by line fishing – primarily using bait (90%) as opposed to
lures (10%), with a small component (<1%) taken by other methods (net and diving) (Figure
17E). The summer season (Dec-Feb) accounted for a third (33%) of the catch, followed by
autumn (29%), winter (21%) and spring (17%) (Figure 17F).
Figure 17 Characteristics of the recreational fishery for bream in NSW during 2013/14 – total catch
(numbers kept and released) by NSW/ACT residents by: A) proportion (%) by fishing
zone; B) kept and released; C) boat and shore-based fishing; D) water body fishing zone;
B) kept and released; C) boat and shore-based fishing; D) water body fished; E) fishing
method; and F) seasonality. Error bars represent one standard error, with equivalent data
for A) fishing zones in Appendix 13.

West et al. NSW/ACT Recreational Fishing Survey – 2013/14
42 NSW Department of Primary Industries, December 2015
Dusky Flathead
Close to one third (31%) of the total recreational catch of dusky flathead (Platycephalus fuscus)
was taken in the Mid South Coast fishing zone – with the remaining catch distributed quite
evenly across the other five coastal zones (ranging from 16% down to 11%) (Figure 18A). Over
half (55%) of all dusky flathead caught were released (Figure 18B) and boat-based fishing (82%)
accounted for the vast majority of the catch (Figure 18C). Estuarine waters dominated the total
catch (96%), with the remainder in inshore coastal waters (3%) and other water body types
(<1%) (Figure 18D). Virtually all of the catch was taken by line fishing – mainly using bait (64%)
as opposed to lures (36%), with a small component (<1%) taken by other methods (pot/trap, net
and diving) (Figure 18E). The summer season (Dec-Feb) accounted for just over a third (34%)
of the catch, followed by autumn (27%), spring (23%) and winter (16%) (Figure 18F).
Figure 18 Characteristics of the recreational fishery for Dusky Flathead in NSW during 2013/14 –
total catch (numbers kept and released) by NSW/ACT residents by: A) proportion (%) by
fishing zone; B) kept and released; C) boat and shore-based fishing; D) water body
fished; E) fishing method; and F) seasonality. Error bars represent one standard error,
with equivalent data for A) fishing zones in Appendix 13.
12%
20%
14%
26%
26%
2%
A
B C
D
FE
Dusky Flathead
11%
16%
14%
31%
13%
14%
0
100
200
300
400
500
600
700
Kept Rel.
Catch (x000)
0
200
400
600
800
1000
1200
Boat Shore
Catch (x000)
0
100
200
300
400
500
600
700
800
Line-bait Line-lure Pot/trap Net Dive Other
Catch (x000)
0
200
400
600
800
1000
1200
1400
Offshore Inshore Estuary River Lake/dam
Catch (x000)
0
50
100
150
200
250
300
350
400
450
Jun-Aug Sep-Nov Dec-Feb
Mar-May
Catch (x000)

West et al. NSW/ACT Recreational Fishing Survey – 2013/14
43 NSW Department of Primary Industries, December 2015
Sand Flathead
The Mid South Coast fishing zone accounted for 39% of the total recreational catch of Sand
Flathead (several Platycephalidae species, but dominated by Platycephalus caeruleopunctatus
& bassensis), followed by Sydney (23%), then the Mid North Coast and Hunter (at 14% each),
South Coast (7%) and North Coast (3%) (Figure 19A). Over half (54%) of all sand flathead
caught were released (Figure 19B) and boat-based fishing (90%) accounted for the vast majority
of the catch (Figure 19C). Inshore coastal waters dominated the total catch (69%), with the
remainder in estuaries (17%) and offshore waters (14%) (Figure 19D). Virtually all of the catch
was taken by line fishing – the majority using bait (91%) as opposed to lures (8%), with a small
component (<1)% taken by other methods (net and diving) (Figure 19E). The summer season
(Dec-Feb) accounted for half (50%) of the total catch, with the remainder being distributed
across the other seasons – spring (19%), autumn (16%) and winter (14%) (Figure 19F).
Figure 19 Characteristics of the recreational fishery for Sand Flathead in NSW during 2013/14 – total
catch (numbers kept and released) by NSW/ACT residents by: A) proportion (%) by
fishing zone; B) kept and released; C) boat and shore- based fishing; D) water body
fished; E) fishing method; and F) seasonality. Error bars represent one standard error,
with equivalent data for A) fishing zones in Appendix 13.
12%
20%
14%
26%
26%
2%
A
B C
D
FE
Sand Flathead
3%
14%
14%
39%
23%
7%
0
100
200
300
400
500
600
700
Kept Rel.
Catch (x000)
0
200
400
600
800
1000
1200
Boat Shore
Catch (x000)
0
200
400
600
800
1000
1200
Line-bait Line-lure Pot/trap Net Dive Other
Catch (x000)
0
100
200
300
400
500
600
700
800
900
Offshore Inshore Estuary River Lake/dam
Catch (x000)
0
100
200
300
400
500
600
700
Jun-Aug Sep-Nov Dec-Feb Mar-May
Catch (x000)

West et al. NSW/ACT Recreational Fishing Survey – 2013/14
44 NSW Department of Primary Industries, December 2015
Leatherjacket
The Sydney fishing zone accounted for 43% of the total catch of leatherjacket species
(Balistidae & Monacanthidae), followed by the Mid South Coast (30%), Hunter (13%), Mid North
Coast (9%) and South Coast (4%) (Figure 20A). A majority (61%) of the leatherjacket catch was
kept (Figure 20B) and boat-based fishing (63%) accounted for a similar majority of the catch
(Figure 20C). Half of the catch (50%) was taken in inshore coastal waters, followed closely by
estuarine waters (42%), then offshore (8%) (Figure 20D). The vast majority of the catch was
taken by line fishing (84%) – primarily using bait (82%) as opposed to lures (2%). Diving
accounted for 16% of the catch (Figure 20E). Almost one third (32%) of the catch occurred
during the autumn season (Mar-May), followed by spring (26%), then summer and winter (at
21% each) (Figure 20F).
Figure 20 Characteristics of the recreational fishery for leatherjacket in NSW during 2013/14 – total
catch (numbers kept and released) by NSW/ACT residents by: A) proportion (%) by
fishing zone; B) kept and released; C) boat and shore-based fishing; ; D) water body
fished; E) fishing method; and F) seasonality. Error bars represent one standard error,
with equivalent data for A) fishing zones in Appendix 13.
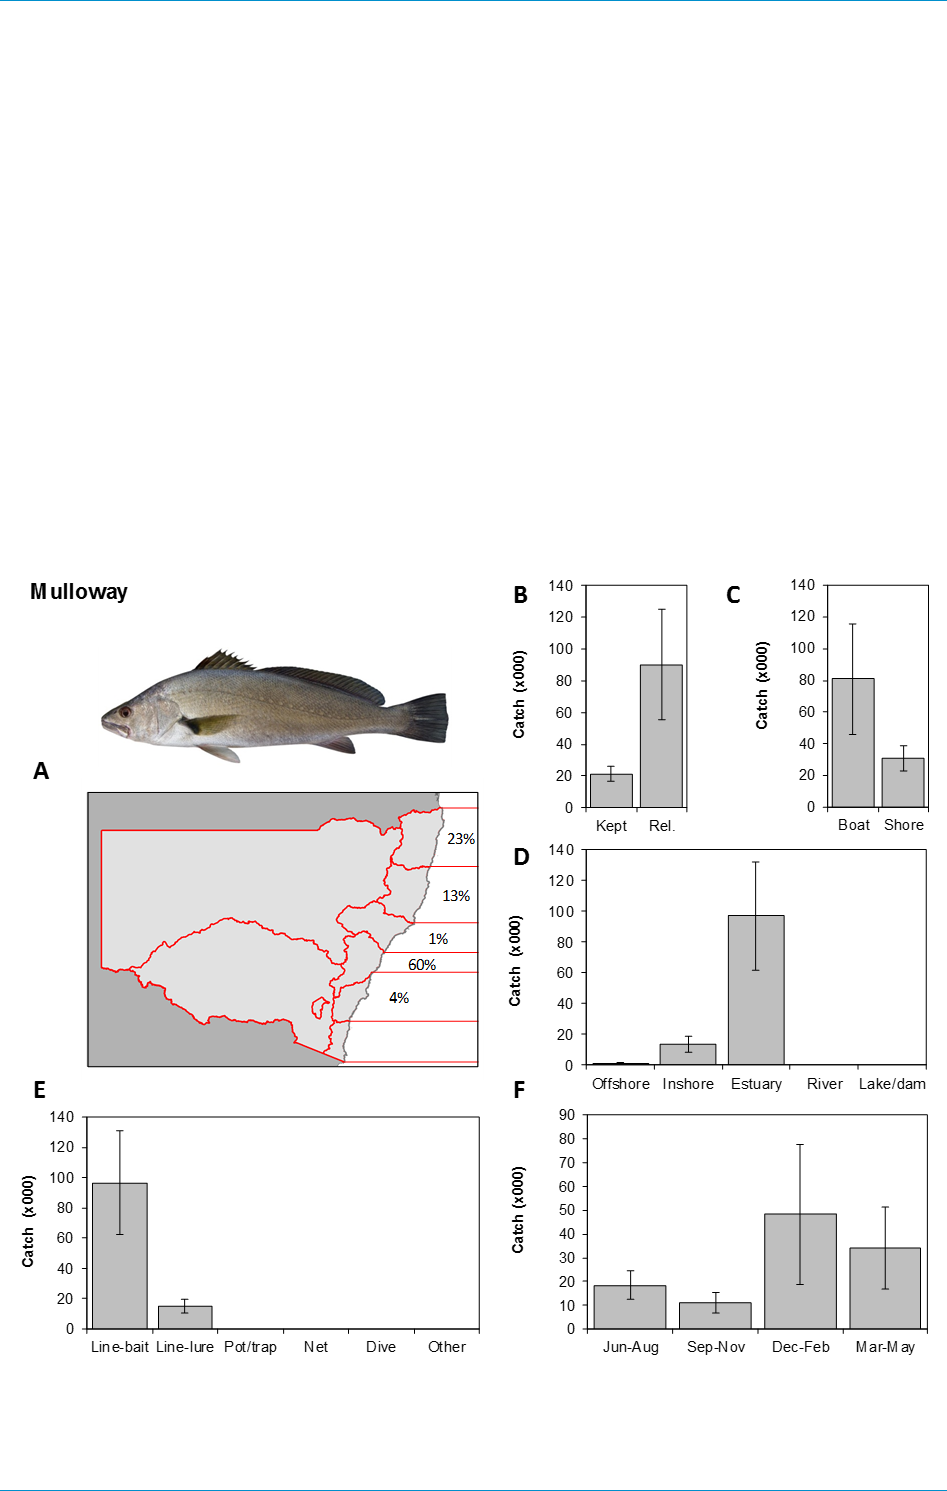
West et al. NSW/ACT Recreational Fishing Survey – 2013/14
45 NSW Department of Primary Industries, December 2015
Mulloway
Over half of the total recreational catch of Mulloway (Argyrosomus hololepidotus) was taken in
the Sydney fishing zone (60%), followed by the North Coast (23%), Mid North Coast (13%), with
minority catches in the Mid South Coast (4%) and Hunter zones (1%) (Figure 21A). The majority
(81%) of all mulloway caught were released (Figure 21B) and boat-based fishing (72%)
accounted for most of the catch (Figure 21C). The vast majority of the catch was taken in
estuarine waters (87%), followed by inshore coastal waters (12%) and offshore (1%) (Figure
21D). All of the catch was taken by line fishing – primarily using bait (87%), as opposed to lures
(13%) (Figure 21E). The summer season (Dec-Feb) accounted for 43% of the catch, followed
by autumn (30%), winter (17%) and spring (10%) (Figure 21F).
Figure 21 Characteristics of the recreational fishery for Mulloway in NSW during 2013/14 – total
catch (numbers kept and released) by NSW/ACT residents by: A) proportion (%) by
fishing zone; B) kept and released; C) boat and shore-based fishing; D) water body
fished; E) fishing method; and F) seasonality. Error bars represent one standard error,
with equivalent data for A) fishing zones in Appendix 13.

West et al. NSW/ACT Recreational Fishing Survey – 2013/14
46 NSW Department of Primary Industries, December 2015
Australian Salmon
Almost half of the total recreational catch of Australian Salmon (Arripis spp.) was taken in the
Mid South Coast fishing zone (47%), followed by the Hunter (20%), Sydney (15%), South Coast
(14%) and Mid North Coast (3%) (Figure 22A). Just over half (51%) of all Australian salmon
caught were kept (Figure 22B) and shore-based fishing (74%) accounted for the majority of the
catch (Figure 22C). Over two thirds of the catch was taken in inshore coastal waters (69%),
followed by estuaries (28%) and a minority in offshore waters (3%) (Figure 22D). Virtually all of
the catch was taken by line fishing – mainly using bait (76%) as opposed to lures (24%) with a
small component (<1%) taken by net (Figure 22E). The spring season (Sep-Nov) accounted for
over a third of the catch (35%), closely followed by winter (32%), then autumn (18%) and
summer (15%) (Figure 22F).
Figure 22 Characteristics of the recreational fishery for Australian Salmon in NSW during 2013/14 –
total catch (numbers kept and released) by NSW/ACT residents by: A) proportion (%) by
fishing zone; B) kept and released; C) boat and shore-based fishing; D) water body
fished; E) fishing method; and F) seasonality. Error bars represent one standard error,
with equivalent data for A) fishing zones in Appendix 13.
12%
20%
14%
26%
26%
2%
A
B C
D
FE
Australian Salmon
3%
20%
47%
15%
14%
0
10
20
30
40
50
60
70
80
90
100
Kept Rel.
Catch (x000)
0
20
40
60
80
100
120
140
Boat Shore
Catch (x000)
0
20
40
60
80
100
120
140
Line-bait Line-lure Pot/trap Net Dive Other
Catch (x000)
0
20
40
60
80
100
120
140
Offshore Inshore Estuary River Lake/dam
Catch (x000)
0
10
20
30
40
50
60
70
Jun-Aug Sep-Nov Dec-Feb Mar-May
Catch (x000)

West et al. NSW/ACT Recreational Fishing Survey – 2013/14
47 NSW Department of Primary Industries, December 2015
Silver Trevally
The Sydney fishing zone accounted for 43% of the total recreational catch of Silver Trevally
(Pseudocaranx dentex), followed by the Mid South Coast (28%) and Hunter (13%), with the
remainder of the catch in the North Coast, Mid North Coast and South Coast zones (at 5% each)
(Figure 23A). Over half (56%) of all Silver Trevally caught were kept (Figure 23B) and boat-
based fishing (69%) accounted for the majority of the catch (Figure 23C). Over half of the catch
was taken in inshore coastal waters (55%), followed by estuaries (42%) and a minority in
offshore waters (3%) (Figure 23D). Virtually all of the catch was taken by line fishing – the
majority using bait (85%) as opposed to lures (15%), with a small component (<1%) taken by net
(Figure 23E). The winter season (Jun-Aug) accounted for over a third of the catch (34%),
closely followed by spring (31%), then autumn (19%) and summer (16%) (Figure 23F).
Figure 23 Characteristics of the recreational fishery for Silver Trevally in NSW during 2013/14 – total
catch (numbers kept and released) by NSW/ACT residents by: A) proportion (%) by
fishing zone; B) kept and released; C) boat and shore-based fishing; D) water body
fished; E) fishing method; and F) seasonality. Error bars represent one standard error,
with equivalent data for A) fishing zones in Appendix 13.
12%
20%
14%
26%
26%
2%
A
B C
D
FE
Silver Trevally
5%
5%
13%
28%
43%
5%
0
10
20
30
40
50
60
70
Kept
Rel.
Catch (x000)
0
10
20
30
40
50
60
70
80
90
Boat Shore
Catch (x000)
0
20
40
60
80
100
Line-bait Line-lure Pot/trap Net Dive Other
Catch (x000)
0
10
20
30
40
50
60
70
Offshore Inshore Estuary River Lake/dam
Catch (x000)
0
5
10
15
20
25
30
35
40
45
Jun-Aug Sep-Nov Dec-Feb Mar-May
Catch (x000)

West et al. NSW/ACT Recreational Fishing Survey – 2013/14
48 NSW Department of Primary Industries, December 2015
Snapper
Over a third of the total recreational catch of Snapper (Pagrus auratus) was taken in the Sydney
fishing zone (35%), followed by the Hunter and Mid South Coast (at 22% each), North Coast
(11%), Mid North Coast (7%) and South Coast (4%) (Figure 24A). The majority (75%) of all
Snapper caught were released (Figure 24B) and boat-based fishing dominated the total catch
(80%) (Figure 24C). A majority of the catch was taken in estuarine waters (61%), followed by
inshore coastal waters (31%) and offshore (8%) (Figure 24D). Virtually all of the catch was
taken by line fishing – the vast majority using bait (85%) as opposed to lures (15%), with a small
component (<1%) taken by diving (Figure 24E). The summer season (Dec-Feb) accounted for
45% of the catch, followed by autumn (25%), winter (17%) and spring (13%) (Figure 24F).
Figure 24 Characteristics of the recreational fishery for Snapper in NSW during 2013/14 – total catch
(numbers kept and released) by NSW/ACT residents by: A) proportion (%) by fishing
zone; B) kept and released; C) boat and shore-based fishing; D) water body fished; E)
fishing method; and F) seasonality. Error bars represent one standard error, with
equivalent data for A) fishing zones in Appendix 13.

West et al. NSW/ACT Recreational Fishing Survey – 2013/14
49 NSW Department of Primary Industries, December 2015
Tailor
Close to a third of the total recreational catch of Tailor (Pomatomus saltatrix) was taken in the
Mid North Coast fishing zone (31%), followed by Sydney (18%), the Hunter (16%), Mid South
Coast (14%), North Coast (13%) and South Coast (8%) (Figure 25A). Over half (52%) of all
Tailor caught were kept (Figure 25B) and shore-based fishing (56%) accounted for over half of
the catch (Figure 25C). Virtually all of the catch was taken in estuaries and inshore coastal
waters (at 50% each), with offshore waters at < 1% (Figure 25D). Almost all of the catch was
taken by line fishing – mainly using bait (72%) as opposed to lures (28%), with a small
component (<1%) taken by diving (Figure 25E). The winter season (Jun-Aug) accounted for
over a third of the total catch (37%), closely followed by autumn (36%), then summer (17%) and
spring (11%) (Figure 25F).
Figure 25 Characteristics of the recreational fishery for Tailor in NSW during 2013/14 – total catch
(numbers kept and released) by NSW/ACT residents by: A) proportion (%) by fishing
zone; B) kept and released; C) boat and shore-based fishing; D) water body fished; E)
fishing method; and F) seasonality. Error bars represent one standard error, with
equivalent data for A) fishing zones in Appendix 13.

West et al. NSW/ACT Recreational Fishing Survey – 2013/14
50 NSW Department of Primary Industries, December 2015
Sand Whiting
Close to a third (32%) of the total recreational catch of Sand Whiting (Sillago ciliata) was taken in
the Mid South Coast fishing zone, followed by the Hunter (28%), North Coast (17%), Mid North
Coast (13%), then Sydney and the South Coast (at 5% each) (Figure 26A). Over half (56%) of
all Sand Whiting caught were released (Figure 26B) and shore-based fishing (53%) accounted
for over half of the catch (Figure 26C). The vast majority of the catch was taken in estuarine
waters (80%), with the remainder from inshore coastal waters (20%) (Figure 26D). Almost all of
the catch was taken by line fishing – the majority using bait (92%) as opposed to lures (8%), with
a small component (<1%) taken by diving (Figure 26E). The summer season (Dec-Feb)
accounted for over half of the catch (52%), followed by autumn (28%), spring (12%) and winter
(8%) (Figure 26F).
Figure 26 Characteristics of the recreational fishery for Sand Whiting in NSW during 2013/14 – total
catch (numbers kept and released) by NSW/ACT residents by: A) proportion (%) by
fishing zone; B) kept and released; C) boat and shore-based fishing; D) water body
fished; E) fishing method; and F) seasonality. Error bars represent one standard error,
with equivalent data for A) fishing zones in Appendix 13.
12%
20%
14%
26%
26%
2%
A
B C
D
FE
Sand Whiting
17%
13%
28%
32%
5%
5%
0
50
100
150
200
250
300
350
400
450
Kept Rel.
Catch (x000)
0
50
100
150
200
250
300
350
400
Boat
Shore
Catch (x000)
0
100
200
300
400
500
600
700
Line-bait Line-lure Pot/trap Net Dive Other
Catch (x000)
0
100
200
300
400
500
600
Offshore Inshore Estuary River Lake/dam
Catch (x000)
0
50
100
150
200
250
300
350
400
Jun-Aug Sep-Nov Dec-Feb Mar-May
Catch (x000)

West et al. NSW/ACT Recreational Fishing Survey – 2013/14
51 NSW Department of Primary Industries, December 2015
Yellowtail Kingfish
The majority of the total recreational catch of Yellowtail Kingfish (Seriola lalandi) was taken in
the Mid South Coast fishing zone (71%), followed by the Mid North Coast (13%), the Hunter
(7%), Sydney (5%), the South Coast (4%) and the North Coast (2%) (Figure 27A). A majority
(63%) of all Yellowtail Kingfish caught were released (Figure 27B) and boat-based fishing
accounted for the vast majority of the catch (91%) (Figure 27C). Just over half the catch was
taken from inshore coastal waters (51%), followed by offshore waters (31%) and estuaries (18%)
(Figure 27D). The vast majority of the catch was taken by line fishing – mainly using bait (70%)
as opposed to lures (29%), with a small component (<1%) taken by diving (Figure 27E). The
autumn season (Mar-May) accounted for just over half of the catch (55%), followed by summer
(33%), winter (7%) and spring (6%) (Figure 27F).
Figure 27 Characteristics of the recreational fishery for Yellowtail Kingfish in NSW during 2013/14 –
total catch (numbers kept and released) by NSW/ACT residents by: A) proportion (%) by
fishing zone; B) kept and released; C) boat and shore-based fishing; D) water body
fished; E) fishing method; and F) seasonality. Error bars represent one standard error,
with equivalent data for A) fishing zones in Appendix 13.
12%
20%
14%
26%
26%
2%
A
B C
D
FE
Yellowtail Kingfish
2%
13%
7%
71%
5%
4%
0
10
20
30
40
50
60
70
80
90
Kept Rel.
Catch (x000)
0
20
40
60
80
100
120
140
Boat Shore
Catch (x000)
0
10
20
30
40
50
60
70
80
90
100
Line-bait Line-lure Pot/trap Net Dive Other
Catch (x000)
0
10
20
30
40
50
60
70
Offshore Inshore Estuary River Lake/dam
Catch (x000)
0
10
20
30
40
50
60
70
80
Jun-Aug Sep-Nov Dec-Feb
Mar-May
Catch (x000)

West et al. NSW/ACT Recreational Fishing Survey – 2013/14
52 NSW Department of Primary Industries, December 2015
Blue Mackerel
The Mid South Coast fishing zone accounted for 39% of the total recreational catch of Blue
Mackerel (Scomber australasicus), followed by the Mid North Coast (26%), the North Coast and
Hunter (at 11% each), South Coast (10%) and Sydney (3%) (Figure 28A). The vast majority
(91%) of all Blue Mackerel caught were kept (Figure 28B) and boat-based fishing (92%)
accounted for a similar majority of the catch (Figure 28C). Just over half of the catch was taken
from inshore coastal waters (51%), followed by estuaries (31%) and offshore (11%) (Figure
28D). All of the catch was taken by line fishing – mostly using bait (86%) as opposed to lures
(14%) (Figure 28E). The summer season (Dec-Feb) accounted for 43% of the catch, followed
by autumn (32%), spring (14%) and winter (12%) (Figure 28F).
Figure 28 Characteristics of the recreational fishery for Blue Mackerel in NSW during 2013/14 – total
catch (numbers kept and released) by NSW/ACT residents by: A) proportion (%) by
fishing zone; B) kept and released; C) boat and shore-based fishing; D) water body
fished; E) fishing method; and F) seasonality. Error bars represent one standard error,
with equivalent data for A) fishing zones in Appendix 13.
12%
20%
14%
26%
26%
2%
A
B C
D
FE
Blue Mackerel
11%
26%
11%
39%
3%
10%
0
20
40
60
80
100
120
140
160
180
Kept Rel.
Catch (x000)
0
20
40
60
80
100
120
140
160
180
Boat Shore
Catch (x000)
0
20
40
60
80
100
120
140
160
Line-bait Line-lure Pot/trap Net Dive Other
Catch (x000)
0
20
40
60
80
100
120
Offshore Inshore Estuary River Lake/dam
Catch (x000)
0
10
20
30
40
50
60
70
80
90
Jun-Aug Sep-Nov Dec-Feb Mar-May
Catch (x000)

West et al. NSW/ACT Recreational Fishing Survey – 2013/14
53 NSW Department of Primary Industries, December 2015
Mullet
The Mid South Coast fishing zone accounted for 37% of the total recreational catch of mullet
(Mugilidae), followed by the Mid North Coast (24%), Sydney (21%) then the North Coast and
Hunter (at 8% each), with the South Coast at 2% (Figure 29A). The majority (73%) of all mullet
caught were kept (Figure 29B) and shore-based fishing (75%) accounted for a similar majority of
the catch (Figure 29C). A high proportion of the catch was taken in estuarine waters (73%),
followed by freshwater rivers (18%) and inshore coastal waters (9%) (Figure 29D). The majority
of the catch was taken by line fishing – primarily using bait (73%) as opposed to lures (9%), with
a notable component (18%) taken by pots/traps (Figure 29E). The summer season (Dec-Feb)
accounted for 30% of the catch, closely followed by winter (29%) then autumn (22%) and spring
(19%) (Figure 29F).
Figure 29 Characteristics of the recreational fishery for mullet in NSW during 2013/14 – total catch
(numbers kept and released) by NSW/ACT residents by: A) proportion (%) by fishing
zone; B) kept and released; C) boat and shore-based fishing; D) water body fished; E)
fishing method; and F) seasonality. Error bars represent one standard error, with
equivalent data for A) fishing zones in Appendix 13.

West et al. NSW/ACT Recreational Fishing Survey – 2013/14
54 NSW Department of Primary Industries, December 2015
Yellowtail Scad
The Sydney fishing zone accounted for 40% of the total recreational catch of Yellowtail Scad
(Trachurus novaezelandiae), followed by the Mid South Coast (23%), North Coast (16%), Hunter
(12%), South Coast (5%) and Mid North Coast (4%) (Figure 30A). The majority (63%) of all
Yellowtail Scad caught were kept (Figure 30B) and boat-based fishing (80%) accounted for the
vast majority of the catch (Figure 30C). Just over half the catch was taken from estuaries (51%),
followed closely by inshore coastal waters (47%), with a small minority (2%) in offshore waters
(Figure 30D). All of the catch was taken by line fishing – with the majority using bait (81%) as
opposed to lures (19%) (Figure 30E). The summer season (Dec-Feb) accounted for 41% of the
catch, followed by winter (24%), autumn (18%) and spring (16%) (Figure 30F).
Figure 30 Characteristics of the recreational fishery for Yellowtail Scad in NSW during 2013/14 –
total catch (numbers kept and released) by NSW/ACT residents by: A) proportion (%) by
fishing zone; B) kept and released; C) boat and shore-based fishing; D) water body
fished; E) fishing method; and F) seasonality. Error bars represent one standard error,
with equivalent data for A) fishing zones in Appendix 13.
12%
20%
14%
26%
26%
2%
A
B C
D
FE
Yellowtail Scad
16%
4%
12%
23%
40%
5%
0
20
40
60
80
100
120
140
Kept Rel.
Catch (x000)
0
20
40
60
80
100
120
140
160
180
Boat Shore
Catch (x000)
0
20
40
60
80
100
120
140
160
Line-bait Line-lure Pot/trap Net Dive Other
Catch (x000)
0
20
40
60
80
100
120
Offshore Inshore Estuary River Lake/dam
Catch (x000)
0
10
20
30
40
50
60
70
80
90
Jun-Aug Sep-Nov Dec-Feb Mar-May
Catch (x000)

West et al. NSW/ACT Recreational Fishing Survey – 2013/14
55 NSW Department of Primary Industries, December 2015
Australian Bass
The majority of the total recreational catch of Australian Bass (Macquaria novemaculeata) was
taken in the Hunter fishing zone (74%), followed by the North Coast (11%), Sydney (8%), then
the Mid North Coast and Mid South Coast (at 3% each) (Figure 31A). Virtually all (94%) of
Australian Bass caught were released (Figure 31B) and boat-based fishing (84%) accounted for
the majority of the catch (Figure 31C). Over half the catch was taken in freshwater lakes or
dams (56%), followed by freshwater rivers (42%), with a minority (2%) in estuarine waters
(Figure 31D). All of the catch was taken by line fishing – primarily using lures (73%) as opposed
to bait (27%) (Figure 31E). The spring season (Sep-Nov) accounted for close to half of the
catch (47%), followed by summer (27%), autumn (22%) and a minority in winter (3%) (Figure
31F).
Figure 31 Characteristics of the recreational fishery for Australian Bass in NSW during 2013/14 –
total catch (numbers kept and released) by NSW/ACT residents by: A) proportion (%) by
fishing zone; B) kept and released; C) boat and shore-based fishing; D) water body
fished; E) fishing method; and F) seasonality. Error bars represent one standard error,
with equivalent data for A) fishing zones in Appendix 13.
12%
20%
14%
26%
26%
2%
A
B C
D
FE
Australian Bass
11%
3%
74%
3%
8%
0
50
100
150
200
250
300
Kept Rel.
Catch (x000)
0
50
100
150
200
250
Boat Shore
Catch (x000)
0
50
100
150
200
Line-bait Line-lure Pot/trap Net Dive Other
Catch (x000)
0
20
40
60
80
100
120
140
160
180
Offshore Inshore Estuary River Lake/dam
Catch (x000)
0
20
40
60
80
100
120
140
Jun-Aug Sep-Nov Dec-Feb Mar-May
Catch (x000)
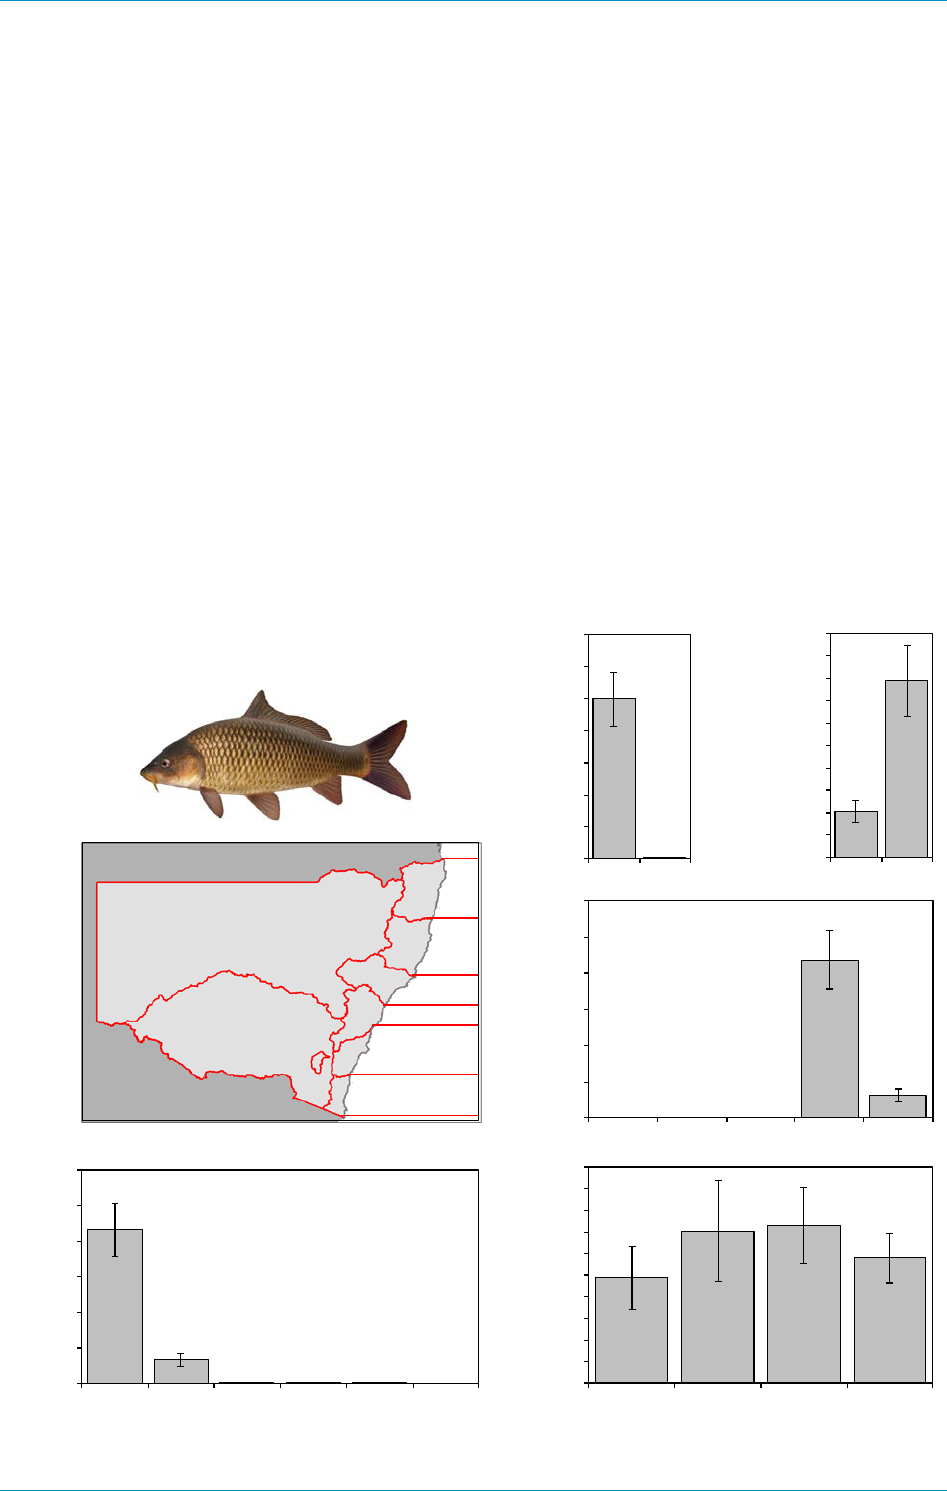
West et al. NSW/ACT Recreational Fishing Survey – 2013/14
56 NSW Department of Primary Industries, December 2015
European Carp
Over half (52%) of the total recreational catch of European Carp (Cyprinus carpio) was taken in
the Murray/South West fishing zone, closely followed by the Darling/North West (46%), then
Sydney and the ACT (at 1% each) (Figure 32A). Virtually all (99.7%) of the European Carp
caught were kept (Figure 32B) and shore-based fishing (79%) accounted for the majority of the
catch (Figure 32C). The vast majority of the catch was taken in freshwater rivers (87%), with the
remainder (13%) in freshwater lakes or dams (Figure 32D). Virtually all of the catch was taken
by line fishing – primarily using bait (86%) as opposed to lures (13%), with a minority (< 1%)
taken by various other methods (Figure 32E). The summer season (Dec-Feb) accounted for
29% of the catch, closely followed by spring (28%), autumn (23%) and winter (20%) (Figure
32F).
Figure 32 Characteristics of the recreational fishery for European Carp in NSW/ACT waters during
2013/14 – total catch (numbers kept and released) by residents by: A) proportion (%) by
fishing zone; B) kept and released; C) boat and shore-based fishing; D) water body
fished; E) fishing method; and F) seasonality. Error bars represent one standard error,
with equivalent data for A) fishing zones in Appendix 13.
12%
20%
14%
26%
26%
2%
A
B C
D
FE
European Carp
46%
52%
1%
1%
0
100
200
300
400
500
600
700
Kept Rel.
Catch (x000)
0
50
100
150
200
250
300
350
400
450
500
Boat Shore
Catch (x000)
0
100
200
300
400
500
600
Line-bait Line-lure Pot/trap Net Dive Other
Catch (x000)
0
100
200
300
400
500
600
Offshore Inshore Estuary River Lake/dam
Catch (x000)
0
20
40
60
80
100
120
140
160
180
200
Jun-Aug Sep-Nov Dec-Feb Mar-May
Catch (x000)

West et al. NSW/ACT Recreational Fishing Survey – 2013/14
57 NSW Department of Primary Industries, December 2015
Golden Perch
The majority of the total recreational catch of Golden Perch (Macquaria ambigua) was taken in
the Darling/North West fishing zone (51%), followed by the Murray/South West (41%), then the
Hunter (6%) and ACT (2%) (Figure 33A). Over half (54%) of all Golden Perch caught were kept
(Figure 33B) and boat-based fishing (56%) accounted for a similar proportion of the catch
(Figure 33C). Just over half of the catch was taken in freshwater rivers (54%), with the
remainder (46%) in freshwater lakes or dams (Figure 33D). Virtually all of the catch was taken
by line fishing – a majority using bait (69%) as opposed to lures (31%), with a small component
(<1%) taken by net (Figure 33E). The spring season (Sep-Nov) accounted for 40% of the catch,
followed by autumn (28%), summer (21%) and winter (12%) (Figure 33F).
Figure 33 Characteristics of the recreational fishery for Golden Perch in NSW/ACT waters during
2013/14 – total catch (numbers kept and released) by residents by: A) proportion (%) by
fishing zone; B) kept and released; C) boat and shore-based fishing; D) water body
fished; E) fishing method; and F) seasonality. Error bars represent one standard error,
with equivalent data for A) fishing zones in Appendix 13.
12%
20%
14%
26%
26%
2%
A
B C
D
FE
Golden Perch
6%
51%
41%
2%
0
10
20
30
40
50
60
70
80
90
100
Kept Rel.
Catch (x000)
0
10
20
30
40
50
60
70
80
90
100
Boat Shore
Catch (x000)
0
20
40
60
80
100
120
Line-bait Line-lure Pot/trap Net Dive Other
Catch (x000)
0
10
20
30
40
50
60
70
80
90
100
Offshore Inshore Estuary River Lake/dam
Catch (x000)
0
10
20
30
40
50
60
70
80
Jun-Aug Sep-Nov Dec-Feb Mar-May
Catch (x000)

West et al. NSW/ACT Recreational Fishing Survey – 2013/14
58 NSW Department of Primary Industries, December 2015
Murray Cod
The vast majority of the total recreational catch of Murray Cod (Maccullochella peelii) was taken
in the Murray/South West fishing zone (65%), followed by the Darling/North West (33%), and a
minority (1%) in the ACT (Figure 34A). The vast majority (87%) of all Murray Cod caught were
released (Figure 34B) and boat-based fishing accounted for over half (57%) of the catch (Figure
34C). The vast majority of the catch was taken in freshwater rivers (88%), with the remainder
(12%) in freshwater lakes and dams (Figure 34D). Virtually all of the catch was taken by line
fishing – mainly using bait (75%) as opposed to lures (25%), with a small component (<1%)
taken by net (Figure 34E). The summer season (Dec-Feb) accounted for close to half (48%) of
the catch, followed by autumn (30%), with a minority in spring (12%) and winter (10%) (Figure
34F).
Figure 34 Characteristics of the recreational fishery for Murray Cod in NSW/ACT waters during
2013/14 – total catch (numbers kept and released) by residents by: A) proportion (%) by
fishing zone; B) kept and released; C) boat and shore-based fishing; D) water body
fished; E) fishing method; and F) seasonality. Error bars represent one standard error,
with equivalent data for A) fishing zones in Appendix 13.
12%
20%
14%
26%
26%
2%
A
B C
D
FE
Murray Cod
33%
65%
1%
0
20
40
60
80
100
120
140
160
180
200
Kept Rel.
Catch (x000)
0
20
40
60
80
100
120
Boat Shore
Catch (x000)
0
20
40
60
80
100
120
140
160
Line-bait Line-lure Pot/trap Net Dive Other
Catch (x000)
0
20
40
60
80
100
120
140
160
180
Offshore Inshore Estuary River Lake/dam
Catch (x000)
0
20
40
60
80
100
120
Jun-Aug Sep-Nov Dec-Feb Mar-May
Catch (x000)

West et al. NSW/ACT Recreational Fishing Survey – 2013/14
59 NSW Department of Primary Industries, December 2015
Redfin Perch
Just over half (51%) of the total recreational catch of Redfin Perch (Perca fluviatilis) was taken in
the Darling/North West fishing zone, closely followed by the Murray/South West (44%), then the
ACT (4%), Mid North Coast (2%) and Sydney (1%) (Figure 35A). The majority (67%) of all
Redfin Perch caught were released (Figure 35B) and boat-based fishing (80%) accounted for
the vast majority of the catch (Figure 35C). The majority of the catch was taken in freshwater
lakes and dams (69%), with the remainder (31%) in freshwater rivers (Figure 35D). All of the
catch was taken by line fishing – with similar proportions using lures (51%) and bait (49%)
(Figure 35E). The summer season (Dec-Feb) accounted for the majority (63%) of the catch,
followed by spring (19%), autumn (12%) and winter (5%) (Figure 35F).
Figure 35 Characteristics of the recreational fishery for Redfin Perch in NSW/ACT waters during
2013/14 – total catch (numbers kept and released) by residents by: A) proportion (%) by
fishing zone; B) kept and released; C) boat and shore-based fishing; ; D) water body
fished; E) fishing method; and F) seasonality. Error bars represent one standard error,
with equivalent data for A) fishing zones in Appendix 13.
12%
20%
14%
26%
26%
2%
A
B C
D
FE
Redfin Perch
2%
51%
44%
1%
4%
0
20
40
60
80
100
120
140
160
Kept Rel.
Catch (x000)
0
20
40
60
80
100
120
140
160
180
Boat Shore
Catch (x000)
0
20
40
60
80
100
120
Line-bait Line-lure Pot/trap Net Dive Other
Catch (x000)
0
20
40
60
80
100
120
140
Offshore Inshore Estuary River Lake/dam
Catch (x000)
0
20
40
60
80
100
120
140
Jun-Aug Sep-Nov Dec-Feb Mar-May
Catch (x000)

West et al. NSW/ACT Recreational Fishing Survey – 2013/14
60 NSW Department of Primary Industries, December 2015
Trout
The vast majority of the total recreational catch of Brown and Rainbow Trout (Salmo trutta &
Oncorhynchus mykiss) was taken in the Murray/South West fishing zone (83%), followed by the
Sydney zone (16%), with a minority (1%) in the Darling/North West (Figure 36A). Note: brown
trout comprised just over half (54%) of the total trout catch and similar results were assessed for
each species in the analyses below – therefore the results have been grouped. The majority
(68%) of all trout caught were kept (Figure 36B) and boat-based fishing (58%) accounted for
over half of the catch (Figure 36C). The vast majority of the catch was taken in freshwater lakes
and dams (82%), with the remainder (18%) in freshwater rivers (Figure 36D). Virtually all of the
catch was taken by line fishing – primarily using lures (87%) as opposed to bait (13%) (Figure
36E). Very similar proportions of the catch occurred across the four seasons – ranging from
26% down to 24% (Figure 36F).
Figure 36 Characteristics of the recreational fishery for trout in NSW during 2013/14 – total catch
(numbers kept and released) by NSW/ACT residents by: A) proportion (%) by fishing
zone; B) kept and released; C) boat and shore-based fishing; D) water body fished; E)
fishing method; and F) seasonality. Error bars represent one standard error, with
equivalent data for A) fishing zones in Appendix 13.

West et al. NSW/ACT Recreational Fishing Survey – 2013/14
61 NSW Department of Primary Industries, December 2015
Blue Swimmer Crab
Over half (53%) of the recreational catch of Blue Swimmer Crab (Portunus pelagicus) was taken
in the Hunter fishing zone, followed by the Mid South Coast (19%), North Coast (16%), Mid
North Coast (7%), Sydney (4%) and South Coast (1%) (Figure 37A). The majority (69%) of all
Blue Swimmer Crabs caught were kept (Figure 37B) and boat-based fishing (51%) accounted
for just over half of the catch (Figure 37C). Virtually all of the catch was taken in estuarine
waters (99%), with a minority (1%) in inshore coastal waters (Figure 37D). The majority of the
catch was taken by pots/traps (69%), followed by line fishing (25%) and nets (6%) (Figure 37E).
The summer season (Dec-Feb) accounted for over half (54%) of the catch, followed by autumn
(39%), with minorities in spring (6%) and winter (1%) (Figure 37F).
Figure 37 Characteristics of the recreational fishery for Blue Swimmer Crab in NSW during 2013/14
– total catch (numbers kept and released) by NSW/ACT residents by: A) proportion (%)
by fishing zone; B) kept and released; C) boat and shore-based fishing; D) water body
fished; E) fishing method; and F) seasonality. Error bars represent one standard error,
with equivalent data for A) fishing zones in Appendix 13.
12%
20%
14%
26%
26%
2%
A
B C
D
FE
Blue Swimmer Crab
16%
7%
53%
19%
4%
1%
0
10
20
30
40
50
60
70
Kept Rel.
Catch (x000)
0
10
20
30
40
50
60
Boat Shore
Catch (x000)
0
10
20
30
40
50
60
70
80
Line-bait Line-lure Pot/trap Net Dive Other
Catch (x000)
0
10
20
30
40
50
60
70
80
90
100
Offshore
Inshore
Estuary River
Lake/dam
Catch (x000)
0
10
20
30
40
50
60
Jun-Aug
Sep-Nov Dec-Feb Mar-May
Catch (x000)

West et al. NSW/ACT Recreational Fishing Survey – 2013/14
62 NSW Department of Primary Industries, December 2015
Mud Crab
The North Coast fishing zone accounted for 43% of the total recreational catch of Mud Crab
(Scylla spp.), closely followed by Mid North Coast (35%), then the Hunter (13%) and Sydney
(9%) (Figure 38A). A majority (62%) of all Mud Crabs caught were kept (Figure 38B) and shore-
based fishing (58%) accounted for over half of the catch (Figure 38C). The entire catch (100%)
was taken in estuarine waters (Figure 38D). The vast majority of the catch was taken by
pots/traps (95%), with minorities by line fishing (3%) and nets (2%) (Figure 38E). The summer
season (Dec-Feb) accounted for a high proportion (43%) of the catch, closely followed by
autumn (37%), with minorities in spring (14%) and winter (6%) (Figure 38F).
Figure 38 Characteristics of the recreational fishery for Mud Crab in NSW during 2013/14 – total
catch (numbers kept and released) by NSW/ACT residents by: A) proportion (%) by
fishing zone; B) kept and released; C) boat and shore-based fishing; D) water body
fished; E) fishing method; and F) seasonality. Error bars represent one standard error,
with equivalent data for A) fishing zones in Appendix 13.
12%
20%
14%
26%
26%
2%
A
B C
D
FE
Mud Crab
43%
35%
13%
9%
0
5
10
15
20
25
30
35
40
45
Kept Rel.
Catch (x000)
0
5
10
15
20
25
30
35
40
45
Boat Shore
Catch (x000)
0
10
20
30
40
50
60
70
Line-bait Line-lure Pot/trap Net Dive Other
Catch (x000)
0
10
20
30
40
50
60
70
Offshore Inshore Estuary River Lake/dam
Catch (x000)
0
5
10
15
20
25
30
35
Jun-Aug Sep-Nov Dec-Feb Mar-May
Catch (x000)

West et al. NSW/ACT Recreational Fishing Survey – 2013/14
63 NSW Department of Primary Industries, December 2015
Yabby (freshwater)
Half (50%) of the total recreational catch of yabbies (Cherax spp.) was taken in the Darling/North
West fishing zone, followed by the Murray/South West (24%), the Hunter (17%) and Sydney
(9%) (Figure 39A). The vast majority (87%) of all yabbies caught were kept (Figure 39B) and
shore-based fishing (99.8%) accounted for virtually all of the catch (Figure 39C). Two-thirds of
the catch was taken in freshwater lakes and dams (67%), with the remainder (33%) in
freshwater rivers (Figure 39D). The majority of the catch was taken by pots/traps (65%),
followed by nets (32%), with minorities by line fishing (3%) and other methods (< 1%) (Figure
39E). The summer season (Dec-Feb) accounted for over a third (38%) of the catch, closely
followed by winter (37%), autumn (15%) and spring (11%) (Figure 39F).
Figure 39 Characteristics of the recreational fishery for freshwater yabbies in NSW during 2013/14 –
total catch (numbers kept and released) by NSW/ACT residents by: A) proportion (%) by
fishing zone; B) kept and released; C) boat and shore-based fishing; D) water body
fished; E) fishing method; and F) seasonality. Error bars represent one standard error,
with equivalent data for A) fishing zones in Appendix 13.

West et al. NSW/ACT Recreational Fishing Survey – 2013/14
64 NSW Department of Primary Industries, December 2015
Regional Fisheries
In this section, fishing effort (fisher days) is evaluated within the main fishing zones (refer Figure
3, Appendix 13) in the context of where fishers reside (residential strata, Figure 2), providing a
broad assessment of ‘imported’ fishing effort. Fishing effort has also been assessed in terms of
water body type and platform (as summarised in Appendices 6 and 10, respectively). The total
catch of key species for each fishing zone has also been assessed (Appendix 13).
Catch and effort information was provided by fishers during the Diary Survey and is presented
as expanded estimates for the resident population of NSW and the ACT aged five years and
older (as at June 2013) and their recreational fishing activity during the period June 2013 to May
2014.
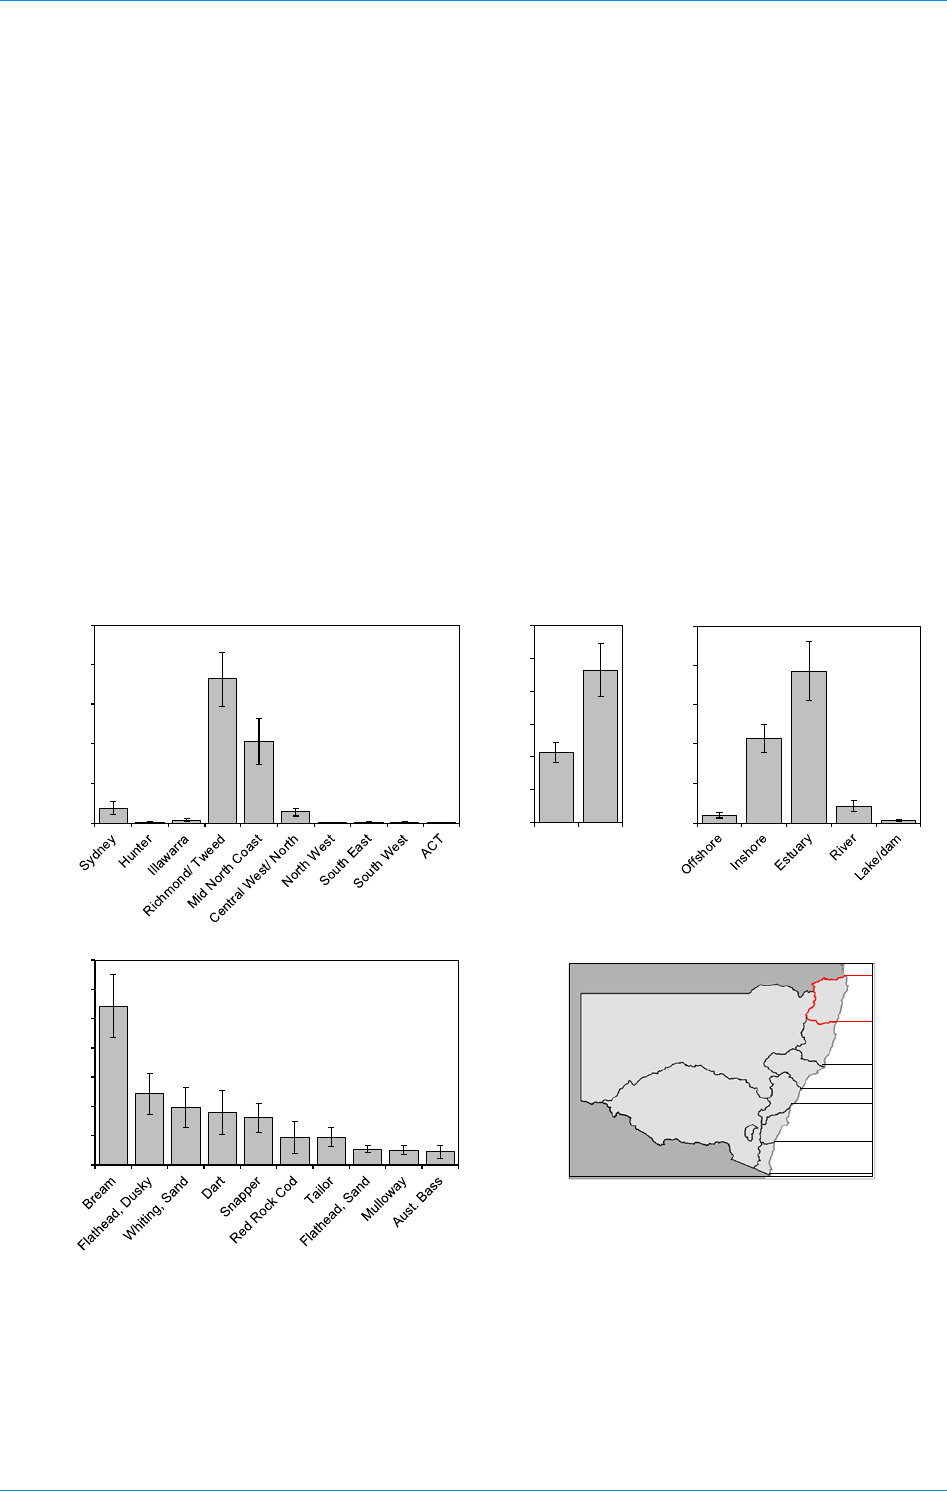
West et al. NSW/ACT Recreational Fishing Survey – 2013/14
65 NSW Department of Primary Industries, December 2015
North Coast Fishing Zone
The vast majority (88%) of recreational fishing effort (fisher days) in the North Coast fishing
zone (see map below) was attributable to local or nearby residents, namely the
Richmond/Tweed stratum (56%) and the Mid North Coast (32%) – with Sydney (6%) and the
Central West/North (4%) accounting for most of the remainder (Figure 40A).
A majority (68%) of all fisher days were shore-based (68%) (Figure 40B) and total effort was
concentrated in estuarine waters (58%), followed by inshore coastal waters (32%), freshwater
rivers (6%), offshore waters (3%) and freshwater lakes/dams (1%) (Figure 40C).
Bream was the most common species caught (33%), followed by dusky flathead (15%), sand
whiting (12%), swallowtail dart (11%), snapper (10%), red rock cod and tailor (at 6% each), with
a range of other species at < 4% each (Figure 40D).
Figure 40 Characteristics of the North Coast recreational fishery based on 2013/14 fishing activity by
NSW/ACT residents aged five years and older: A) fishing effort (fisher days) by residential
stratum; B) fisher days by platform; C) fisher days by water body type; and D) total catch
(numbers) for the key species. Error bars represent one standard error.
0
50
100
150
200
250
Fisher days (x000)
A B C
D
NORTH COAST
0
50
100
150
200
250
Fisher days (x000)
0
50
100
150
200
250
300
Boat Shore
Fisher days (x000)
0
50
100
150
200
250
300
350
Catch (x000)

West et al. NSW/ACT Recreational Fishing Survey – 2013/14
66 NSW Department of Primary Industries, December 2015
Mid North Coast Fishing Zone
A significant proportion of recreational fishing effort (fisher days) in the Mid North Coast fishing
zone (see map below) was attributable to local residents, namely the Mid North Coast stratum
(44%), followed by Sydney (29%), the Hunter (12%) – with the Central West/North (6%) and
Illawarra (5%) accounting for most of the remainder (Figure 41A).
A majority (67%) of all fisher days were shore-based (Figure 41B) and total effort was
concentrated in estuarine waters (66%), followed by inshore coastal waters (30%), with all other
water body types at < 3% each (Figure 41C).
Bream was the most common species caught (39%), followed by dusky flathead (15%), sand
flathead, (12%), tailor (10%), sand whiting (6%), prawns (6% by number) and snapper (5%), with
a range of other species at < 4% each (Figure 41D).
Figure 41 Characteristics of the Mid North Coast recreational fishery based on 2013/14 fishing
activity by NSW/ACT residents aged five years and older: A) fishing effort (fisher days) by
residential stratum; B) fisher days by platform; C) fisher days by water body type; and D)
total catch (numbers) for the key species. Error bars represent one standard error.
0
50
100
150
200
250
Fisher days (x000)
MID NORTH
COAST
A B C
D
0
50
100
150
200
250
300
350
400
Fisher days (x000)
0
50
100
150
200
250
300
350
400
Boat Shore
Fisher days (x000)
0
100
200
300
400
500
600
Catch (x000)

West et al. NSW/ACT Recreational Fishing Survey – 2013/14
67 NSW Department of Primary Industries, December 2015
Hunter Fishing Zone
The vast majority (92%) of recreational fishing effort (fisher days) in the Hunter fishing zone (see
map below) was attributable to local or nearby residents, namely the Hunter stratum (52%) and
Sydney (40%) – with the Central West/North (4%) accounting for half of the remainder (Figure
42A).
Around half (51%) of all fisher days were boat-based (Figure 42B) and total effort was
concentrated in estuarine waters (63%), followed by inshore coastal waters (25%), freshwater
lakes/dams (9%), with freshwater rivers and offshore waters at < 2% each (Figure 42C).
Bream was the most common species caught (21%), followed by prawns (13%, by number),
then similar proportions (11% down to 9%) for snapper, sand whiting, dusky flathead, trumpeter
whiting and sand flathead, with a range of other species at < 4% each (Figure 42D).
Figure 42 Characteristics of the Hunter recreational fishery based on 2013/14 fishing activity by
NSW/ACT residents aged five years and older: A) fishing effort (fisher days) by residential
stratum; B) fisher days by platform; C) fisher days by water body type; and D) total catch
(numbers) for the key species. Error bars represent one standard error.
0
50
100
150
200
250
300
Fisher days (x000)
A B C
D
HUNTER
0
50
100
150
200
250
300
350
400
Fisher days (x000)
0
50
100
150
200
250
300
350
Boat Shore
Fisher days (x000)
0
50
100
150
200
250
300
350
400
Catch (x000)

West et al. NSW/ACT Recreational Fishing Survey – 2013/14
68 NSW Department of Primary Industries, December 2015
Sydney Fishing Zone
The vast majority of recreational fishing effort (fisher days) in the Sydney fishing zone (see map
below) was attributable to local residents, namely the Sydney stratum (91%), with the Hunter
(4%) and Illawarra (3%) accounting for most of the remainder (Figure 43A).
Over half (53%) of all fisher days were shore-based (Figure 43B) and total effort was
concentrated in estuarine waters (80%), followed by inshore coastal waters (12%), with all other
water body types at < 4% each (Figure 43C).
Bream was the most common species caught (38%), followed by snapper (17%), sand flathead
(15%), dusky flathead (9%), then mulloway, tailor and luderick (at 4% each) and a range of other
species at 3% each, or less (Figure 43D).
Figure 43 Characteristics of the Sydney recreational fishery based on 2013/14 fishing activity by
NSW/ACT residents aged five years and older: A) fishing effort (fisher days) by residential
stratum; B) fisher days by platform; C) fisher days by water body type; and D) total catch
(numbers) for the key species. Error bars represent one standard error.
0
100
200
300
400
500
600
700
Fisher days (x000)
A B C
D
SYDNEY
0
100
200
300
400
500
600
Fisher days (x000)
0
50
100
150
200
250
300
350
400
Boat Shore
Fisher days (x000)
0
100
200
300
400
500
600
700
800
Catch (x000)

West et al. NSW/ACT Recreational Fishing Survey – 2013/14
69 NSW Department of Primary Industries, December 2015
Mid South Coast Fishing Zone
The majority (77%) of recreational fishing effort (fisher days) in the Mid South Coast fishing
zone (see map below) was attributable to local or nearby residents, namely the Illawarra stratum
(47%) and Sydney (30%) – with the ACT (10%) and South East (8%) accounting for most of the
remainder (Figure 44A).
A majority (58%) of all fisher days were shore-based (Figure 44B) and total effort was
concentrated in estuarine waters (62%), followed by inshore coastal waters (32%), with all other
water body types at < 4% each (Figure 44C).
Bream was the most common species caught (22%), followed by prawns (18%, by number),
sand flathead (15%), dusky flathead (13%), luderick (12%), then sand whiting and snapper (at
7% each), with a range of other species at < 3% each (Figure 44D).
Figure 44 Characteristics of the Mid South Coast recreational fishery based on 2013/14 fishing
activity by NSW/ACT residents aged five years and older: A) fishing effort (fisher days) by
residential stratum; B) fisher days by platform; C) fisher days by water body type; and D)
total catch (numbers) for the key species. Error bars represent one standard error.
0
50
100
150
200
250
300
350
400
Fisher days (x000)
A B C
D
MID SOUTH COAST
0
100
200
300
400
500
600
Fisher days (x000)
0
50
100
150
200
250
300
350
400
450
500
Boat Shore
Fisher days (x000)
0
100
200
300
400
500
600
700
800
900
Catch (x000)

West et al. NSW/ACT Recreational Fishing Survey – 2013/14
70 NSW Department of Primary Industries, December 2015
South Coast Fishing Zone
The majority of recreational fishing effort (fisher days) in the South Coast fishing zone (see map
below) was attributable to local or nearby residents, namely the South East stratum (32%) and
the ACT (28%) – followed by the Illawarra (17%), with Sydney and the Hunter (at 7% each)
accounting for most of the remainder (Figure 45A).
A majority (61%) of all fisher days were boat-based (Figure 45B) and total effort was
concentrated in estuarine waters (71%), followed by inshore coastal waters (28%), with all other
water body types totalling < 1% (Figure 45C).
Dusky flathead was the most common species caught (38%), followed by sand flathead (17%),
bream (12%), then tailor, snapper and sand whiting (at 7% each), Australian salmon (5%), with a
range of other species at < 3% each (Figure 45D).
Figure 45 Characteristics of the South Coast recreational fishery based on 2013/14 fishing activity
by NSW/ACT residents aged five years and older: A) fishing effort (fisher days) by
residential stratum; B) fisher days by platform; C) fisher days by water body type; and D)
total catch (numbers) for the key species. Error bars represent one standard error.
0
10
20
30
40
50
60
Fisher days (x000)
A B C
D
SOUTH COAST
0
20
40
60
80
100
120
Fisher days (x000)
0
20
40
60
80
100
120
Boat Shore
Fisher days (x000)
0
50
100
150
200
250
Catch (x000)

West et al. NSW/ACT Recreational Fishing Survey – 2013/14
71 NSW Department of Primary Industries, December 2015
Murray/South West Fishing Zone
A significant proportion of recreational fishing effort (fisher days) in the Murray/South West
fishing zone (see map below) was attributable to local residents, namely the South West stratum
(46%), followed by the South East (15%), Central West/North (13%), the ACT (12%), Sydney
(7%), Illawarra (3%), with the four remaining strata at 1% each (Figure 46A).
A majority (58%) of all fisher days were shore-based (Figure 46B) and total effort was mainly in
freshwater rivers (54%), with the remainder in freshwater lakes and dams (46%) (Figure 46C).
European carp was the most common species caught (29%), followed by shrimp (24% by
numbers), trout (15%), Murray cod (12%), then yabbies, redfin perch and golden perch – all at
7% each (Figure 46D).
Figure 46 Characteristics of the Murray/South West recreational fishery based on 2013/14 fishing
activity by NSW/ACT residents aged five years and older: A) fishing effort (fisher days) by
residential stratum; B) fisher days by platform; C) fisher days by by platform; C) fisher
days by water body type; and D) total catch (numbers) for the key species. Error bars
represent one standard error.
0
20
40
60
80
100
120
140
160
180
Fisher days (x000)
A B C
D
MURRAY/SOUTH WEST
0
50
100
150
200
250
Fisher days (x000)
0
50
100
150
200
250
Boat Shore
Fisher days (x000)
0
50
100
150
200
250
300
350
400
Catch (x000)

West et al. NSW/ACT Recreational Fishing Survey – 2013/14
72 NSW Department of Primary Industries, December 2015
Darling/North West Fishing Zone
A significant proportion of recreational fishing effort (fisher days) in the Darling/North West
fishing zone (see map below) was attributable to local and nearby residents, namely the Central
West/North stratum (40%) and the North West (21%) – with Sydney (13%), the Mid North Coast
(11%) and South West (10%) accounting for most of the remainder (Figure 47A).
A majority (62%) of all fisher days were shore-based (Figure 47B) and total effort was
concentrated in freshwater rivers (60%), with the remainder in freshwater lakes and dams (40%)
(Figure 47C).
European carp was the most common species caught (32%), followed by shrimp (22% by
numbers), yabbies (19%), golden perch (10%), redfin perch (9%), Murray cod (8%) and trout at
< 1% (Figure 47D).
Figure 47 Characteristics of the Darling/North West recreational fishery based on 2013/14 fishing
activity by NSW/ACT residents aged five years and older: A) fishing effort (fisher days) by
residential stratum; B) fisher days by platform; C) fisher days by water body type; and D)
total catch (numbers) for the key species. Error bars represent one standard error.
0
10
20
30
40
50
60
70
80
90
100
Fisher days (x000)
A B C
D
DARLING/NORTH WEST
0
20
40
60
80
100
120
140
160
Fisher days (x000)
0
20
40
60
80
100
120
140
160
Boat Shore
Fisher days (x000)
0
50
100
150
200
250
300
Catch (x000)

West et al. NSW/ACT Recreational Fishing Survey – 2013/14
73 NSW Department of Primary Industries, December 2015
The ACT Fishing Zone
All of the recreational fishing effort (fisher days) in the ACT fishing zone (see map below) was
attributable to local and nearby residents, namely the ACT stratum (89%) and the South East
(11%) (Figure 48A).
Two-thirds (66%) of all fisher days were shore-based (Figure 48B) and total effort was mainly in
freshwater lakes and dams (57%), with the remainder in freshwater rivers (43%) (Figure 48C).
Redfin perch was the most common species caught (35%), followed by European carp (27%),
golden perch (20%) and Murray cod (18%) (Figure 48D).
Figure 48 Characteristics of the ACT recreational fishery based on 2013/14 fishing activity by
NSW/ACT residents aged five years and older: A) fishing effort (fisher days) by residential
stratum; B) fisher days by platform; C) fisher days by water body type; and D) total
catch (numbers) for the key species. Error bars represent one standard error.
0
1
2
3
4
5
6
7
8
Fisher days (x000)
A B C
D
ACT
0
1
2
3
4
5
6
Fisher days (x000)
0
1
2
3
4
5
6
Boat Shore
Fisher days (x000)
0
1
2
3
4
5
6
7
8
Catch (x000)

West et al. NSW/ACT Recreational Fishing Survey – 2013/14
74 NSW Department of Primary Industries, December 2015
Boat Ownership and Vessel Characteristics
General boat ownership was assessed for all NSW/ACT households in the Screening Survey.
However by design, detailed boat profiling information was assessed for households reporting
fishing activity during 2013/14, as part of the Wash-up/Attitudinal Survey. This information
included length of the boat, main propulsion method, usage for fishing, navigational and fishing
aids, mode of storage and market value. In all cases, this information has been expanded to
represent the resident population of NSW and the ACT as at June 2013. However, data from
the Screening Survey refer to boat ownership as at June 2013, whereas the latter information
refers to boat ownership as at the end of the diary period (May 2014) and therefore provides a
detailed assessment of the NSW/ACT recreational fishing fleet. Note: eligible boats included
canoes, kayaks, jet skis/personal water craft (PWC) – but excluded surfboards and windsurfers,
plus any vessel incapable of carrying at least one person (e.g. toy/model boats).
Household Boat Ownership – June 2013
Details of boat ownership from the Screening Survey are provided in Appendix 15 and
summarised in Figure 49. As at June 2013, an estimated 320,818 (SE 11,381) NSW/ACT
resident households owned at least one boat, representing an overall boat ownership rate of
11%. A substantially higher boat ownership rate (38%) emerged for those households with any
fishing activity in NSW/ACT waters in the 12 months prior to June 2013 – whereas the
ownership rate among non-fishing households was only 6% (Appendix 15). Boat ownership
rates among fishing households varied by residential stratum, ranging from 60% in the Mid North
Coast down to 29% in the ACT. Among non-fishing households, boat ownership rates ranged
from 11% in the North West down to 4% in the ACT (Figure 49).
Figure 49 Proportion (%) of fisher and non-fisher households in NSW and the ACT reporting boat
ownership as at June 2013, by residential stratum. Error bars represent one standard
error.
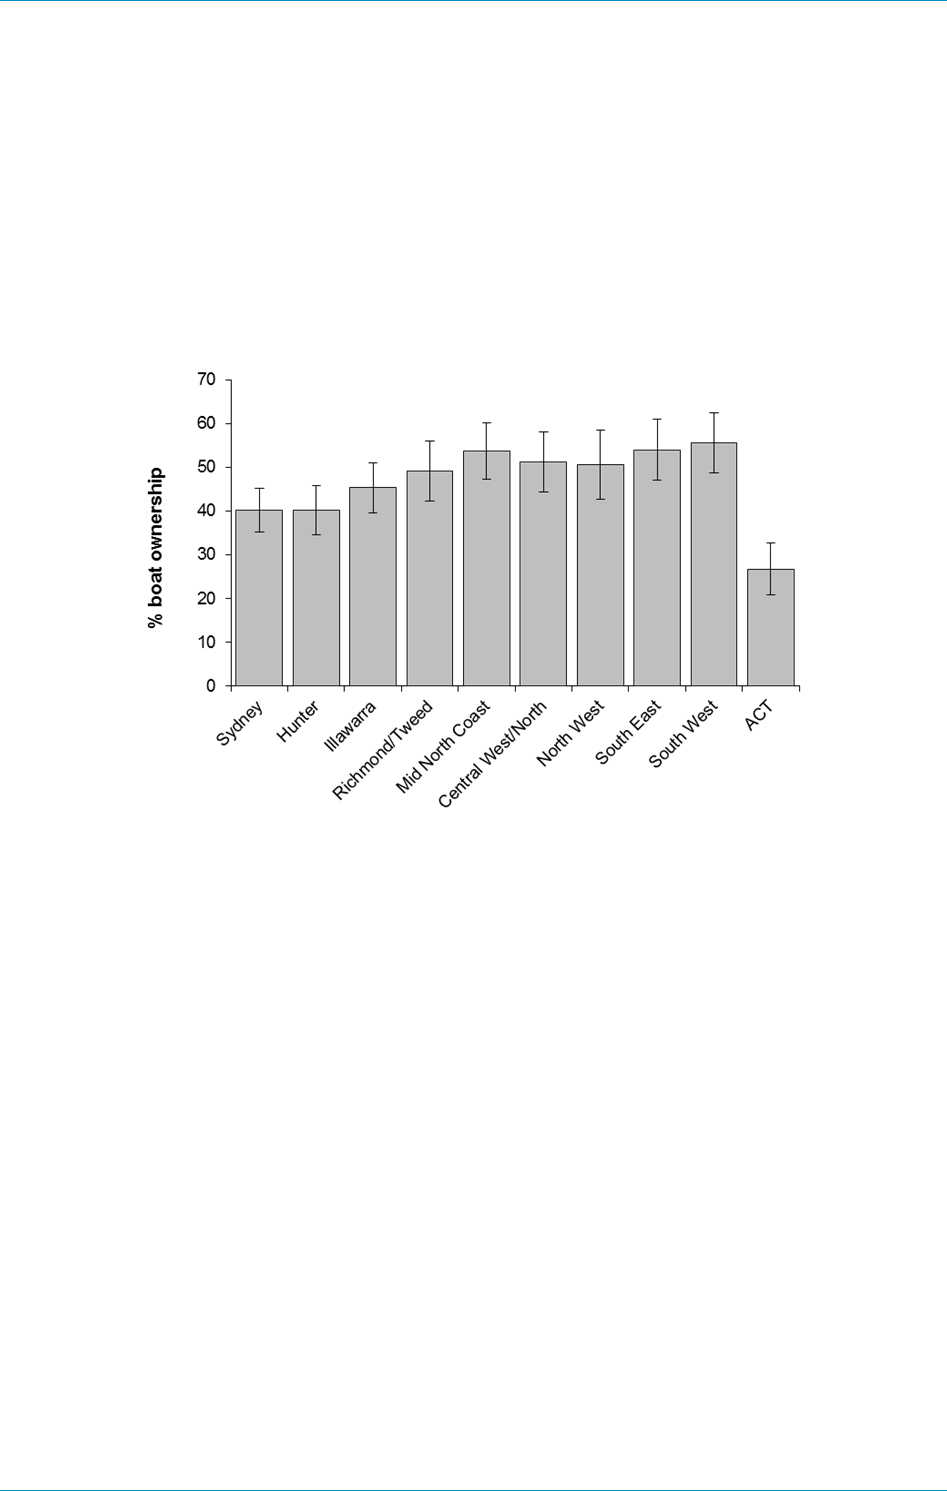
West et al. NSW/ACT Recreational Fishing Survey – 2013/14
75 NSW Department of Primary Industries, December 2015
Boats used for Recreational Fishing – June 2013 to May 2014
As noted above, boat ownership was also assessed through the Wash-up/Attitudinal Survey
among households that completed the Diary Survey and fished during the 12 month period. In
response, an estimated 180,622 (SE 10,322) or 44% of households that fished in NSW/ACT
waters reported ownership of at least one boat, for a total of 230,118 (SE 13,435) boats of any
kind – representing a mean of 1.27 boats per fisher household (Figure 50, Appendix 16).
Figure 50 Proportion (%) of NSW/ACT fisher households reporting boat ownership as at May 2014,
by residential stratum. Error bars represent one standard error.
Of the 230,118 boats owned by fisher households as at May 2014, an estimated 173,895 (SE
10,873) or 76% were used for recreational fishing at least once during the diary period (Figure
51, Appendix 17). Consistent with population size and numbers of fishing households, the
largest number of boats used for fishing was in the Sydney stratum (62,562), with the smallest in
the North West (3,983). However, the proportions of all boats owned by fishing households that
were used for fishing in 2013/14 ranged from 92% for the Illawarra stratum down to 66% for the
Richmond/Tweed (Appendix 17). The remainder of this section focuses on the above 173,895
boats, identified as the recreational fishing ‘fleet’ for 2013/14.

West et al. NSW/ACT Recreational Fishing Survey – 2013/14
76 NSW Department of Primary Industries, December 2015
Figure 51 Number of boats owned by NSW/ACT fisher households and used for recreational fishing
in 2013/14, by residential stratum. Error bars represent one standard error.
Recreational Fishing Boat Profiles
Size of Boats
For each fishing boat, the overall (‘gunwale’) length was reported and appropriate length
groupings applied (in metres). Analysis of these results for the 173,895 fishing boats by
residential stratum is contained in Appendix 18. In summary, the 4-4.9 metre length grouping
accounted for 40% of all fishing boats (68,862; SE 6,500), followed by 26% for the < 4 metres
group (44,641; SE 4,549) and a similar estimate (26%) for the 5-5.9 metres group (44,459; SE
5,127). A minority of all boats were in the larger groups – 5% in the 7 metres plus group (8,259;
SE 2,720) and 4% in the 6-6.9 metres group (7,673, SE 1,871).
Usage Levels for Recreational Fishing
For each fishing boat, proportional usage for recreational fishing, as opposed to other activities
(e.g. water skiing) was assessed for the diary period, with an average of 82% usage for fishing
reported for all boats. Based on usage groupings, a majority of all boats (59%) were reported as
being used exclusively for recreational fishing, followed by a quarter (25%) with 50-99% usage
for fishing and a minority (16%) with less than 50% usage (Table 12). In terms of exclusive
usage for fishing, the proportions were higher for boats smaller than 5 metres (67-68%) than for
the 5-5.9 metres group (48%) and the larger boats (28-31%). Note: further information on usage
proportions and ‘attribution’ levels is provided in ’Market Value of Fishing Boats’ (Page 79).

West et al. NSW/ACT Recreational Fishing Survey – 2013/14
77 NSW Department of Primary Industries, December 2015
Table 12 Numbers of fishing boats by overall length (grouped) and proportion of all usage for
recreational fishing in 2013/14, i.e. boats owned by NSW/ACT resident fishing
households. SE is standard error; values in bold indicate relative standard error > 40%;
values in italics indicate fewer than 30 households reporting boat ownership. SE is
standard error; values in bold indicate relative standard error > 40%; values in italics
indicate fewer than 30 households reporting boat ownership.
Overall
length
<50% fishing
50-99% fishing
100% fishing
Number
SE
% (row)
Number
SE
% (row)
Number
SE
% (row)
< 4m
7,037
1,946
15.8
7,692
1,710
17.2
29,912
3,669
67.0
4-4.9m
5,312
1,974
7.7
16,585
3,765
24.1
46,966
4,961
68.2
5-5.9m
7,262
2,086
16.3
15,739
3,365
35.4
21,458
3,309
48.3
6-6.9m
2,720
1,480
35.4
2,788
882
36.3
2,165
728
28.2
7m plus
5,501
2,584
66.6
195
147
2.4
2,563
838
31.0
Total
27,833
4,558
16.0
42,998
5,708
24.7
103,064
7,777
59.3
Main Propulsion
Each fishing boat was classified according to the primary propulsion method, with jetskis/PWC
separated from all power craft. The vast majority (close to 83%) of all recreational fishing boats
were power craft of some kind (Table 13). However, among the smallest size group (< 4
metres), a significant proportion (43%) were row boats, canoes, kayaks etc, with sailing boats a
minority of all fishing craft (1%).
Table 13 Numbers of fishing boats by overall length (grouped) and main propulsion method - i.e.
boats used for recreational fishing in 2013/14 and owned by NSW/ACT resident fishing
households. SE is standard error; values in bold indicate relative standard error > 40%;
values in italics indicate fewer than 30 households reporting boat ownership.
Overall
length
Jetski/PWC
Other Power
Row/paddle
Sail
No.
SE
%
(row)
No.
SE
%
(row)
No.
SE
%
(row)
No.
SE
%
(row)
< 4m
838
501
1.9
24,562
3,045
55.0
19,241
3,204
43.1
4-4.9m
60,095
5,956
87.3
8,383
2,600
12.2
384
377
0.6
5-5.9m
43,529
5,095
97.9
930
525
2.1
6-6.9m
7,673
1,871
100.0
7m plus
6,915
2,424
83.7
1,344
1,242
16.3
Total
838
501
0.5
142,774
9,408
82.1
28,554
4,247
16.4
1,728
1,297
1.0

West et al. NSW/ACT Recreational Fishing Survey – 2013/14
78 NSW Department of Primary Industries, December 2015
Boat Storage and Access
Over three-quarters (77%) of all recreational fishing boats were trailer boats, followed by ‘car
toppers’ (12%), then shore-based (8%) and those on marinas/moorings (3%) (Table 14).
Whereas trailer boats covered the range of size groups, ‘car-toppers’ and shore-based boats
were predominantly in the smaller size groups (mostly less than 5 metres). Boats kept on
marinas or moorings were all in the larger size groups (6 metres or more).
Table 14 Numbers of fishing boats by overall length (grouped) and main storage/access mode - i.e.
boats used for recreational fishing in 2013/14 and owned by NSW/ACT resident fishing
households. SE is standard error; values in bold indicate relative standard error > 40%;
values in italics indicate fewer than 30 households reporting boat ownership.
Overall
length
Trailer
Marina/mooring
Car topper
Shore-based
No.
SE
%
(row)
No.
SE
%
(row)
No.
SE
%
(row)
No.
SE
%
(row)
< 4m
20,440
2,888
45.8
15,128
2,689
33.9
9,072
2,085
20.3
4-4.9m
58,762
5,855
85.3
5,358
1,827
7.8
4,742
2,084
6.9
5-5.9m
43,845
5,107
98.6
168
167
0.4
446
442
1.0
6-6.9m
7,320
1,855
95.4
353
249
4.6
7m plus
3,205
1,601
38.8
5,054
2,203
61.2
Total
133,573
9,019
76.8
5,407
2,217
3.1
20,654
3,358
11.9
14,260
3,044
8.2
Electronic Fishing Aids
For each fishing boat, the availability of echo-sounders (‘fish finders’) and global positioning
systems (GPS) was assessed – whether as fixtures to the vessel or in portable form. In
response, echo sounder availability was reported for 56% of all recreational fishing boats, with
the highest rate (92%) in the 5-5.9 metre group and the lowest rate (16%) in the < 4 metre group
(Table 15). GPS availability was reported for 39% of all recreational fishing boats, with the
highest rate (69%) in the 5-5.9 metre group and the lowest rate (12%) in the < 4 metre group
(Table 16).
Table 15 Numbers of fishing boats by overall length (grouped) and echo sounder/fish finder
availability, i.e. boats used for recreational fishing in 2013/14 and owned by NSW/ACT
resident fishing households. SE is standard error; values in bold indicate relative standard
error > 40%; values in italics indicate fewer than 30 households reporting boat ownership.
Overall length
Echo sounder
No echo sounder
Number
SE
% (row)
Number
SE
% (row)
< 4m
6,922
1,626
15.5
37,719
4,255
84.5
4-4.9m
37,923
4,324
55.1
30,940
4,863
44.9
5-5.9m
40,839
4,987
91.9
3,621
1,191
8.1
6-6.9m
6,589
1,784
85.9
1,084
566
14.1
7m plus
5,409
1,979
65.5
2,850
1,872
34.5
Total
97,681
7,462
56.2
76,214
7,148
43.8

West et al. NSW/ACT Recreational Fishing Survey – 2013/14
79 NSW Department of Primary Industries, December 2015
Table 16 Numbers of fishing boats by overall length (grouped) and global positioning system (GPS)
availability, i.e. boats used for recreational fishing in 2013/14 and owned by NSW/ACT
resident fishing households. SE is standard error; values in bold indicate relative standard
error > 40%; values in italics indicate fewer than 30 households reporting boat ownership.
Overall length
GPS
No GPS
Number
SE
% (row)
Number
SE
% (row)
< 4m
5,267
1,537
11.8
39,374
4,291
88.2
4-4.9m
24,052
4,097
34.9
44,811
5,070
65.1
5-5.9m
30,471
4,274
68.5
13,988
2,870
31.5
6-6.9m
4,635
1,119
60.4
3,038
1,499
39.6
7m plus
3,896
1,486
47.2
4,363
2,282
52.8
Total
68,320
6,792
39.3
105,574
8,043
60.7
Market Value of Fishing Boats
For each fishing boat, the current market value (or replacement cost) was provided by
respondents – therefore enabling estimation of the total market value of the recreational fishing
fleet (Table 17). Also, as discussed in ’Usage Levels for Recreational Fishing’ (Page 76), each
boat was assessed in terms of the proportion of total usage (time) during the diary period, that
was attributable to recreational fishing (as opposed to other activities, e.g. water skiing). The
resultant ‘% attribution’ was applied to the total value for each boat to produce ‘attributed’ values.
i.e. directly attributed to recreational fishing (Table 17).
The estimated total market value of all boats used by residents for recreational fishing in NSW
and the ACT during 2013/14 exceeds $1.53 billion, at an average of over $8,800 per boat.
Around three quarters (74%) of the total value was directly attributed to recreational fishing –
totalling over $1.13 billion (Table 17). The majority (72%) of the total attributed value refers to
boats between 4 and 5.9 metres in length. While the average attributed value was over $6,500
per boat, this was naturally dependent on size – ranging from around $1,600 for boats under 4
metres to over $16,000 for vessels in the 6-6.9 metre group.
Table 17 Numbers of fishing boats by overall length (grouped) and market value (total and
attributed to fishing), i.e. boats used for recreational fishing in 2013/14 and owned by
NSW/ACT resident fishing households. SE is standard error; values in bold indicate
relative standard error > 40%; values in italics indicate fewer than 30 households reporting
boat ownership.
Overall
length
Total value ($)
Attrib-
ution
rate (%)
Attributed value ($)
Total
SE
Average
per boat
Total
SE
Average
per boat
< 4m
83,669,733
9,608,674
1,874
86.6
72,442,707
9,053,972
1,623
4-4.9m
396,881,361
44,405,436
5,763
86.5
343,155,311
39,902,947
4,983
5-5.9m
595,435,141
74,593,480
13,393
79.5
473,293,062
60,690,727
10,646
6-6.9m
198,825,850
48,976,038
25,912
62.2
123,738,690
31,964,175
16,127
7m plus
259,903,368
95,557,089
31,468
45.9
119,320,381
37,606,728
14,447
Total
1,534,715,453
139,360,921
8,826
73.8
1,131,950,151
89,961,249
6,509

West et al. NSW/ACT Recreational Fishing Survey – 2013/14
80 NSW Department of Primary Industries, December 2015
Other Results: Wash-up/Attitudinal Survey
The opinions and attitudes of diarists were obtained in this survey in terms of various fishing-
related matters, from the main/key fisher in each household, aged 15 years and older.
The majority of the results in this section have been presented as expanded estimates for
resident households (as at June 2013), with recreational fishing activity in NSW/ACT waters
during the period June 2013 to May 2014. In total, this equates to 410,059 fishing households.
However, due to a small number (<2%) of households containing no fisher aged 15 years or
more, a lesser total of 403,183 households has been applied in these analyses.
Recreational Fishing Motivations
Respondents were presented with eight motivational factors, representing both catch and non-
catch related components of the recreational fishing experience and asked to rate each as
being: ‘very important’, ‘quite important’, ‘not very important’ or ‘not at all important’. For
additional analysis purposes, values have been assigned to the responses, on a scale from 1
(not at all important) up to 4 (very important).
The two highest rated motivations in terms of overall importance were non-catch related – “to be
outdoors, in the fresh air … to enjoy nature” (a mean score of 3.63, with over 95% reporting at
least quite important), closely followed by “to relax or unwind” (mean score of 3.52, with close to
92% reporting at least quite important) (Table 18).
Very high ratings also occurred for: “the enjoyment or sport of catching fish, crabs etc” (mean
score of 3.26 and over 85% reporting at least quite important); “to spend time with your family”
(means score 3.26, with nearly 79% reporting at least quite important); and “to spend time with
your friends” (mean score of 3.18 and close to 80% reporting at least quite important) (Table 18).
A somewhat lower rating emerged for “to catch fresh fish/crabs etc. for food” (a mean score of
2.75 and over 58% reporting at least quite important), followed by “to be on your own ... to get
away from people” (mean score of 2.42 and nearly 41% reporting at least quite important), then
“to compete in fishing competitions of any kind” (mean score of 1.20 and less than 5% reporting
at least quite important) (Table 18).
Further analysis of these results for other key variables revealed very little differences – indeed
none with any statistical significance. For example, in terms of residential stratum, the largest
proportional range in mean scores for any motivational factor occurred for “to compete in fishing
competitions of any kind” – where a mean score of 1.44 was recorded for the South West
stratum, as opposed to 1.12 for the ACT and an overall mean of 1.20. The next largest
proportional range occurred for “to catch fresh fish, crabs etc. for food” – where a mean score of
3.03 was recorded for the Illawarra stratum, as opposed to 2.49 for the South West and an
overall mean of 2.76.
Also, when analysed by the gender of the main fisher/respondent (where 85% were males), the
largest proportional range in mean scores occurred in terms of “to be on your own ... to get away
from other people” – where a mean score of 2.66 was recorded for females, opposed to 2.39 for
males and an overall mean of 2.44. The differences by gender for all other motivational factors
were substantially less than this.
Relatively minor differences also occurred by age group and the largest proportional range in
mean scores occurred for “to catch fresh fish, crabs etc. for food” – where a mean score of 3.09
was recorded for the 60 years plus age group, as opposed to 2.39 for the 15-29 years age group
and an overall mean of 2.76. The next largest range occurred for “to be on your own ... to get
away from people” – where a mean score of 2.50 was reported for the 45-59 years age group,
as opposed to 2.11 for the 15-29 years age group and an overall mean of 2.44.

West et al. NSW/ACT Recreational Fishing Survey – 2013/14
81 NSW Department of Primary Industries, December 2015
Table 18 Relative importance of motivational factors for recreational fishing - as reported by the
main/key fisher aged 15 years or more in resident households with recreational fishing
activity in NSW/ACT waters during 2013/14. SE is standard error; values in bold indicate
relative standard error > 40%; values in italics indicate fewer than 30 fishing households
responded.
How important …. (and score value)
Mean
score
value
Motivational factor
Row
Very
(4)
Quite
(3)
Not very
(2)
Not at all
(1)
Unsure
(-)
To relax or unwind
%
61.3
30.6
7.0
0.7
0.5
3.52
SE
3.1
2.2
1.1
0.3
0.3
To be outdoors, in the
fresh air … to enjoy nature
%
69.0
26.5
3.6
0.1
0.8
3.63
SE
3.2
2.1
0.8
0.1
0.5
To be on your own ... to get
away from people
%
17.9
22.9
43.9
14.5
0.8
2.42
SE
1.8
2.0
2.5
1.7
0.5
To spend time with your
family
%
52.8
25.9
16.7
3.6
1.0
3.26
SE
2.8
2.1
1.6
0.7
0.5
To spend time with your
friends
%
43.1
36.7
16.3
2.9
1.0
3.18
SE
2.6
2.5
1.4
0.8
0.5
To compete in fishing
competitions of any kind
%
1.4
3.2
10.5
83.7
1.2
1.20
SE
0.4
0.7
1.1
3.5
0.6
For the enjoyment or sport
of catching fish, crabs etc.
%
43.6
41.9
12.7
1.0
0.9
3.26
SE
2.5
2.7
1.4
0.4
0.5
To catch fresh fish, crabs
etc. for food
%
28.7
29.6
30.1
10.9
0.7
2.75
SE
2.0
2.3
2.2
1.4
0.5
Satisfaction with Fishing
All main fishers/respondents were also asked how satisfied they were with the overall quality of
their fishing during the diary period, with three-quarters (76%) indicating that they were at least
quite satisfied (Figure 52; Appendix 19). Further analysis of these results for other key variables
revealed very few differences – indeed none with any statistical significance. For example, in
terms of residential strata, the highest general satisfaction levels were reported for the North
West and ACT (at 82% each), with the lowest levels in the North Coast (71%) and Mid North
Coast (66%), compared with the overall mean of 76% (Appendix 19). Also, when analysed by
the gender of the main fisher/respondent (again, 85% were males), a higher (but not significant)
general satisfaction level emerged for females (85%), as opposed to males (74%) and an overall
mean of 76%. Similarly, minor differences occurred by age group, e.g. the lowest general
satisfaction level was 69% for the 60 years plus age group.
All respondents reporting general dissatisfaction (24%) with their fishing in the previous 12
months were asked their main (and any other) reason for this. Detailed responses were
recorded by interviewers in terms of: the nature of the problem/issue; the perceived cause; and
any suggested solution. As for similar ‘open-ended’ questioning reported in ’Other Attitudinal
Information’ (Page 82), final coding and analysis of these responses will be undertaken by
Fisheries NSW staff. However, after a broad assessment, the vast majority refer to low catch
rates/levels, with many also citing high numbers of under-sized fish. In terms of perceived
causes and solutions, the majority provided little further information. Among the remainder, a
variety of factors were mentioned including commercial fishing impacts, general over-fishing and
various environmental factors, e.g. lack of rain in inland areas.

West et al. NSW/ACT Recreational Fishing Survey – 2013/14
82 NSW Department of Primary Industries, December 2015
Figure 52 Overall satisfaction with recreational fishing for the 12 month diary period – as reported by
the main/key fisher aged 15 years and older, in each resident household with fishing
activity in NSW/ACT waters. Error bars represent one standard error.
Other Attitudinal Information
The opinions and attitudes of the main fisher/respondent (aged 15 years and older) in all fisher
and non-fisher households were also assessed in terms of eight fishing-related issues – details
of which, along with response profiles (raw data format) are provided below. Note: final coding
and analysis of these responses will be undertaken by Fisheries NSW staff.
In this questioning, the main fisher/respondent was invited to provide any comments or
suggestions relating to recreational fishing, initially in the form of a ‘top of mind’ response (i.e.
without prompting) and subsequently, through prompting on a range of structured categories
(see below). Among the 1,607 households that fully responded to the Wash-up/Attitudinal
Survey, 21 households did not contain a main fisher/respondent aged 15 years and over.
Therefore, the following details refer to 1,586 households – among which, 985 (or 62%) provided
at least one comment. Significantly higher comment rates occurred among households that
fished in the diary period (72%), than for non-fishing households (32%). In total, 2,692 separate
comments and suggestions were reported in the 8 categories below:
1) General initial comments (without prompting): 250 comments/suggestions across a range
of issues (not covered by Items 2 to 7 below);
2) “about particular fish or other species that you like to fish for ... or use as bait?”: 196
comments;
3) “about size or possession limits for any species?”: 436 comments;
4) “about any other regulations to do with recreational fishing?”: 614 comments;
5) “about ramps, jetties or other facilities?”: 335 comments;
6) “about waterways or the environment?”: 341 comments;
7) “about this survey?”: 492 comments;
8) “anything else?”: a total of just 28 comments (indicating strong coverage by the previous
categories).
0
10
20
30
40
50
60
70
Very
Satisfied
Quite
satisfied
Not very
satisfied
Not at all
satisfied
Unsure
% responses

West et al. NSW/ACT Recreational Fishing Survey – 2013/14
83 NSW Department of Primary Industries, December 2015
Fishing Club Membership and Final Survey Questions
In the Wash-up Attitudinal Survey, all residents aged five years and older who fished in
NSW/ACT waters during the diary period were assessed in terms of current membership of “a
fishing or diving club ... or association”. In response, an estimated 42,270 or 5.7% (SE 0.9%) of
all fishers reported membership of some kind.
In final questioning for the overall survey, all respondents were asked if they would like to
receive a copy of the survey results and among the 1,607 households, 1,301 (81%) said ‘yes’,
with higher rates among fisher households (86%) than for non-fishers (68%). Also, respondents
in the 1,129 fishing households were asked as to their availability for re-contact (if needed) for
any future research by Fisheries NSW and virtually all agreed (1,081 or 96%). Among the
remainder, 27 households answered as ‘unsure’, as opposed to the 21 who directly declined. In
‘Diary Survey’ (Page 16), the high response rates achieved in the various components of this
study were discussed. Yet, this latter result is perhaps the ultimate test of the efficacy of the
survey instrument.

West et al. NSW/ACT Recreational Fishing Survey – 2013/14
84 NSW Department of Primary Industries, December 2015
Comparison of Key Survey Results – 2000/01 and 2013/14
Comparability of Results
In the remainder of this section, results from the NSW and ACT components of the NRFS in
2000/01 have been compared with the present survey to identify any changes or developments
in the recreational fishery over the thirteen year period. Importantly however, it should be noted
that despite the robust nature and fundamental comparability of the two studies (as discussed
below), the issue of inter-annual variability is a critical factor here – and especially in terms of the
natural availability of certain species and therefore the catch levels in a given year.
In terms of sample sizes, a key objective of the 2013/14 survey was to achieve a similar number
of households who completed the Diary Survey to optimise comparability with the NRFS –
namely, 1,661 households in 2001, compared with 1,681 in 2014. However to achieve this, a
45% larger sample was required for the Screening Survey (10,300 in 2000, compared with
14,908 in 2013), primarily due to lower fishing participation rates and related to this, lower diary
eligibility rates (or intention to fish) – 28% in 2000, compared with 21% in 2013. Also, somewhat
lower response rates occurred at screening (81% in 2000, compared with 76% in 2013), with
higher levels of ‘non-contacts’ being the primary difference. In terms of other response rates,
excellent results were achieved in both surveys, for example: 92% uptake of the 12 month Diary
Survey among eligible households in 2000, compared with 90% in 2013; and 91% completion of
the Diary Survey in 2001, compared with 93% in 2014.
The only analytical difference between the two surveys has been in how the fisher ‘drop-in’
adjustment was implemented in the 2000/01 survey. Although the NRFS included non-intending
fisher call-backs, the sample size proved insufficient to enable a robust ‘drop-in’ adjustment.
Therefore, an ‘equilibrium’ was assumed, whereby fishers who dropped-out of the fishery were
effectively replaced by counterparts assumed to have dropped-in, based on demographic and
avidity profiles (Lyle et al., 2009b).
Also, related to this was the fact that detailed catch and effort information was only collected
during the NRFS diary phase for ‘intending fishers’ in each household aged five years and older
at the Screening Survey – therefore requiring an additional ‘drop-in’ adjustment in the above
process for unexpected fishing by other household members. By contrast, all state/territory-wide
surveys since then have routinely monitored the fishing activity of all household members aged
five years and older at screening, i.e. where at least one household member reported an
intention to fish in the diary period.
Other minor comparability differences include: slight boundary changes by ABS in residential
strata (as discussed in ’Sampling Strata’, Page 9); collection of detailed fishing boat profiling
information in the Screening Survey for the NRFS, as opposed to the recent Wash-up/Attitudinal
Survey (and therefore a fourteen year ‘gap’); and the fact that individual respondents (aged 15
years and over) were randomly selected within each household for the NRFS Wash-
up/Attitudinal Survey, as opposed to the ‘main/key fisher’ for all subsequent state/territory-wide
surveys. Notwithstanding these factors, the application of a consistent survey methodology and
analytical procedures mean that the two datasets can be validly compared.
Fisher Characteristics
Participation – Overall and Regionally
Between 2000 and 2013 the estimated number of NSW/ACT residents aged five years and
older who fished at least once a year in NSW or ACT waters in the previous 12 months
decreased from 1,014,207 (SE 30,071) in 2000 to 836,632 (SE 27,456) in 2013 (Figure 53A;
Appendices 1 and 20). When expressed as a proportion of the resident population at the time,
this represents a significant decrease from 16.6% in 2000 to 11.7% in 2013 (Figure 53B) – close
to a 30% decrease in the participation rate over the 13 year period. However, trends of this kind

West et al. NSW/ACT Recreational Fishing Survey – 2013/14
85 NSW Department of Primary Industries, December 2015
have been reported in all state/territory-wide surveys conducted since the NRFS and also
overseas, as discussed later in this section.
Figure 53 Recreational fishing participation in the 12 months prior to May 2000 and June 2013 by
residents aged five years and older in NSW/ACT waters: A) number of persons; and B)
proportion of the resident population. Error bars represent one standard error.
When analysed by residential stratum, there were fewer fishers in 2013 in absolute terms, with
the exception of two strata – namely, the Illawarra (a minor increase from 69,270 in 2000 to
72,700 fishers in 2013) and the South West, where a relatively higher increase occurred, from
43,199 to 49,831 (Figure 54A; Appendix 20). However, the only increase in participation rate
occurred in the South West stratum (from 18.8% in 2000 to 20.1% 2013). Yet, all of these
increases are not statistically significant. By contrast, the largest proportional decreases
occurred in participation rates for the Mid North Coast (from 30.1% to 17.4%), the Hunter (from
24.6% to 15.1%) and the ACT (from 18.7% to 11.6%).
A B
0
200
400
600
800
1000
1200
2000 2013
Fishers (x000)
0
2
4
6
8
10
12
14
16
18
2000 2013
Participation rate (%)
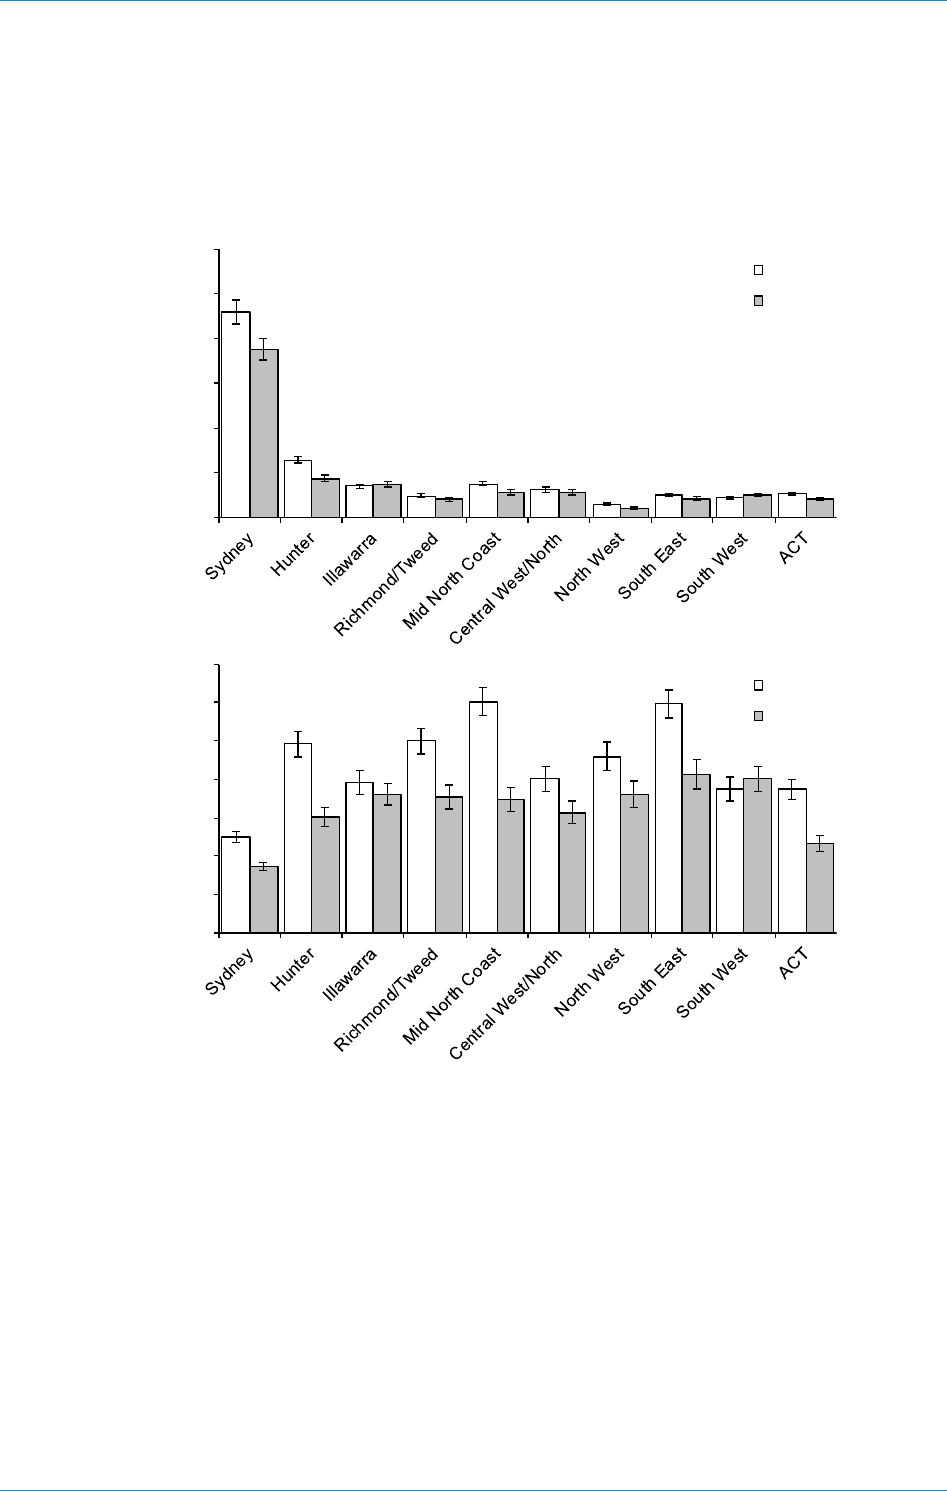
West et al. NSW/ACT Recreational Fishing Survey – 2013/14
86 NSW Department of Primary Industries, December 2015
Figure 54 Recreational fishing participation in the 12 months prior to May 2000 and June 2013 by
residents aged five years and older in NSW/ACT waters, by residential stratum: A)
number of persons; and B) proportion of the resident population. Error bars represent one
standard error. Note: the regional boundaries in 2000 differed slightly to those in 2013 -
the Australian Statistical Geography Standard (ASGS) (Pink 2011).
Participation by Age and Gender
In absolute and relative terms the decrease in fishing participation between 2000 and 2013 was
more pronounced amongst females, from 320,665 (SE 14,266) fishers or 10.4% (SE 0.5%) of
females aged five years and older in 2000 to 239,361 (SE 11,880) fishers or 6.6% (SE 0.3%) in
2013. This compares with the decrease for males, from 693,542 (SE 20,298) fishers or 22.9%
(SE 0.7%) of males aged 5 years and older in 2000 to 597,270 (SE 19,265) or 16.9% (SE 0.5%)
in 2013.
When analysed by age, the number of fishers in the 45-59 years age group has remained quite
stable between 2000 and 2013, with an actual increase in the 60 years and older age group
(Figure 55A). However in both cases, this was entirely due to population growth, because
participation rates actually decreased during that time for the 45-59 years age group (from
A
B
0
5
10
15
20
25
30
35
Participation rate (%)
2000
2013
0
100
200
300
400
500
600
Fishers (x000)
2000
2013

West et al. NSW/ACT Recreational Fishing Survey – 2013/14
87 NSW Department of Primary Industries, December 2015
15.1% to 12.0%) and to a lesser extent, for the 60 years and older age group (from 7.6% to
6.7%) (Figure 55B). Yet, the greatest rate of decrease in participation rates over the period
occurred in the 15-29 years age group (from 15.8% to 9.7%), followed by the 30-44 years age
group (from 19.5% to 13.4%) and to a lesser extent, the 5-14 years age group (from 25.1% to
19.6%) who continue to have the highest participation rate among the age groups (Figure 54B).
Figure 55 Recreational fishing participation in the 12 months prior to May 2000 and June 2013 by
residents aged five years and older in NSW/ACT waters, by age group: A) number of
persons; and B) proportion of the resident population. Error bars represent one standard
error.
As noted in ’Participation – Overall and Regionally’ (Page 84), a decrease in participation rates
has also occurred in other states, territories and overseas. In fact, based on the results from
various state/territory-wide surveys since the NRFS, the annual rate of decrease (i.e. the
proportional decrease in the participate rate) in NSW/ACT is very similar to Tasmania (Lyle et
al., 2014), with notably higher rates of decrease in all other jurisdictions, namely: Queensland
(Webley et al., in press); the Northern Territory (West et al., 2012); and South Australia (Jones
2009). Indeed, apart from some minor differences in the survey results and wording (for
NSW/ACT data and text), the following is an effectively direct quotation from the most recent
Tasmanian survey report (Lyle et al., 2014),
“The pattern of overall declining participation that is emerging appears to be linked to both the
ageing of the population and a decline in retention (rather than recruitment) of younger fishers,
noting that the highest participation rates have consistently been amongst children (<15 years).
B
A
0
50
100
150
200
250
300
350
5 to 14
15 to 29
30 to 44 45 to 59 60 plus
Fishers (x000)
Age group
2000
2013
0
5
10
15
20
25
30
5 to 14 15 to 29 30 to 44 45 to 59 60 plus
Participation rate (%)
Age group
2000
2013

West et al. NSW/ACT Recreational Fishing Survey – 2013/14
88 NSW Department of Primary Industries, December 2015
As children enter adulthood there appears to be a general movement away from fishing as a
pastime, with the fishing participation rate amongst 15-29 year olds close to half the rate for 5-14
year olds. Furthermore, even though the number of persons aged 60 years and older in NSW
and the ACT is growing disproportionately to population size, resulting in an increase in numbers
of fishers in this age group, participation rates are consistently low for this age group. Thus, the
growth in numbers of older fishers has not been sufficient to offset the shift away from fishing in
the younger age groups .....”.
Fishing Effort
Between the two survey periods, 2000/01 and 2013/14, annual recreational fishing effort (fisher
days) in NSW/ACT waters decreased by 37% – partly linked to the decreased number of fishers,
but also due to a lower average number of days fished annually (per fisher). In 2000/01,
residents aged 5 years and older accounted for an estimated 5,026,293 (SE 265,243) fisher
days of effort in NSW/ACT waters, representing an annual mean of 5.6 days per fisher. In
2013/14, a lower 3,181,035 (SE 169,699) total fisher days emerged, with an annual mean of 4.3
days per fisher. In initial analysis of these changes, that equal rates of decrease (37%) occurred
in the number of fisher days for both freshwater and saltwater areas (Figure 56).
Figure 56 Comparison of fishing effort (fisher days) by residents aged five years and older who
fished in NSW/ACT waters during 2000/01, compared with 2013/14 - by freshwater and
saltwater. Error bars represent one standard error.
When analysed by fishing platform, a slightly higher rate of decrease (40%) emerged for shore-
based fishing effort (fisher days) over the 13 year period, compared with boat-based fishing
(34%) (Figure 57). In terms of fishing method, line fishing effort decreased by 35% in the period,
with higher rates of decrease for pots/traps (63%) and ‘other methods’ (e.g. hand-collecting,
digging and pumps; 64%) and also for diving and net fishing (where high standard errors occur)
(Figure 58). However, a separate analysis of line fishing effort has revealed a greater than
average rate of decrease (41%) in fisher days where bait was used, compared with a significant
increase (36%) in total fisher days using lures and jigs. That is, the proportion of all line fishing
days using lures and jigs has risen from 14% in 2000/01 to 23% in 2013/14.

West et al. NSW/ACT Recreational Fishing Survey – 2013/14
89 NSW Department of Primary Industries, December 2015
Figure 57 Comparison of fishing effort (fisher days) by residents aged five years and older who
fished in NSW/ACT waters during 2000/01, compared with 2013/14 – by fishing platform
(boat and shore). Error bars represent one standard error.
Figure 58 Comparison of fishing effort (fisher days) by residents aged five years and older who
fished in NSW/ACT waters during 2000/01, compared with 2013/14 – by fishing method.
Error bars represent one standard error.
When analysed by water body type, a higher than average rate of decrease in fishing effort
(fisher days) emerged for in-shore coastal waters (53%) and also for freshwater lakes/dams
(43%). Lower than average levels of decrease occurred for all other water body types: offshore
waters (32%); estuarine waters (29%); and freshwater rivers (24%) (Figure 59). In terms of
fishing zones, higher than average rates of decrease in fishing effort (fisher days) occurred in the
majority of zones, with many at around half (50%) the 2000/01 level. However, lower than
average rates of decrease occurred in three cases: the Sydney zone (16%); the Mid South
Coast (20%) and the Murray/South West (30%) (Figure 60). The estimated numbers of fishers
and fisher days by fishing zone in 2000/01 and 2013/14 are presented in Appendix 21.
0
500
1000
1500
2000
2500
3000
3500
Boat Shore
Fisher days (x000)
2000-01
2013-14
0
1000
2000
3000
4000
5000
6000
Line Pot/trap Net Dive Other
Fisher days (x000)
2000-01
2013-14

West et al. NSW/ACT Recreational Fishing Survey – 2013/14
90 NSW Department of Primary Industries, December 2015
Figure 59 Comparison of fishing effort (fisher days) by residents aged five years and older who
fished in NSW/ACT waters during 2000/01, compared with 2013/14 – by water body type.
Error bars represent one standard error.
Figure 60 Comparison of fishing effort (fisher days) by residents aged five years and older who
fished in NSW/ACT waters during 2000/01, compared with 2013/14 – by fishing zone.
Error bars represent one standard error.
0
500
1000
1500
2000
2500
3000
Offshore Inshore Estuary River
Lake/dam
Fisher days (x000)
2000-01
2013-14
0
200
400
600
800
1000
1200
Fisher days (x000)
2000-01
2013-14

West et al. NSW/ACT Recreational Fishing Survey – 2013/14
91 NSW Department of Primary Industries, December 2015
Catch
Catch details for key species in 2000/01 and 2013/14 are provided in Appendices 22 and 23,
with comparisons for key marine species in Figure 61 and freshwater species in Figure 62. An
estimated 37,347,987 organisms were caught (kept and released) by resident recreational
fishers in NSW/ACT waters during 2000/01, compared with 14,059,634 in 2013/14, representing
an overall rate of decrease of 62% – and substantially higher than the 37% decrease in fishing
effort (fisher days) between the two periods (see ‘Fishing Effort’, Page 88).
Appendix 22 provides total catch details for some 39 key species/groups, covering the vast
majority of the total catch of all organisms in 2000/01 and 2013/14 (i.e. 93% and 94%
respectively, of the above estimates) – and again, with an overall rate of decrease of 62%.
Note: due to broader coding in the NRFS, several key species have necessarily been grouped in
these analyses, namely flathead, trevally and whiting.
When the total catch of all finfish are compared (excluding small baitfish species), a lesser
overall rate of decrease of 49% emerges (Appendix 22). This compares with a 35% decrease
in line fishing effort (fisher days) between the two periods (see ‘Fishing Effort’, Page 88,). In
terms of total catch of small baitfish species (Blue Mackerel, mullet, Yellowtail Scad and ‘other
small baitfish’), an overall 48% decrease rate emerged – although high levels of variability and
standard errors occurred (Appendix 22). However, for the various crustaceans a substantially
higher overall rate of decrease (77%) occurred between the two periods, but again with high
standard error levels in many cases. Yet, this is largely consistent with the decreases in related
fishing effort (fisher days) for methods such as pots/traps, nets and hand-collecting – all
decrease rates for which, were 63% or higher (see ‘Fishing Effort’, Page 88). Note: comparisons
for all other taxa are limited due to small sample sizes and high standard errors. However, a
separate analysis of the total catch by line fishing has shown a doubling of the proportion
attributable to lures, jigs and flies from 10% in 2000/01 to 20% in 2013/14.
Appendix 23 provides comparative harvest estimates (kept numbers) on the same basis as for
Appendix 22. An overall rate of decrease of 69% emerged in total harvest numbers between the
two surveys, compared with 62% for the total catch. When the total harvest levels of all finfish
are compared (excluding small baitfish species), a lesser overall rate of decrease of 57%
emerges (Appendix 23). In terms of the harvest of small baitfish species (Blue Mackerel, mullet,
Yellowtail Scad and ‘other small baitfish’), an overall 36% decrease rate emerged – although
high levels of variability and standard errors occurred (Appendix 23). For the various
crustaceans a substantially higher overall rate of decrease (80%) occurred between the two
periods, but again with high standard error levels in many cases. Similarly, comparisons for
other taxa are limited by standard error levels.
Also, when the results in Appendices 22 and 23 are compared in terms of the proportion of the
total catch that was released, a lower overall proportion (30%) emerged for key species in
2000/01, than for 2013/14 (43%) – with key finfish (excluding bait species) at 52% (2000/01) and
59% (2013/14). Comparative data for release proportions, along with total catch and harvest
estimates for key species are depicted in Figures. 61 and 62.
Note: comparisons of total catch, harvest and release rates for key species between the two
periods are provided in ’Broad Catch Rates – Line fishing’ (Page 95).

West et al. NSW/ACT Recreational Fishing Survey – 2013/14
92 NSW Department of Primary Industries, December 2015
Figure 61 Total catch numbers (kept and released), harvest numbers (kept), and proportion (%) of
the total catch released for key marine species, by residents aged five years and older
who fished in NSW/ACT waters during 2000/01, compared with 2013/14. Error bars
represent one standard error.
0
10
20
30
40
50
60
70
80
90
100
0
40
80
120
160
200
2000-01
2013-14
Released (%)
Catch (x000)
Mulloway
Total
Kept
% rel
0
10
20
30
40
50
60
70
80
90
100
0
200
400
600
800
1000
1200
2000-01 2013-14
Released (%)
Catch (x000)
Luderick
Total
Kept
% rel
0
10
20
30
40
50
60
70
80
90
100
0
500
1000
1500
2000
2500
3000
3500
4000
2000-01 2013-14
Released (%)
Catch (x000)
Flathead
Total
Kept
% rel
0
10
20
30
40
50
60
70
80
90
100
0
500
1000
1500
2000
2500
3000
3500
4000
4500
5000
2000-01 2013-14
Released (%)
Catch (x000)
Bream
Total
Kept
% rel
0
10
20
30
40
50
60
70
80
90
100
0
200
400
600
800
1000
1200
1400
1600
1800
2000-01 2013-14
Released (%)
Catch (x000)
Tailor
Total
Kept
% rel
0
10
20
30
40
50
60
70
80
90
100
0
200
400
600
800
1000
1200
1400
1600
1800
2000-01 2013-14
Released (%)
Catch (x000)
Snapper
Total
Kept
% rel
0
10
20
30
40
50
60
70
80
90
100
0
50
100
150
200
2000-01 2013-14
Released (%)
Catch (x000)
Aust. Salmon
Total
Kept
% rel
0
10
20
30
40
50
60
70
80
90
100
0
50
100
150
200
250
300
2000-01 2013-14
Released (%)
Catch (x000)
Silver Trevally
Total
Kept
% rel

West et al. NSW/ACT Recreational Fishing Survey – 2013/14
93 NSW Department of Primary Industries, December 2015
Figure 61, continued
0
10
20
30
40
50
60
70
80
90
100
0
100
200
300
400
500
600
700
2000-01
2013-14
Released (%)
Catch (x000)
Mullet
Total
Kept
% rel
0
10
20
30
40
50
60
70
80
90
100
0
500
1000
1500
2000
2500
3000
3500
2000-01 2013-14
Released (%)
Catch (x000)
Whiting
Total
Kept
% rel
0
10
20
30
40
50
60
70
80
90
100
0
10
20
30
40
50
60
70
80
90
2000-01 2013-14
Released (%)
Catch (x000)
Mud Crab
Total
Kept
% rel
0
10
20
30
40
50
60
70
80
90
100
0
100
200
300
400
500
600
2000-01 2013-14
Released (%)
Catch (x000)
Blue Swimmer Crab
Total
Kept
% rel
0
10
20
30
40
50
60
70
80
90
100
0
50
100
150
200
250
300
350
400
450
2000-01 2013-14
Released (%)
Catch (x000)
Yellowtail Scad
Total
Kept
% rel
0
10
20
30
40
50
60
70
80
90
100
0
50
100
150
200
250
300
350
2000-01 2013-14
Released (%)
Catch (x000)
Blue Mackerel
Total
Kept
% rel
0
10
20
30
40
50
60
70
80
90
100
0
20
40
60
80
100
120
140
160
2000-01 2013-14
Released (%)
Catch (x000)
Yellowtail Kingfish
Total
Kept
% rel

West et al. NSW/ACT Recreational Fishing Survey – 2013/14
94 NSW Department of Primary Industries, December 2015
Figure 62 Total catch numbers (kept and released), harvest numbers (kept), and proportion (%) of
the total catch released for key freshwater species, by residents aged five years and older
who fished in NSW/ACT waters during 2000/01, compared with 2013/14. Error bars
represent one standard error.
0
10
20
30
40
50
60
70
80
90
100
0
50
100
150
200
250
300
350
400
450
2000-01 2013-14
Released (%)
Catch (x000)
Trout
Total
Kept
% rel
0
10
20
30
40
50
60
70
80
90
100
0
200
400
600
800
1000
1200
1400
1600
2000-01 2013-14
Released (%)
Catch (x000)
Freshwater yabby
Total
Kept
% rel
0
10
20
30
40
50
60
70
80
90
100
0
50
100
150
200
250
300
2000-01
2013-14
Released (%)
Catch (x000)
Aust. Bass
Total
Kept
% rel
0
10
20
30
40
50
60
70
80
90
100
0
100
200
300
400
500
600
700
2000-01 2013-14
Released (%)
Catch (x000)
Golden Perch
Total
Kept
% rel
0
10
20
30
40
50
60
70
80
90
100
0
50
100
150
200
250
2000-01 2013-14
Released (%)
Catch (x000)
Murray Cod
Total
Kept
% rel
0
10
20
30
40
50
60
70
80
90
100
0
200
400
600
800
2000-01 2013-14
Released (%)
Catch (x000)
European Carp
Total
Kept
% rel
0
10
20
30
40
50
60
70
80
90
100
0
100
200
300
400
500
600
2000-01 2013-14
Released (%)
Catch (x000)
Redfin Perch
Total
Kept
% rel

West et al. NSW/ACT Recreational Fishing Survey – 2013/14
95 NSW Department of Primary Industries, December 2015
Broad Catch Rates – Line Fishing
Definitions and Methods
The information in this section provides additional assessment of changes in the recreational
fishery between the two survey periods – based on broad catch rate analyses, which were
specifically developed for this purpose in the RecSurvey analysis package.
To optimise comparability and data utility, this catch rate analysis was restricted to line fishing
methods, which accounted for the vast majority all fishing effort (fisher days) in the 2000/01 and
2013/14 surveys (95% and 97%, respectively). Other methods such as pots/traps and nets were
excluded, due to the high levels of variability in terms of catch, effort and therefore catch rates
(e.g. prawns and yabbies). However, comparative catch information for key ‘non-fish’ species
has been included in ‘Catch’ (Page 91), and Appendix 22.
Only ‘desirable’ finfish species/groups were included in this analysis, both in terms of total catch
and targeted fishing effort. Desirable finfish species were defined as generally being regarded
as either good quality ‘table’ fish and/or sportfish species. Examples of marine species/groups
considered ‘undesirable’ include Red Rock Cod, sharks/rays and wrasse/gropers. These
exclusions were based on high release rates and ‘un-wanted’ being identified as the primary
reason for release (see Table 7 and ’Reasons for Release’, Page 31). Whereas no freshwater
finfish species were excluded on this basis, European Carp were routinely classified as
‘undesirable’. Also, fish species predominantly used as bait were excluded, e.g. Blue mackerel,
mullet and Yellowtail Scad, to enhance the stability of the analysis.
Therefore broad annual catch rate data were calculated at the household (PSU) level as the
number of desirable finfish species caught per fisher day, i.e. where line fishing for any desirable
finfish species occurred. For example, where a fisher targeted Murray Cod on a given day and
only caught European Carp, this would be included as a ‘zero’ catch day. On the other hand, in
the (albeit rare) case where the only target was European Carp, this would be totally excluded
from the analysis – regardless of any ultimate catch. However, virtually all line fishing events
were included in this analysis for both 2000/01and 2013/14 (97% and 96%, respectively). In
both cases, less than 1% of line fishing events were excluded on the basis of ‘undesirable’
species targets, with other exclusions referring to either baitfish or non-fish targets (e.g. Blue
Swimmer Crabs).
Importantly, the catch rate analyses were confined to broad/non-directed effort at one of three
levels, namely where any desirable finfish species/group was targeted: (i) all line fishing days; (ii)
line fishing days in saltwater versus freshwater; and (iii) line fishing days in four water body types
(ocean, estuaries, rivers and lakes/dams).
In reviewing the following results, a number of factors need to be carefully considered including:
the issue of inter-annual variability (such as natural changes in abundance of species and also
environmental/weather factors, e.g. floods); changes in fishing practices, target preferences and
technology over time; and changes in regulations such as size and bag/possession limits.
Accordingly, the results in this section almost entirely refer to total catch rates, as opposed to
harvest rates – where for example, changes in regulations can have a significant impact.
However, a range of harvest rate analyses have been provided as an output of the project. Also,
the results in ‘Catch’ (Page 28) and Appendix 23 should be used for any review of harvest levels
for particular species. Other data sources should also be used where appropriate, e.g. annual
harvest data from the commercial sector to provide a perspective on inter-annual variability.
Broad Catch Rates
In this catch rate analysis, a total catch of 17,734,886 (SE 1,679,611) desirable finfish
species/groups (freshwater and saltwater) was estimated for the 2000/01 survey, compared with
8,565,676 (SE 728,516) for 2013/14 – representing a significant decrease of 52%. Comparable
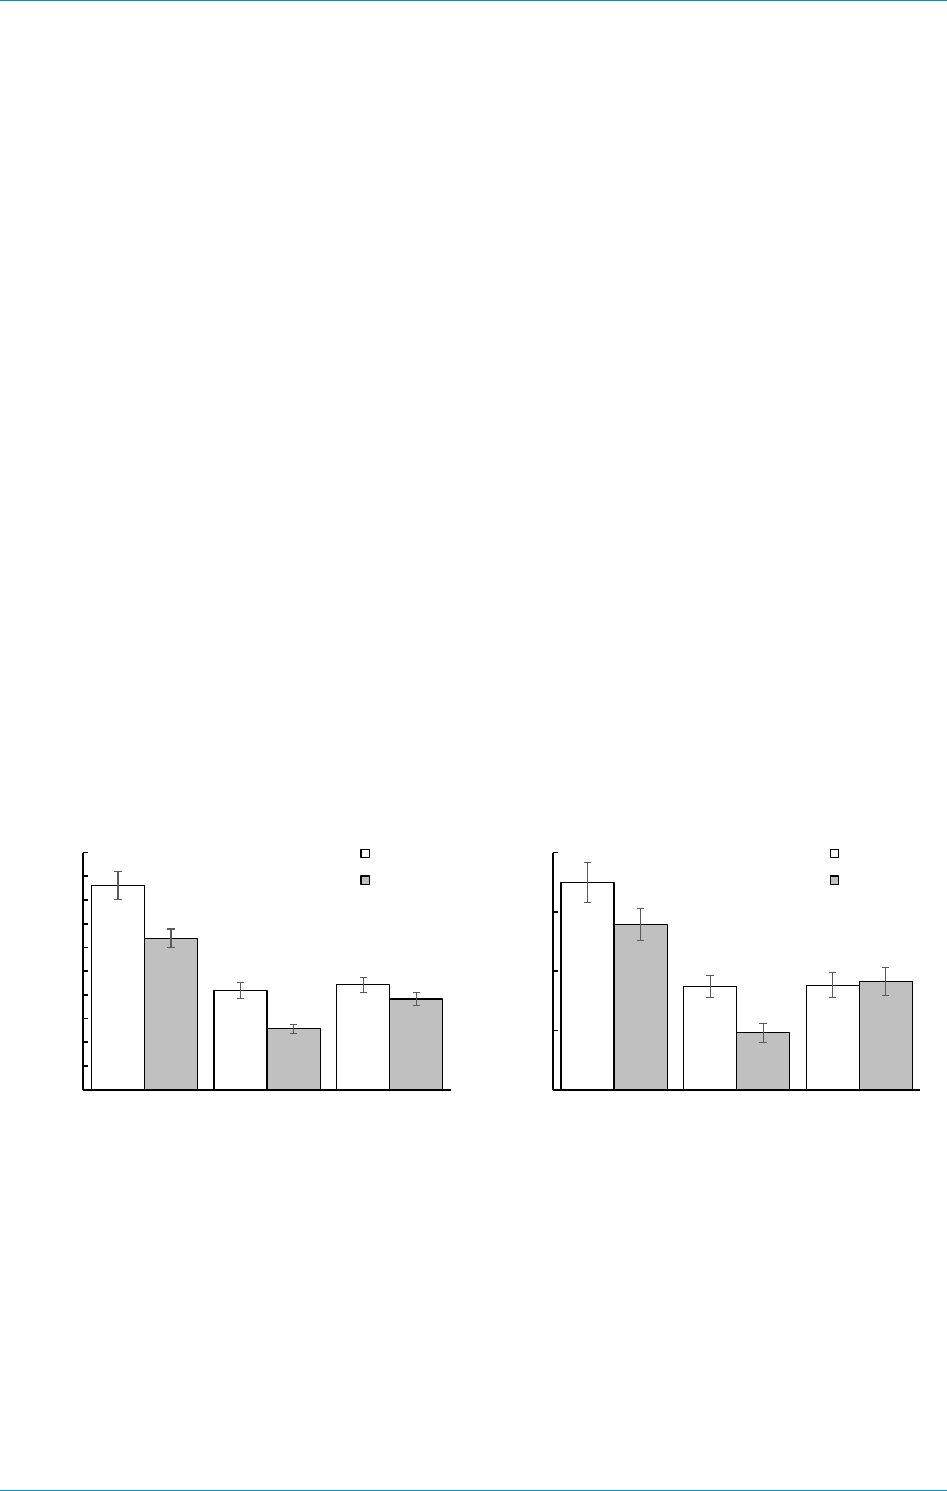
West et al. NSW/ACT Recreational Fishing Survey – 2013/14
96 NSW Department of Primary Industries, December 2015
total fisher days of line-fishing were estimated at 4,681,582 (SE 252,651) for 2000/01 and
3,031,427 (SE 159,467) for 2013/14 – representing a significant decrease of 35%.
A resultant total catch rate of 3.79 (SE 0.25) desirable finfish per fisher day emerged for
2000/01, compared with 2.83 (SE 0.16) for 2013/14 – representing a lesser, but still significant
decrease of 25%. However, when analysed in terms of the proportion of ‘successful’ fisher days
(i.e. at least some catch) versus ‘unsuccessful’ (or ‘zero’ catch) days, there was no significant
difference between the surveys, with 31% and 33% ‘zero’ catch days, respectively.
Note: comparable total harvest rates were 1.85 (SE 0.14) desirable finfish per fisher day for
2000/01, compared with 1.12 (SE 0.08) for 2013/14 – representing a greater and significant
decrease of 39%. However, comparable release rates were 1.94 (SE 0.13) desirable finfish per
fisher day for 2000/01, compared with 1.71 (SE 0.12) during 2013/14 – representing a minor and
non-significant decrease of 12%.
Overall total catch rates for desirable saltwater finfish species were 4.31 per fisher day (SE 0.30)
for 2000/01, compared with 3.20 (SE 0.19) for 2013/14 – representing a significant decrease of
26% (Figure 63 and Appendix 24). However, no significant difference emerged in terms of ‘zero’
catch days between 2000/01 and 2013/14 – namely, 26% and 30% respectively.
Equivalent results for desirable freshwater finfish were 1.75 per fisher day (SE 0.17) for 2000/01,
compared with 1.39 (SE 0.14) for 2013/14 – representing a non-significant decrease of 20%
(Figure 63 and Appendix 25). Also, no significance difference emerged in terms of ‘zero’ catch
days between 2000/01 and 2013/14 – namely, 48% and 46% respectively.
Figure 63 Mean line fishing catch rates of ‘desirable’ finfish species, by residents aged five years
and older who fished in NSW/ACT waters during 2000/01, compared with 2013/14 – by
saltwater and freshwater. Error bars represent one standard error.
In terms of key saltwater finfish species, tailor had the greatest decrease in total catch rate, from
0.32 fish per fisher day (SE 0.04) in 2000/01, compared with 0.12 (SE 0.02) for 2013/14 –
representing a significant decrease of 62% (Figure 64) and especially so in estuarine waters
(Appendix 24). A significant decrease in catch rate (60%) also occurred for leatherjackets and
predominantly in estuarine waters. Lesser overall rates of decrease occurred for various other
species ranging from whiting (50%) through to Snapper (6%) and flathead (3%). However,
among these, the only significant change occurred in terms of the catch rate for bream in ocean
waters (a decrease of 59%) – compared with a 12% decrease in estuaries and an overall
decrease of 20% (Appendix 24). On the other hand, increased catch rates emerged for three
0.0
0.5
1.0
1.5
2.0
Total Kept Release
Catch rate (no. per fisher day)
Catch
Freshwater
2000-01
2013-14
0.0
0.5
1.0
1.5
2.0
2.5
3.0
3.5
4.0
4.5
5.0
Total Kept Release
Catch rate (no. per fisher day)
Catch
Saltwater
2000-01
2013-14

West et al. NSW/ACT Recreational Fishing Survey – 2013/14
97 NSW Department of Primary Industries, December 2015
key saltwater species, although none was statistically significant. The overall catch rate for
Mulloway increased by 68% between the two periods and predominantly in estuarine waters.
Also, Australian Salmon increased by 35%, (mainly in estuarine waters) and Yellowtail Kingfish
by 21% (predominantly in ocean waters).
In terms of key freshwater finfish species, Golden Perch had the greatest decrease in total catch
rate from 0.12 fish per fisher day (SE 0.02) in 2000/01 to 0.05 (SE 0.01) for 2013/14 –
representing a significant decrease of 61% (Figure 64), with decreases in both rivers and
lakes/dams (Appendix 25). Lesser overall rates of decrease occurred for Redfin Perch (41%)
and trout (25%). However, a slight increase (24%) occurred in catch rates for trout in
lakes/dams, but this was offset by a larger and significant decrease (73%) in river catch rates
(Appendix 25). Increased catch rates occurred for Australian Bass (over 300% and mainly in
lakes/dams), and for Murray Cod (60%), mainly in rivers (Appendix 25). However in both cases,
high standard errors mean that little statistical significance can be attached to these increases.
Figure 64 Mean line fishing catch rates of key saltwater and freshwater finfish species/groups by
residents aged five years and older who fished in NSW/ACT waters during 2000/01,
compared with 2013/14. Error bars represent one standard error.
Boats
As noted in ’Comparability of Results’ (Page 84), all information regarding boats was collected in
the NRFS screening phase (2000), whereas only broad boat ownership was assessed at the
screening in 2013. Analysis of these results shows that 257,339 (SE 10,097) NSW/ACT
resident households owned at least one boat in 2000, representing an overall household
ownership rate of 10%, compared with 320,818 (SE 11,381) in 2013 and an overall boat
ownership rate of 11%. Substantially higher boat ownership rates emerged for those
households with any fishing activity in NSW/ACT waters in the 12 months prior to the Screening
Survey – 34% in 2000 and 38% in 2013. By contrast, much lower ownership rates were
reported by non-fishing households – 4% in 2000 and 6% in 2013.
In terms of boat profiling for fishing households, this information was collected in the Screening
Survey in 2000 and in the Wash-up/Attitudinal Survey in 2014 – hence a 14 year ‘gap’ applies to
the following results. In 2000, 171,009 (SE 7,792) NSW/ACT resident fishing households
reported owning 204,457 (SE 10,016) individual boats – a mean of 1.20 per household. A
majority of these boats (77%) were used at least once for recreational fishing in the previous 12
months (156,459 boats; SE 8,307). In 2014, 180,622 (SE 10,322) NSW/ACT resident fishing
households reported 230,118 (SE 13,435) individual boats – a mean of 1.27 per household.
0.00
0.20
0.40
0.60
0.80
1.00
1.20
Bream Flathead Whiting Tailor Snapper
Catch rate (no. per fisher day)
Saltwater
2000-01
2013-14
0.00
0.02
0.04
0.06
0.08
0.10
0.12
0.14
Golden
Perch
Redfin
Perch
Trout Murray
Cod
Aust.
Bass
Catch rate (no. per fisher day)
Freshwater
2000-01
2013-14

West et al. NSW/ACT Recreational Fishing Survey – 2013/14
98 NSW Department of Primary Industries, December 2015
Again, a majority of these boats (76%) were used at least once for recreational fishing in the
previous 12 months (173,895 boats; SE 10,873).
The following results refer to the recreational fishing ‘fleet’ for the two periods, namely 156,459
boats in 2000/01 and 173,895 boats in 2013/14. Firstly in terms of residential strata, the
proportions of all fishing boats were very similar for seven of the ten strata e.g. Sydney
accounted for 37% of all boats in 2000 and 36% in 2014. However, a proportional decrease
occurred in the Hunter stratum from 17% in 2000 to 10% in 2014, with a minor proportional
increase in the Illawarra (from 8% to 11%) and also in the South West (from 5% to 9%). Yet,
these results are at least partially linked to changes in fishing participation rates – namely, the
Hunter had the greatest decrease over the period and the South West showed an actual
increase (see ’Participation – Overall and Regionally’, Page 84).
Over three-quarters of the fleet were trailer boats in both periods, namely 76% in 2000 and 77%
in 2014, with an increase in the proportion of ‘car-toppers’ (from 8% to 12%) and smaller (but not
significant) proportions of boats kept on the shore, or a mooring/marina berth. In terms of overall
length, an increased proportion emerged for the smallest size group, i.e. less than 4 metres,
from 20% in 2000 to 26% in 2014, with little difference for the 4-4.9 metres group (from 42% to
40%) and no change for the 5-5.9 metres group (26% in both periods). However, a minor
decrease occurred among larger boats (6 metres or more) from 12% to 9%. In terms of main
propulsion method, power craft (of some kind) dominated the fleet in both periods, with a
decrease in the proportion of ‘Other Power’ craft from 89% in 2000 to 82% in 2014 (Figure 65).
On the other hand, a significant increase occurred in the proportion of ‘Row/paddle’ boats (from
8% to 16%; Figure 65) and this is consistent with the trend towards ‘car-toppers’ and smaller
craft (as noted above) and the increased popularity of kayaks for recreational fishing.
Figure 65 Proportion (%) of recreational fishing boats used by residents in NSW/ACT waters during
2000/01, compared with 2013/14 – by main propulsion method. Error bars represent one
standard error.
With regard to electronic fishing aids (whether as fixtures or in portable form), significant
increases have emerged in terms of echo sounder (‘fish finder’) availability, namely a
proportional increase of more than half, from 36% of all fishing boats in 2000, to 56% in 2014
(Figure 66A). However, a three-fold increase occurred for GPS availability from 12% in 2000 to
39% in 2014 (Figure 66B).
0
10
20
30
40
50
60
70
80
90
100
Jetski Other Power Row/Paddle Sail
% Fishing boats
2000
2014

West et al. NSW/ACT Recreational Fishing Survey – 2013/14
99 NSW Department of Primary Industries, December 2015
Figure 66 Proportion (%) of recreational fishing boats used by residents in NSW/ACT waters during
2000/01, compared with 2013/14 – with availability of: A) echo sounder or ‘fish finder’; and
B) global positioning system (GPS). Error bars represent one standard error.
In terms of proportional usage for recreational fishing, as opposed to other activities (e.g. water
skiing) over the previous 12 months, an average of 78% usage was reported for all fishing boats
in 2000, compared with 82% for 2014. Also, based on current market valuations by respondents
(at the time), a total value of $1.204 billion (SE $165 million) was estimated for the recreational
fishing fleet in 2000, compared with $1.535 billion (SE $139 million) for 2014 – representing a
mean of $7,694 per boat for 2000, compared with $8,826 for 2014. When individual attribution
rates are applied (i.e. annual proportional usage for fishing), the value of the fleet directly
attributable to recreational fishing was $794 million (SE $79 million) in 2000, compared with
$1.132 billion (SE $90 million) in 2014 – representing a mean of $5,075 per boat for 2000,
compared with $6,509 for 2014.
Club Membership and Attitudinal Results
Membership of a “fishing or diving club ... or association” was assessed in the NRFS Screening
Survey (2000), whereas in the present study, this questioning was included in the Wash-
up/Attitudinal Survey (2014). In response, very similar proportions reported club membership in
both periods, i.e. among residents aged five years and older who fished in NSW/ACT waters
during the previous 12 months – namely 6.1% (SE 0.6%) in 2000, compared with 5.7% (SE
0.9%) in 2014.
As reported in ’Recreational Fishing Motivations’ (Page 80), respondents were presented with
eight motivational factors, representing both catch and non-catch related components of the
recreational fishing experience and asked to rate each as being: ‘very important’, ‘quite
important’, ‘not very important’ or ‘not at all important’. As an additional analysis, values were
assigned to the responses, on a scale from 1 (not at all important) up to 4 (very important). This
question sequence was also asked in the NRFS and results from both surveys have been
included in Table 19 – on the basis of expanded estimates of fishing households reporting “at
least quite important” and the weighted mean score (from 1 to 4) for each of the motivational
factors. Interestingly, very similar results emerged in all but one case, where a minor increase
occurred for “to spend time with your family”.

West et al. NSW/ACT Recreational Fishing Survey – 2013/14
100 NSW Department of Primary Industries, December 2015
Table 19 Relative importance of motivational factors for recreational fishing - by fishers aged 15
years and over in resident households with recreational fishing activity in NSW/ACT
waters - comparison of results from 2001 and 2014.
% at least quite
important
Mean score (min. 1
to max. 4)
Motivational factor
2001
2014
2001
2014
To relax or unwind
91.6
91.8
3.56
3.52
To be outdoors, in the fresh air … to enjoy nature
94.2
95.5
3.57
3.63
To be on your own ... to get away from people
39.6
40.8
2.38
2.42
To spend time with your family
68.2
78.7
2.96
3.26
To spend time with your friends
76.9
79.8
3.06
3.18
To compete in fishing competitions of any kind
6.4
4.6
1.30
1.20
For the enjoyment or sport of catching fish, crabs etc.
80.8
85.4
3.24
3.26
To catch fresh fish, crabs etc. for food
56.1
58.3
2.74
2.75
As reported in ’Satisfaction with Fishing’ (Page 81), respondents were asked how satisfied they
were with the overall quality of their fishing during the diary period and this question sequence
was also applied in the NRFS. Comparative results from both surveys are presented in Figure
67, where a significant increase in general satisfaction occurred – with 61% reporting being at
least ‘quite satisfied’ in 2001, compared with 76% in 2014. When analysed by residential
stratum, a significant proportional increase occurred in the Richmond/Tweed area – from just
36% reporting ‘at least quite satisfied’ in 2001 to 71% in 2014. After analysis of the reported
reasons for dissatisfaction in 2001, various issues concerning the lower Richmond River
emerged – including flooding, related environmental problems and subsequent closure of the
river to commercial and recreational fishing by the NSW government. However, for all other
residential strata, largely consistent proportional increases occurred in overall satisfaction levels
between 2001 and 2014.
Figure 67 Comparison of overall satisfaction with recreational fishing for the 12 month diary period –
as reported by fishers in resident households with fishing activity in NSW/ACT waters in
2000/01, compared with 2013/14. Error bars represent one standard error.
0
10
20
30
40
50
60
70
Very
Satisfied
Quite
satisfied
Not very
satisfied
Not at all
satisfied
Unsure
% responses
2000
2014

West et al. NSW/ACT Recreational Fishing Survey – 2013/14
101 NSW Department of Primary Industries, December 2015
References
Butcher, P.A., Broadhurst, M.K., Hall, K.C., Cullis, B.R., and Raidal, S.R., (2012). Assessing
barotraumas among angled snapper (Pagrus auratus) and the utility of release
methods. Fisheries Research 127-128, 49-55
Broadhurst, M.K., Butcher, P.A., Hall, K.C., Cullis, B.R. and McGrath, S.P., (2012). Resilience of
inshore, juvenile snapper (Pagrus auratus) to angling and release. Journal of Fish
Biology, 80: 638–650.
Coleman, A.P.M. (1998). Fishcount: A Survey of recreational fishing in the Northern Territory.
NT Department of Primary Industry and Fisheries. Fishery Report No: 43
Georgeson, L., (2015, in press). A Framework for Regular National Recreational Fishing
Surveys.
Domestic Fisheries & Marine Environment, Australian Bureau of Agricultural and Resource
Economics and Sciences
Ghosn, D.L., Steffe, A.S., and Murphy, J.J. (2010). An assessment of the effort and catch of
shore-based and boat-based recreational fishers in the Sydney Harbour estuary over
the 2007/08 summer period. Cronulla Fisheries Research Centre of Excellence,
Industry & Investment NSW, Cronulla, NSW.
Henry, G.W. (1984). Commercial and recreational fishing in Sydney estuary. Dept. of
Agriculture, Sydney.
Henry, G.W. and Lyle, J.M. (2003) The national recreational and indigenous fishing survey.
Final Report to the Fisheries Research and Development Corporation, Project 99/158.
NSW Fisheries Final Report Series No. 40, 188p.
Hughes, J.M., Stewart, J., Gillanders, B.M., and Suthers, I.M. (2011) An examination of the
population structure of the eastern Australian salmon (Arripis trutta) stock in south-
eastern Australia. Proceedings of the International Symposium on Advances in Fish
Tagging and Marking Technology. February 2008, Auckland, New
Zealand. Transactions of the American Fisheries Society, 76.
Jones, K. (2009). South Australian Recreational Fishing Survey 2007/08. Fisheries Division,
Primary Industries and Resources SA. South Australian Fisheries management Series,
Paper No. 54
Lyle, J.M. and Campbell, D.A. (1999) Species and size composition of recreational catches with
particular reference to licensed fishing methods. Tasmanian Aquaculture and Fisheries
Institute Final Report to Marine Recreational Fishery Advisory Committee, 46p.
Lyle, J.M., Coleman, A.P.M, West, L., Campbell, D., and Henry, G.W. (2002a) An innovative
methodology for the collection of detailed and reliable data in large-scale Australian
recreational fishing surveys. In: Recreational Fisheries: Ecological, Economic and
Social Evaluation, Pitcher, T.J., and Hollingworth, C.E. (eds). pp 207-226. Fish and
Aquatic Resources Series No. 8, Blackwell Science, Oxford, UK
Lyle, J.M., Forward, J. and Morton. A. (2002b) Species and size composition of recreational
catches based on 2000/2001 creel surveys. Tasmanian Aquaculture and Fisheries
Institute Internal Report, 29p.
Lyle, J.M., Wotherspoon, S., Stark, K.E. (2009a). Developing an analytical module for large-
scale recreational fishery data based on phone-diary survey methodology. Tasmanian
Aquaculture and Fisheries Institute, FRDC Final Report, Project 2007/064.

West et al. NSW/ACT Recreational Fishing Survey – 2013/14
102 NSW Department of Primary Industries, December 2015
Lyle, J.M., Tracey, S.R., Stark, K.E., and Wotherspoon, S. (2009b). 2007-08 Survey of
Recreational Fishing in Tasmania. Tasmanian Aquaculture and Fisheries Institute.
Lyle, J.M., Stark, K.E., and Tracey, S.R. (2014). 2012-13 Survey of Recreational Fishing in
Tasmania. IMAS, University of Tasmania.
Murray-Jones, S. and Steffe, A.S. (2000). A comparison between the commercial and
recreational fisheries of the surf clam, Donax deltoides. Fisheries Research 44:219-233.
NRFWG (National Recreational Fisheries Working Group) (1994) Recreational Fishing in
Australia: A National Policy. Dept. Primary Industries and Energy, Canberra.
Ochwada-Doyle, F.A., McLeod, J., Barrett, G., Clarke, G. and Gray, C. (2014). Assesment of
Recreational Fishing in Three Recreational Fishing Havens in New South Wales. 139,
NSW Department of Primary Industries, Mosman, Australia.
Pink, B. Australian Statistical Geography Standard (ASGS): Volume 1 - Main Structure and
Greater Capital City Statistical Areas, July 2011. Catalogue No: 1270.0.55.001
R Core Team (2013). R: A language and environment for statistical computing. R Foundation for
Statistical Computing, Vienna, Austria.
Reid, D. D. and Montgomery, S.S. (2005). Creel survey based estimation of recreational harvest
of penaeid prawns in four southeastern Australian estuaries and comparison with
commercial catches. Fisheries Research 74:169-185.
Roy, P.S., Williams, R.J., Jones, A.R., Yassini, I., Gibbs, P.J., Coates, B., West, R.J., Scanes,
P.R., Hudson, J.P. and Nichol, S.( 2001). Structure and function of South-east
Australian estuaries. Estuarine, Coastal Shelf and Science 53:351-384
Scanes, P.R. (1988). The Impact of Eraring Power Station on the fish and fisheries of Lake
Macquarie. Report prepared for the Electricity commission of New South Wales. New
South Wales Fisheries, Fisheries Research Institute, Sydney, Australia. 111 pp.
SSA (2009). AS SSA S300-2009 Australian Fish Names Standard, 2nd Edition. Seafood
Services Australia.
Steffe, A., Chapman, D. and Murphy, J. (1999). A description of the charter fishing boat industry
operating in the coastal and estuarine waters of New South Wales during 1997-98.
NSW Fisheries Research Institute.
Steffe, A.S. (2005a). An assessment of changes in the daytime recreational fishery of Lake
Macquarie following the establishment of a 'Recreational Fishing Haven'. NSW Dept. of
Primary Industries, Cronulla, N.S.W.
Steffe, A.S., Murphy, J.J., Chapman, D.J., Barrett, G.P. and Gray, C. (2005b). An assessment of
changes in the daytime, boat-based, recreational fishery of the Tuross Lake estuary
following the establishment of a 'Recreational Fishing Haven'. Sydney : NSW
Department of Primary Industries.
Steffe, A.S., Murphy, J.J., Chapman, D.J., Tarlinton, B.E., Gordon, G.N.G., and Grinberg, A.
(1996a). An assessment of the impact of offshore recreational fishing in New South
Wales waters on the management of commercial fisheries. Final report to The Fisheries
Research and Development Corporation. Cronulla : NSW Fisheries Research Institute.
Steffe, A.S. and Murphy, J.J. (2011). Recreational fishing surveys in the Greater Sydney Region.
NSW Department. of Primary Industries, Cronulla, N.S.W.

West et al. NSW/ACT Recreational Fishing Survey – 2013/14
103 NSW Department of Primary Industries, December 2015
Steffe, A.S., Staines, J.F. and Murphy, J.J. (1996b). Recreational use of fisheries resources in
Northern New South Wales. Final report. NSW Fisheries, Cronulla.
Stewart, J., Rowling, K., Hegarty, A.M. and Nuttall, A. (2010). Size and age at sexual maturity of
snapper Pagrus auratus in New South Wales 2008/09. Industry & Investment NSW –
Fisheries Research Report Series No. 27. 38pp.
Webley, J.,McIness, K., Teixeira, D., Lawson, A., and Quinn, R. (2015, in press). Statewide
Recreational Fishing Survey, 2013-14. Fisheries Queensland, Department of
Agriculture and Fisheries.
West, L.D., Lyle, J.M., Matthews, S.R., Stark, K.E., and Steffe, A.S. (2012). Survey of
Recreational Fishing in the Northern Territory, 2009/10. Northern Territory
Government, Department of Primary Industry and Fisheries, Fisheries Report No: 109.
West, R.J. and Gordon, G.N.G. (1994). Commercial and recreational harvest of fish from two
Australian coastal rivers. Australian Journal of Marine and Freshwater Research
45:1259-1279.
Williams, R. J., Henry, G., Murphy, J., Smith, A., Grima, D., and Harvey, J. (1993). Jervis Bay
Marine Ecology study; Project 9: Commercial and recreational fishing and diving in
Jervis Bay. Fisheries Research Institute.

West et al. NSW/ACT Recreational Fishing Survey – 2013/14
104 NSW Department of Primary Industries, December 2015
Appendices
Appendix 1 Estimated number and proportion of the NSW and ACT resident population aged five years and older who fished recreationally in NSW or the
ACT during the 12 months prior to June 2013 - by gender, age and residential stratum. SE is standard error; values in bold indicate relative
standard error > 40%.
Residential
stratum
Male
Female
Total
Age
group
Pop'n
Fishers
SE
%
fishers
SE
Pop'n
Fishers
SE
%
fishers
SE
Pop'n
Fishers
SE
%
fishers
SE
Sydney
5 to 14
293,354
56,760
6,636
19.3
2.3
276,890
29,231
4,789
10.6
1.7
570,244
85,991
9,377
15.1
1.6
15 to 29
506,173
47,768
6,818
9.4
1.3
498,240
16,984
3,695
3.4
0.7
1,004,413
64,752
8,435
6.4
0.8
30 to 44
529,722
79,622
7,923
15.0
1.5
540,154
22,935
4,090
4.2
0.8
1,069,876
102,558
10,154
9.6
0.9
45 to 59
437,395
62,086
5,565
14.2
1.3
452,960
21,762
3,366
4.8
0.7
890,355
83,849
7,594
9.4
0.9
60 plus
389,039
30,678
3,558
7.9
0.9
434,587
7,731
1,820
1.8
0.4
823,626
38,409
4,392
4.7
0.5
Total
2,155,683
276,915
16,897
12.8
0.8
2,202,831
98,644
9,942
4.5
0.5
4,358,514
375,558
23,716
8.6
0.5
Hunter
5 to 14
39,866
10,501
1,694
26.3
4.2
37,463
8,592
1,583
22.9
4.2
77,329
19,094
2,588
24.7
3.3
15 to 29
61,974
11,609
1,874
18.7
3.0
59,346
5,006
1,326
8.4
2.2
121,320
16,615
2,515
13.7
2.1
30 to 44
58,706
15,265
1,910
26.0
3.3
59,255
7,206
1,331
12.2
2.2
117,961
22,471
2,819
19.0
2.4
45 to 59
60,150
13,180
1,587
21.9
2.6
60,984
3,731
851
6.1
1.4
121,134
16,911
2,058
14.0
1.7
60 plus
63,630
8,620
1,120
13.5
1.8
70,252
2,488
577
3.5
0.8
133,882
11,108
1,431
8.3
1.1
Total
284,326
59,176
4,615
20.8
1.6
287,300
27,024
3,241
9.4
1.1
571,626
86,200
6,858
15.1
1.2
Illawarra
5 to 14
27,886
12,067
1,739
43.3
6.2
26,405
7,137
1,142
27.0
4.3
54,291
19,204
2,438
35.4
4.5
15 to 29
41,048
9,383
1,548
22.9
3.8
39,216
2,820
1,128
7.2
2.9
80,264
12,204
2,064
15.2
2.6
30 to 44
37,857
11,234
1,451
29.7
3.8
39,369
5,314
1,132
13.5
2.9
77,226
16,548
2,175
21.4
2.8
45 to 59
42,357
9,988
1,300
23.6
3.1
44,075
3,878
796
8.8
1.8
86,432
13,866
1,755
16.0
2.0
60 plus
50,219
8,879
1,194
17.7
2.4
54,729
1,999
493
3.7
0.9
104,948
10,879
1,418
10.4
1.4
Total
199,367
51,551
3,883
25.9
1.9
203,794
21,149
2,627
10.4
1.3
403,161
72,700
5,661
18.0
1.4

West et al. NSW/ACT Recreational Fishing Survey – 2013/14
105 NSW Department of Primary Industries, December 2015
Appendix 1, continued
Residential
stratum
Male
Female
Total
Age
group
Pop'n
Fishers
SE
%
fishers
SE
Pop'n
Fishers
SE
%
fishers
SE
Pop'n
Fishers
SE
%
fishers
SE
Richmond/Tweed
5 to 14
15,172
5,808
950
38.3
6.3
14,649
3,302
736
22.5
5.0
29,821
9,110
1,333
30.5
4.5
15 to 29
18,668
3,585
847
19.2
4.5
18,276
2,590
974
14.2
5.3
36,944
6,175
1,326
16.7
3.6
30 to 44
19,261
7,811
913
40.6
4.7
21,407
3,046
648
14.2
3.0
40,668
10,857
1,299
26.7
3.2
45 to 59
25,274
5,515
794
21.8
3.1
27,082
2,608
573
9.6
2.1
52,356
8,123
1,143
15.5
2.2
60 plus
29,460
3,885
645
13.2
2.2
31,777
1,046
310
3.3
1.0
61,237
4,932
798
8.1
1.3
Total
107,835
26,603
2,187
24.7
2.0
113,191
12,593
1,773
11.1
1.6
221,026
39,196
3,470
17.7
1.6
Mid North Coast
5 to 14
22,013
7,406
1,403
33.6
6.4
20,967
4,134
1,197
19.7
5.7
42,980
11,541
2,087
26.9
4.9
15 to 29
25,239
5,820
1,205
23.1
4.8
24,768
2,242
1,051
9.1
4.2
50,007
8,062
1,813
16.1
3.6
30 to 44
25,102
9,391
1,309
37.4
5.2
27,510
3,943
957
14.3
3.5
52,612
13,334
1,934
25.3
3.7
45 to 59
35,051
7,272
1,164
20.7
3.3
37,849
3,837
865
10.1
2.3
72,900
11,109
1,761
15.2
2.4
60 plus
49,668
8,841
1,030
17.8
2.1
51,782
2,647
570
5.1
1.1
101,450
11,488
1,333
11.3
1.3
Total
157,073
38,730
3,221
24.7
2.1
162,876
16,803
2,425
10.3
1.5
319,949
55,533
5,026
17.4
1.6
Central West/North
5 to 14
27,662
5,995
1,279
21.7
4.6
25,882
5,520
1,167
21.3
4.5
53,544
11,515
1,853
21.5
3.5
15 to 29
36,734
7,450
1,607
20.3
4.4
35,392
2,604
947
7.4
2.7
72,126
10,054
2,171
13.9
3.0
30 to 44
33,117
9,440
1,311
28.5
4.0
34,520
4,998
978
14.5
2.8
67,637
14,438
1,969
21.3
2.9
45 to 59
38,577
9,940
1,190
25.8
3.1
38,114
3,991
817
10.5
2.1
76,691
13,931
1,604
18.2
2.1
60 plus
43,273
5,470
915
12.6
2.1
45,460
766
295
1.7
0.6
88,733
6,235
1,036
7.0
1.2
Total
179,363
38,295
3,468
21.4
1.9
179,368
17,879
2,392
10.0
1.3
358,731
56,174
5,207
15.7
1.5
North West
5 to 14
8,495
2,386
417
28.1
4.9
7,937
1,903
409
24.0
5.2
16,432
4,289
671
26.1
4.1
15 to 29
10,744
2,622
536
24.4
5.0
10,439
1,240
370
11.9
3.5
21,183
3,862
737
18.2
3.5
30 to 44
9,943
3,059
401
30.8
4.0
10,562
1,601
317
15.2
3.0
20,505
4,660
615
22.7
3.0
45 to 59
11,909
3,627
442
30.5
3.7
11,762
1,188
282
10.1
2.4
23,671
4,815
596
20.3
2.5
60 plus
13,031
1,461
271
11.2
2.1
13,229
431
128
3.3
1.0
26,260
1,892
328
7.2
1.2
Total
54,122
13,155
1,160
24.3
2.1
53,929
6,364
878
11.8
1.6
108,051
19,519
1,806
18.1
1.7

West et al. NSW/ACT Recreational Fishing Survey – 2013/14
106 NSW Department of Primary Industries, December 2015
Appendix 1, continued
Residential
stratum
Male
Female
Total
Age
group
Pop'n
Fishers
SE
%
fishers
SE
Pop'n
Fishers
SE
%
fishers
SE
Pop'n
Fishers
SE
%
fishers
SE
South East
5 to 14
14,381
4,698
989
32.7
6.9
13,553
2,695
891
19.9
6.6
27,934
7,393
1,498
26.5
5.4
15 to 29
17,854
6,025
1,122
33.7
6.3
16,685
2,153
673
12.9
4.0
34,539
8,178
1,567
23.7
4.5
30 to 44
18,672
5,424
810
29.1
4.3
19,838
3,222
690
16.2
3.5
38,510
8,647
1,273
22.5
3.3
45 to 59
23,862
7,371
936
30.9
3.9
23,637
2,973
644
12.6
2.7
47,499
10,344
1,263
21.8
2.7
60 plus
26,592
5,913
735
22.2
2.8
26,990
1,411
360
5.2
1.3
53,582
7,324
918
13.7
1.7
Total
101,361
29,431
2,503
29.0
2.5
100,703
12,455
1,832
12.4
1.8
202,064
41,886
3,850
20.7
1.9
South West
5 to 14
18,418
6,927
1,096
37.6
5.9
17,612
4,383
916
24.9
5.2
36,030
11,309
1,598
31.4
4.4
15 to 29
25,874
7,212
1,269
27.9
4.9
25,098
3,774
948
15.0
3.8
50,972
10,987
1,675
21.6
3.3
30 to 44
23,336
9,325
1,032
40.0
4.4
23,687
3,281
706
13.8
3.0
47,023
12,606
1,477
26.8
3.1
45 to 59
26,603
6,019
848
22.6
3.2
26,536
2,751
583
10.4
2.2
53,139
8,770
1,138
16.5
2.1
60 plus
30,082
5,343
753
17.8
2.5
31,093
816
271
2.6
0.9
61,175
6,159
850
10.1
1.4
Total
124,313
34,827
2,750
28.0
2.2
124,026
15,005
1,868
12.1
1.5
248,339
49,831
4,009
20.1
1.6
ACT
5 to 14
22,610
5,003
917
22.1
4.1
21,604
2,359
653
10.9
3.0
44,214
7,362
1,265
16.7
2.9
15 to 29
41,847
7,168
1,311
17.1
3.1
41,267
2,401
847
5.8
2.1
83,114
9,569
1,766
11.5
2.1
30 to 44
43,156
7,256
1,125
16.8
2.6
43,534
4,264
895
9.8
2.1
86,690
11,520
1,681
13.3
1.9
45 to 59
34,389
6,736
972
19.6
2.8
35,876
1,615
428
4.5
1.2
70,265
8,350
1,178
11.9
1.7
60 plus
28,129
2,423
572
8.6
2.0
31,648
809
291
2.6
0.9
59,777
3,232
706
5.4
1.2
Total
170,131
28,586
2,631
16.8
1.5
173,929
11,447
1,585
6.6
0.9
344,060
40,034
3,708
11.6
1.1
Total - NSW/ACT
5 to 14
489,857
117,551
7,591
24.0
1.5
462,962
69,256
5,684
15.0
1.2
952,819
186,807
10,816
19.6
1.1
15 to 29
786,155
108,643
7,875
13.8
1.0
768,727
41,815
4,673
5.4
0.6
1,554,882
150,458
10,021
9.7
0.6
30 to 44
798,872
157,828
8,714
19.8
1.1
819,836
59,811
4,894
7.3
0.6
1,618,708
217,639
11,493
13.4
0.7
45 to 59
735,567
131,733
6,428
17.9
0.9
758,875
48,335
3,930
6.4
0.5
1,494,442
180,068
8,752
12.0
0.6
60 plus
723,123
81,515
4,377
11.3
0.6
791,547
20,144
2,169
2.5
0.3
1,514,670
101,659
5,386
6.7
0.4
Total
3,533,574
597,270
19,265
16.9
0.5
3,601,947
239,361
11,880
6.6
0.3
7,135,521
836,632
27,456
11.7
0.4

West et al. NSW/ACT Recreational Fishing Survey – 2013/14
107 NSW Department of Primary Industries, December 2015
Appendix 2 Annual recreational catch (total, kept and released numbers) in NSW/ACT waters during 2013/14 by residents aged five years and older - by
reporting group and species. SE is standard error; values in bold indicate relative standard error > 40%; values in italics indicate fewer than 30
households recorded catches of the species.
Total
Kept
Released
Reporting group
Standard Fish Name
Scientific name/s
Number
SE
Number
SE
Number
SE
Bream
Bream
Acanthopagrus spp.
2,205,656
299,714
614,434
107,686
1,591,221
246,909
Flathead, Dusky
Dusky Flathead
Platycephalus fuscus
1,058,613
132,768
481,164
63,864
577,448
82,707
Flathead, Sand
Sand Flathead
Platycephalus caeruleopunctatus & bassensis
962,892
181,433
440,763
98,777
522,129
89,480
Flathead, Tiger
Tiger Flathead
Platycephalus richardsoni
82,330
31,558
39,417
14,738
42,913
19,117
Leatherjacket
Leatherjacket
Balistidae & Monacanthidae - undifferentiated
116,622
26,752
71,269
21,133
45,353
11,091
Luderick
Luderick
Girella tricuspidata
428,213
186,579
250,074
102,050
178,139
90,456
Mulloway
Mulloway
Argyrosomus hololepidotus
111,573
35,512
21,361
4,481
90,211
34,588
Red Rock Cod
Red Rock Cod
Scorpaena jacksoniensis
151,531
34,435
6,430
3,022
145,100
33,952
Salmon, Australian
Australian Salmon
Arripis spp.
144,706
27,036
73,535
17,779
71,171
17,321
Sharks
Gummy Shark
Mustelus antarcticus
4,000
1,553
1,020
432
2,980
1,449
Hammerhead Shark
Sphyrnidae - undifferentiated
2,030
1,824
2,030
1,824
Mako Shark
Isurus oxyrinchus
297
209
297
209
Port Jackson Shark
Heterodontus portusjacksoni
3,240
1,715
3,240
1,715
School Shark
Galeorhinus galeus
386
385
386
385
Tiger Shark
Galeocerdo cuvier
268
247
268
247
Whaler Shark
Carcharhinidae
13,488
6,634
1,683
978
11,805
6,504
Wobbegong Shark
Brachaeluridae - undifferentiated
9,510
5,234
9,510
5,234
Shark, other
Several families - undifferentiated
613
458
613
458
Shark, unspecified
Several families - undifferentiated
3,871
1,616
3,871
1,616
Rays
Shovelnose Ray
Aptychotrema rostrata
35,627
10,515
1,959
864
33,668
10,243
Ray, other
Dasyatidae - undifferentiated
34,506
7,064
234
233
34,272
7,060
Ray, unspecified
Dasyatidae - undifferentiated
1,103
713
1,103
713
Silver Trevally
Silver Trevally
Pseudocaranx dentex
87,501
23,509
49,081
17,410
38,420
8,952
Snapper
Snapper
Pagrus auratus
755,350
144,387
185,590
29,943
569,760
135,449
Swallowtail Dart
Swallowtail Dart
Trachinotus coppingeri
118,935
39,889
43,275
18,872
75,661
25,676
Tailor
Tailor
Pomatomus saltatrix
363,147
59,901
189,614
40,826
173,533
32,817

West et al. NSW/ACT Recreational Fishing Survey – 2013/14
108 NSW Department of Primary Industries, December 2015
Appendix 2, continued
Total
Kept
Released
Reporting group
Standard Fish Name
Scientific name/s
Number
SE
Number
SE
Number
SE
Tunas
Albacore Tuna
Thunnus alalunga
2,267
1,664
1,164
827
1,104
954
Bonito
Sarda spp.
48,082
28,429
40,231
24,104
7,851
4,769
Mackerel Tuna
Euthynnus affinis
2,394
1,022
1,562
751
832
567
Northern Bluefin Tuna
Thunnus tonggol
828
590
665
519
163
162
Skipjack Tuna
Katsuwonus pelamis
966
700
966
700
Yellowfin Tuna
Thunnus albacares
2,510
943
1,745
716
765
455
Whiting, Sand
Sand Whiting
Sillago ciliata
568,827
111,478
247,470
56,795
321,357
68,607
Whiting, School
School Whiting
Sillago flindersi
11,807
4,278
4,995
2,078
6,813
2,645
Whiting, Trumpeter
Trumpeter Whiting
Sillago maculata
152,986
104,916
123,580
100,107
29,406
18,174
Wrasse/gropers
Blue Groper
Achoerodus viridis
9,620
4,834
3,529
1,985
6,092
4,248
Maori Wrasse
Ophthalmolepis lineolata
18,088
6,027
4,141
1,565
13,946
5,541
Pigfish
Bodianus unimaculatus
2,374
1,166
1,901
944
473
489
Parrotfish
Scaridae - undifferentiated
8,567
4,224
436
290
8,131
4,214
Tuskfish
Choerodon spp.
2,207
1,174
226
168
1,981
1,156
Wrasse, other
Labridae - undifferentiated
65,510
26,378
7,664
4,438
57,846
25,401
Wrasse, unspecified
Labridae - undifferentiated
5,434
1,930
1,406
786
4,028
1,744
Yellowtail Kingfish
Yellowtail Kingfish
Seriola lalandi
96,115
29,791
35,134
13,720
60,981
22,968
Baitfish
Blue Mackerel
Scomber australasicus
137,119
37,988
125,129
37,285
11,990
3,785
Mullet
Mugilidae - undifferentiated
98,859
26,572
71,725
21,899
27,134
11,388
Yellowtail Scad
Trachurus novaezelandiae
143,230
41,272
90,182
33,361
53,048
19,684
Herring
Clupeidae - undifferentiated
291,749
148,514
287,290
148,180
4,459
3,320
Pilchard
Clupeidae - undifferentiated
5,527
5,435
5,527
5,435
Other small baitfish
Several families - undifferentiated
20,735
10,954
20,735
10,954
Freshwater fish
Australian Bass
Macquaria novemaculeata
195,802
62,660
11,305
3,690
184,497
60,569
European Carp
Cyprinus carpio
500,164
84,945
498,735
84,914
1,428
1,074
Golden Perch
Macquaria ambigua
142,601
18,752
76,529
11,117
66,072
10,703
Murray Cod
Maccullochella peelii
165,557
29,865
20,816
4,383
144,741
28,013
Redfin Perch
Perca fluviatilis
136,279
52,588
44,426
14,649
91,853
47,557
Brown Trout
Salmo trutta
85,275
24,849
59,935
21,319
25,340
6,283
Rainbow Trout
Oncorhynchus mykiss
72,700
18,485
47,885
14,583
24,815
6,678

West et al. NSW/ACT Recreational Fishing Survey – 2013/14
109 NSW Department of Primary Industries, December 2015
Appendix 2, continued
Total
Kept
Released
Reporting group
Standard Fish Name
Scientific name/s
Number
SE
Number
SE
Number
SE
Scalefish, other
Amberjack
Seriola dumerili
204
202
204
202
(saltwater)
Barracuda
Sphyraena barracuda
1,867
1,069
279
196
1,588
945
Batfish/butter bream
Monodactylus argenteus
7,639
2,744
874
871
6,764
2,602
Cobia
Rachycentron canadum
433
273
224
162
209
147
Cod/groupers
Serranidae - undifferentiated
21,301
5,106
1,749
856
19,552
4,993
Dolphinfish
Coryphaena hippurus
74,859
28,913
25,509
7,551
49,350
22,977
Drummer, Rock Blackfish
Girella elevata
53,502
24,534
34,631
16,109
18,871
9,227
Drummer, Silver
Kyphosus sydneyanus
3,856
2,192
1,541
1,142
2,315
1,283
Eastern Wirrah
Acanthistius ocellatus
1,781
1,369
213
210
1,568
1,353
Emperor, unspecified
Lethrinidae - undifferentiated
109
108
109
108
Fish, unknown
Several families - undifferentiated
1,552
731
1,552
731
Flounder/sole
Bothidae & Pleuronectidae spp, Soleidae
40,929
8,184
21,864
4,757
19,065
5,658
Fusilier
Caesio & Pterocaesio spp.
870
862
870
862
Garfish
Hemiramphidae - undifferentiated
21,863
7,540
18,838
7,304
3,025
1,358
Gurnard
Triglidae & Peristediidae - undifferentiated
5,812
2,576
1,390
917
4,422
2,310
Long Tom
Belonidae - undifferentiated
1,794
751
322
320
1,473
679
Mackerel, Narrow-barred
Scomberomorus commerson
5,906
2,222
5,283
2,178
623
443
Mackerel, Spotted
Scomberomorus munroi
13,303
6,532
13,140
6,530
163
162
Marlin, Black
Makaira indica
898
495
283
282
615
406
Marlin, Blue
Makaira nigricans
216
151
216
151
Marlin, Striped
Tetrapturus audax
163
162
163
162
Morwong, Grey
Nemadactylus douglasii
33,431
7,889
30,211
7,596
3,219
1,178
Morwong, Red
Cheilodactylus fuscus
16,661
8,245
10,299
5,249
6,362
4,571
Pearl Perch
Glaucosoma scapulare
6,527
2,970
4,434
2,067
2,093
1,131
Perch, unspecified
Percichthyidae & Serranidae - undifferentiated
385
378
385
378
Pike
Sphyraenidae - undifferentiated
12,620
4,233
147
112
12,473
4,232
Queenfish
Scomberoides spp.
183
181
183
181
Redfish
Centroberyx affinis
38,146
15,022
21,450
13,154
16,696
6,795
Rock Cale/Kelpfish
Chironemidae & Aplodactylidae - undifferentiated
11,891
8,400
11,891
8,400

West et al. NSW/ACT Recreational Fishing Survey – 2013/14
110 NSW Department of Primary Industries, December 2015
Appendix 2, continued
Total
Kept
Released
Reporting group
Standard Fish Name
Scientific name/s
Number
SE
Number
SE
Number
SE
Scalefish, other
Sergeant Baker
Aulopus purpurissatus
101,794
35,282
8,314
5,221
93,480
31,000
(saltwater) continued
Silverbiddy
Gerreidae - undifferentiated
9,692
9,671
6,461
6,447
3,231
3,224
Snapper, Mangrove jack
Lutjanus argentimaculatus
281
280
140
140
140
140
Snapper, Russels/moses
Lutjanus russellii
653
611
40
42
613
609
Snapper, other
Lutjanus - undifferentiated
84
83
84
83
Stargazer
Uranoscopidae - undifferentiated
349
258
349
258
Sweep
Scorpis lineolata
39,790
13,192
9,167
4,923
30,623
12,270
Tarwhine
Rhabdosargus sarba
59,236
22,163
18,759
6,761
40,477
18,158
Teraglin
Atractoscion aequidens
46,150
11,321
32,574
7,846
13,575
4,917
Toads/pufferfish
Tetraodontidae & Ostraciidae - undifferentiated
37,782
9,120
37,782
9,120
Trevally, Giant
Caranx ignobilis
483
446
322
298
161
149
Trevally, other
Carangidae - undifferentiated
51
51
51
51
Trumpeter, Bastard
Latridopsis forsteri
278
275
278
275
Trumpeter/grunters
Terapontidae
5,108
1,861
121
119
4,988
1,857
Wahoo
Acanthocybium solandri
40
42
40
42
Scalefish, other
Atlantic Salmon
Salmo salar
529
393
406
349
123
128
(freshwater)
Bony Bream
Nematalosa erebi & Nematalosa vlaminghi
7,627
2,909
2,670
2,173
4,957
1,940
Eastern Cod
Maccullochella ikei
920
587
920
587
River Blackfish
Gadopsis marmoratus
1,144
1,140
1,144
1,140
Silver Perch
Bidyanus bidyanus
14,870
4,585
4,040
2,331
10,831
3,946
Spangled Perch
Leiopotherapon unicolor
8,105
7,867
8,105
7,867
Trout Cod
Maccullochella macquariensis
13,353
7,727
13,353
7,727
Scalefish, other
Catfish, eeltail
Plotosidae - undifferentiated
54,870
13,123
1,479
1,342
53,391
13,046
(saltwater and
Catfish, forktail
Ariidae - undifferentiated
23,403
8,566
363
358
23,040
8,529
freshwater)
Catfish, unspecified
Plotosidae - undifferentiated
36,880
32,513
36,760
32,513
120
117
Eel
Several families - undifferentiated
30,341
7,529
4,275
2,502
26,066
7,113
Blue Swimmer Crab
Blue Swimmer Crab
Portunus pelagicus
73,501
20,944
50,637
14,220
22,864
9,014
Mud Crab
Mud Crab
Scylla spp.
48,634
14,075
30,052
8,865
18,582
6,325
Rock lobster
Rock lobster
Palinuridae - undifferentiated
26,507
14,273
23,216
12,501
3,291
2,798

West et al. NSW/ACT Recreational Fishing Survey – 2013/14
111 NSW Department of Primary Industries, December 2015
Appendix 2, continued
Total
Kept
Released
Reporting group
Standard Fish Name
Scientific name/s
Number
SE
Number
SE
Number
SE
Prawns (saltwater)
Prawns (saltwater)
Penaeidae - undifferentiated
728,843
426,343
724,756
426,343
4,087
2,861
Shrimp (freshwater)
Shrimp (freshwater)
Palaemonidae - undifferentiated
409,711
148,424
330,025
108,398
79,686
62,268
Nippers (saltwater)
Nippers (saltwater)
Trypaea australiensis
1,415,852
403,605
1,319,066
367,909
96,787
71,069
Yabbies (freshwater)
Yabbies (freshwater)
Cherax spp.
275,108
92,992
239,838
89,047
35,270
18,012
Crustaceans, other
Murray Crayfish
Euastacus armatus
1,167
755
346
217
821
587
Razorfish
Pinna dolabrata
2,255
2,242
2,255
2,242
Crabs, other
Brachyura - undifferentiated
6,448
6,178
6,448
6,178
Squids
Squids
Loliginidae - undifferentiated
111,799
53,498
105,308
51,757
6,491
4,737
Cephalopods, other
Cuttlefish
Sepiidae - undifferentiated
11,292
8,518
6,359
4,591
4,933
4,166
Southern Calamari
Sepioteuthis australis
6,472
5,549
6,472
5,549
Octopus
Octopodidae - undifferentiated
6,801
2,583
306
221
6,495
2,569
Abalone
Abalone
Haliotidae - undifferentiated
18,843
11,735
18,423
11,718
421
413
Pipis
Pipis
Donax (Plebidonax) deltoides
90,452
31,719
87,760
31,272
2,692
2,653
Worms
Beach worms
Arenicolidae - undifferentiated
239,085
85,662
239,085
85,662
Blood worms
Glycera spp.
12,471
12,205
12,471
12,205
Worms, other
Class Polychaeta - undifferentiated
10,622
10,543
10,622
10,543
Other taxa
Cunjuvoi
Pyura praeputialis
1,013
1,002
1,013
1,002
Non-fish, other
Several families - undifferentiated
62
61
62
61

West et al. NSW/ACT Recreational Fishing Survey – 2013/14
112 NSW Department of Primary Industries, December 2015
Appendix 3 Annual recreational catch (kept and released numbers) of key species in NSW/ACT
waters during 2013/14, by residents aged five years and older - by targeted and non-
targeted effort. SE is standard error; values in bold indicate relative standard error > 40%;
values in italics indicate fewer than 30 households recorded catches of the species.
Targeted
Non-targeted
%
Species/group
Number
SE
Number
SE
targeted
Bream
1,185,608
237,660
1,020,048
110,422
53.8
Flathead, Dusky
678,678
107,257
379,935
60,737
64.1
Flathead, Sand
613,034
153,414
349,858
55,907
63.7
Flathead, Tiger
57,381
29,450
24,949
10,852
69.7
Leatherjacket
5,375
3,808
111,247
26,492
4.6
Luderick
351,703
185,438
76,509
20,438
82.1
Mulloway
63,394
30,531
48,179
17,946
56.8
Red Rock Cod
131
131
151,400
34,432
0.1
Salmon, Australian
71,053
20,020
73,653
15,636
49.1
Sharks and rays
251
247
108,686
19,303
0.2
Silver Trevally
14,945
12,138
72,556
15,738
17.1
Snapper
225,491
41,012
529,859
137,162
29.9
Swallowtail Dart
48,558
26,653
70,377
21,864
40.8
Tailor
165,796
40,483
197,352
37,147
45.7
Tunas
40,269
28,230
16,778
3,927
70.6
Whiting, Sand
307,164
70,128
261,663
55,397
54.0
Whiting, School
390
277
11,418
4,269
3.3
Whiting, Trumpeter
109,899
90,145
43,087
19,064
71.8
Wrasse/gropers
8,260
5,970
103,539
32,965
7.4
Yellowtail Kingfish
63,223
21,200
32,892
13,727
65.8
Blue Mackerel
64,835
29,439
72,284
24,000
47.3
Mullet
41,987
13,667
56,872
21,363
42.5
Yellowtail Scad
37,206
16,506
106,024
34,178
26.0
Other small baitfish
219,730
110,931
98,280
71,079
69.1
Australian Bass
154,872
56,903
40,930
20,837
79.1
European Carp
91,399
49,612
408,765
66,316
18.3
Golden Perch
116,952
16,999
25,649
5,344
82.0
Murray Cod
120,808
25,295
44,749
8,208
73.0
Redfin Perch
110,385
50,934
25,893
6,221
81.0
Trout
151,725
37,204
6,250
3,208
96.0
Scalefish, other
139,532
33,581
732,983
90,975
16.0
Blue Swimmer Crab
54,183
20,137
19,318
5,954
73.7
Mud Crab
46,001
13,977
2,633
1,188
94.6
Rock lobster
17,378
9,862
9,129
8,304
65.6
Prawns (saltwater)
728,843
426,343
100.0
Shrimp (freshwater)
403,215
148,321
6,497
4,697
98.4
Nippers (saltwater)
1,415,852
403,605
100.0
Yabbies (freshwater)
272,932
92,978
2,177
1,244
99.2
Crustaceans, other
9,761
6,615
109
108
98.9
Squids
94,195
51,828
17,604
6,376
84.3
Cephalopods, other
16,616
13,926
7,948
2,669
67.6
Abalone
5,882
3,515
12,961
8,556
31.2
Pipis
90,452
31,719
100.0
Worms
262,178
94,992
100.0
Other taxa
1,013
1,002
62
61
94.3

West et al. NSW/ACT Recreational Fishing Survey – 2013/14
113 NSW Department of Primary Industries, December 2015
Appendix 4 Annual recreational harvest (kept numbers) of key species in NSW/ACT waters during
2013/14, by residents aged five years and older - by targeted and non-targeted effort. SE
is standard error; values in bold indicate relative standard error > 40%; values in italics
indicate fewer than 30 households recorded catches of the species.
Targeted
Non-targeted
%
Species/group
Number
SE
Number
SE
targeted
Bream
375,788
90,015
238,647
35,853
61.2
Flathead, Dusky
329,341
55,647
151,823
22,316
68.4
Flathead, Sand
291,752
80,227
149,011
28,810
66.2
Flathead, Tiger
30,834
13,938
8,583
4,605
78.2
Leatherjacket
3,203
2,906
68,067
20,942
4.5
Luderick
209,917
101,178
40,157
12,204
83.9
Mulloway
8,716
3,173
12,646
3,121
40.8
Red Rock Cod
131
131
6,300
2,990
2.0
Salmon, Australian
39,534
14,078
34,001
10,419
53.8
Sharks and rays
251
247
5,031
1,356
4.8
Silver Trevally
12,651
10,130
36,431
9,548
25.8
Snapper
103,423
20,311
82,167
20,002
55.7
Swallowtail Dart
27,138
16,147
16,137
6,282
62.7
Tailor
110,862
32,036
78,752
19,184
58.5
Tunas
32,042
23,885
14,291
3,312
69.2
Whiting, Sand
156,641
42,123
90,828
21,673
63.3
Whiting, School
163
163
4,831
2,071
3.3
Whiting, Trumpeter
103,331
88,771
20,249
11,893
83.6
Wrasse/gropers
4,722
3,575
14,581
3,863
24.5
Yellowtail Kingfish
19,346
7,083
15,788
11,456
55.1
Blue Mackerel
62,197
29,173
62,932
23,199
49.7
Mullet
36,526
12,714
35,199
17,420
50.9
Yellowtail Scad
24,140
12,510
66,042
28,407
26.8
Other small baitfish
219,730
110,931
93,822
70,635
70.1
Australian Bass
5,420
3,091
5,885
1,957
47.9
European Carp
91,399
49,612
407,336
66,276
18.3
Golden Perch
62,814
9,770
13,715
3,437
82.1
Murray Cod
13,736
3,705
7,080
2,214
66.0
Redfin Perch
34,767
14,362
9,659
2,933
78.3
Trout
104,197
30,910
3,623
2,499
96.6
Scalefish, other
78,548
17,529
242,320
46,200
24.5
Blue Swimmer Crab
39,280
13,620
11,356
4,259
77.6
Mud Crab
28,979
8,772
1,073
483
96.4
Rock lobster
14,087
7,372
9,129
8,304
60.7
Prawns (saltwater)
724,756
426,343
100.0
Shrimp (freshwater)
325,696
108,317
4,329
4,188
98.7
Nippers (saltwater)
1,319,066
367,909
100.0
Yabbies (freshwater)
237,854
89,034
1,984
1,230
99.2
Crustaceans, other
8,940
6,575
109
108
98.8
Squids
89,222
50,035
16,086
6,309
84.7
Cephalopods, other
11,979
9,848
1,157
667
91.2
Abalone
5,882
3,515
12,540
8,533
31.9
Pipis
87,760
31,272
100.0
Worms
262,178
94,992
100.0
Other taxa
1,013
1,002
100.0

West et al. NSW/ACT Recreational Fishing Survey – 2013/14
114 NSW Department of Primary Industries, December 2015
Appendix 5 Annual harvest of key species in NSW waters by NSW/ACT residents, aged five years and older - indicative estimates of the total weight
(tonnes), compared with estimates for the commercial fisheries sector during 2013/14.
Recreational Estuarine Harvest Recreational Marine Harvest Total Harvest (t)
%
Recreational
Species/ group Numbers
Average
weight (g)
Total
weight (t)
Numbers
Average
weight (g)
Total
weight (t)
Recreational
(t)
Commercial
(t)
Grand
Total (t)
Bream
497,270
525
261
117,164
589
69
330
343
672
49.1
Flathead, Dusky
468,978
593
278
9,691
1,023
10
288
115
404
71.4
Flathead, Sand
61,715
409
25
379,048
488
185
210
101
311
67.5
Mulloway
14,181
2,530
36
7,181
2,897
21
57
59
116
49.0
Salmon, Australian
24,759
2,870
71
48,776
2,283
111
182
1,112
1,294
14.1
Silver Trevally
23,036
543
13
26,046
558
15
27
168
195
13.9
Snapper
39,544
564
22
146,046
860
126
148
220
368
40.2
Tailor
52,933
499
26
136,681
593
81
107
62
169
63.5
Whiting, Sand
180,864
278
50
66,606
278
19
69
79
148
46.5
Yellowtail Kingfish
2,046
3,223
7
33,088
3,434
114
120
109
229
52.5

West et al. NSW/ACT Recreational Fishing Survey – 2013/14
115 NSW Department of Primary Industries, December 2015
Appendix 6 Annual recreational effort (numbers of fishers and fisher days) and catch (kept and released numbers) of key species by water body type during
2013/14, by NSW/ACT residents aged five years and older. SE is standard error; values in bold indicate relative standard error > 40%; values in
italics indicate fewer than 30 households recorded catches of the species.
Offshore
Inshore
Estuary
River
Lake/dam
Species/group
Number
SE
Number
SE
Number
SE
Number
SE
Number
SE
Effort
Fishers
24,576
4,472
234,531
16,111
522,009
28,458
129,691
10,093
104,026
9,046
Fisher days
54,773
14,316
695,542
60,058
1,795,958
125,190
359,490
32,802
300,533
35,081
Catch
Bream
257,142
38,667
1,947,059
291,295
1,455
934
Flathead, Dusky
162
163
36,593
16,793
1,018,321
131,180
3,536
2,520
Flathead, Sand
134,470
53,517
666,050
129,453
162,372
65,700
Flathead, Tiger
10,496
8,488
65,522
29,697
6,312
4,356
Leatherjacket
8,928
5,136
58,712
18,377
48,982
14,227
Luderick
105,070
42,360
323,142
181,284
Mulloway
864
592
13,663
4,876
97,045
35,131
Red Rock Cod
19,725
7,622
118,470
32,716
13,336
5,600
Salmon, Australian
4,111
2,854
100,115
21,231
40,480
13,759
Sharks and rays
3,128
1,264
57,928
14,346
47,881
12,742
Silver Trevally
2,699
1,765
47,847
13,478
36,955
19,198
Snapper
57,673
18,536
235,764
39,565
461,913
135,807
Swallowtail Dart
114,259
39,816
4,676
2,428
Tailor
1,869
980
181,215
42,999
180,064
39,057
Tunas
16,459
8,279
36,302
23,007
4,287
2,486
Whiting, Sand
113,741
23,925
455,086
100,635
Whiting, School
1,424
1,062
206
206
10,178
4,113
Whiting, Trumpeter
152,986
104,916
Wrasse/gropers
11,999
5,401
91,764
33,476
8,036
2,415
Yellowtail Kingfish
30,176
21,116
49,013
16,904
16,927
9,242
Blue Mackerel
14,601
5,507
79,619
24,975
42,898
26,861
Mullet
8,913
4,169
72,340
19,807
17,606
16,405
Yellowtail Scad
2,970
2,201
67,875
25,246
72,385
31,145
Other small baitfish
4,322
3,600
313,688
150,342

West et al. NSW/ACT Recreational Fishing Survey – 2013/14
116 NSW Department of Primary Industries, December 2015
Appendix 6, continued
Offshore
Inshore
Estuary
River
Lake/dam
Species/group
Number
SE
Number
SE
Number
SE
Number
SE
Number
SE
Australian Bass
3,621
1,567
82,152
30,346
110,029
53,963
European Carp
437,111
80,667
63,053
16,933
Golden Perch
77,026
13,392
65,574
11,563
Murray Cod
145,467
28,594
20,090
6,780
Redfin Perch
41,804
37,644
94,475
36,674
Trout
27,719
7,021
130,256
37,914
Scalefish, other
96,958
26,414
392,985
82,966
265,383
41,108
84,379
34,426
32,809
15,708
Blue Swimmer Crab
744
443
72,757
20,941
Mud Crab
48,634
14,075
Rock lobster
21,425
13,068
5,082
3,179
Prawns (saltwater)
728,843
426,343
Shrimp (freshwater)
375,309
142,794
34,403
23,582
Nippers (saltwater)
1,415,852
403,605
Yabbies (freshwater)
89,886
58,991
185,222
62,057
Crustaceans, other
6,448
6,178
2,255
2,242
1,167
755
Squids
22,243
7,903
89,556
52,223
Cephalopods, other
2,366
1,219
22,198
14,129
Abalone
17,461
10,544
1,383
1,377
Pipis
88,651
31,668
1,802
1,789
Worms
199,307
69,587
62,870
40,673
Other taxa
1,074
1,004

West et al. NSW/ACT Recreational Fishing Survey – 2013/14
117 NSW Department of Primary Industries, December 2015
Appendix 7 Annual recreational harvest (kept numbers) of key species by water body type during 2013/14, by NSW/ACT residents aged five years and older.
SE is standard error; values in bold indicate relative standard error > 40%; values in italics indicate fewer than 30 households recorded catches
of the species.
Offshore
Inshore
Estuary
River
Lake/dam
Species/group
Number
SE
Number
SE
Number
SE
Number
SE
Number
SE
Bream
117,164
23,168
497,270
102,394
Flathead, Dusky
162
163
9,528
5,990
468,978
63,571
2,496
1,732
Flathead, Sand
55,338
25,210
323,710
77,228
61,715
22,588
Flathead, Tiger
5,125
4,239
33,365
13,956
926
926
Leatherjacket
6,718
4,212
36,562
13,995
27,989
10,261
Luderick
84,912
40,157
165,162
93,764
Mulloway
864
592
6,316
2,230
14,181
3,885
Red Rock Cod
331
214
4,373
2,829
1,726
1,020
Salmon, Australian
1,666
1,651
47,110
13,766
24,759
9,585
Sharks and rays
582
340
2,931
1,171
1,769
644
Silver Trevally
1,041
847
25,005
7,569
23,036
15,695
Snapper
30,674
9,289
115,372
20,605
39,544
17,370
Swallowtail Dart
42,793
18,866
481
478
Tailor
540
388
136,141
37,223
52,933
16,377
Tunas
11,066
5,651
31,271
19,833
3,996
2,436
Whiting, Sand
66,606
14,825
180,864
51,919
Whiting, School
405
403
4,590
2,038
Whiting, Trumpeter
123,580
100,107
Wrasse/gropers
4,008
2,263
13,615
6,205
1,680
980
Yellowtail Kingfish
10,467
5,362
22,621
12,032
2,046
1,132
Blue Mackerel
12,727
4,651
75,441
24,439
36,961
26,547
Mullet
7,317
3,411
47,081
13,681
17,327
16,402
Yellowtail Scad
1,671
1,201
50,600
20,494
37,911
24,611
Other small baitfish
4,322
3,600
309,229
150,006

West et al. NSW/ACT Recreational Fishing Survey – 2013/14
118 NSW Department of Primary Industries, December 2015
Appendix 7, continued
Offshore
Inshore
Estuary
River
Lake/dam
Species/group
Number
SE
Number
SE
Number
SE
Number
SE
Number
SE
Australian Bass
803
573
3,910
1,469
6,592
3,322
European Carp
436,665
80,667
62,070
16,905
Golden Perch
43,442
8,353
33,087
6,476
Murray Cod
18,882
4,317
1,935
771
Redfin Perch
2,335
1,172
42,091
14,594
Trout
7,094
2,604
100,725
32,327
Scalefish, other
38,774
8,769
170,362
34,280
67,464
15,708
40,592
32,522
3,677
2,256
Blue Swimmer Crab
249
248
50,387
14,218
Mud Crab
30,052
8,865
Rock lobster
18,508
11,128
4,708
3,125
Prawns (saltwater)
724,756
426,343
Shrimp (freshwater)
301,047
100,783
28,978
23,117
Nippers (saltwater)
1,319,066
367,909
Yabbies (freshwater)
78,907
58,232
160,932
56,758
Crustaceans, other
6,448
6,178
2,255
2,242
346
217
Squids
21,918
7,858
83,390
50,444
Cephalopods, other
525
369
12,611
9,864
Abalone
17,040
10,525
1,383
1,377
Pipis
85,958
31,221
1,802
1,789
Worms
199,307
69,587
62,870
40,673
Other taxa
1,013
1,002

West et al. NSW/ACT Recreational Fishing Survey – 2013/14
119 NSW Department of Primary Industries, December 2015
Appendix 8 Annual recreational effort (numbers of fishers and fisher days) and catch (kept and released numbers) of key species by fishing method during
2013/14, by NSW/ACT residents aged five years and older. SE is standard error; values in bold indicate relative standard error > 40%; values in
italics indicate fewer than 30 households recorded catches of the species.
Line
Pot/trap
Net
Dive
Other
Species/group
Number
SE
Number
SE
Number
SE
Number
SE
Number
SE
Effort
Fishers
729,396
31,372
33,610
5,256
14,569
3,609
11,037
2,675
33,979
5,233
Fisher days
3,083,157
161,261
69,263
11,926
19,703
4,785
40,767
19,132
85,533
16,203
Catch
Bream
2,202,206
299,596
189
189
3,261
1,905
Flathead, Dusky
1,057,388
132,763
402
289
566
567
256
255
Flathead, Sand
960,013
181,351
1,416
1,418
1,464
1,066
Flathead, Tiger
82,330
31,558
Leatherjacket
98,497
19,718
18,125
16,551
Luderick
418,273
186,442
9,940
5,904
Mulloway
111,573
35,512
Red Rock Cod
151,531
34,435
Salmon, Australian
144,517
27,030
189
189
Sharks and rays
108,912
19,326
25
25
Silver Trevally
87,407
23,508
94
95
Snapper
754,795
144,326
555
550
Swallowtail Dart
118,935
39,889
Tailor
362,891
59,901
256
255
Tunas
57,047
28,585
Whiting, Sand
568,707
111,478
120
118
Whiting, School
11,807
4,278
Whiting, Trumpeter
152,986
104,916
Wrasse/gropers
111,217
34,110
582
410
Yellowtail Kingfish
95,924
29,790
191
189
Blue Mackerel
137,119
37,988
Mullet
81,206
24,843
17,652
9,477
Yellowtail Scad
143,230
41,272
Other small baitfish
318,010
150,408

West et al. NSW/ACT Recreational Fishing Survey – 2013/14
120 NSW Department of Primary Industries, December 2015
Appendix 8, continued
Line
Pot/trap
Net
Dive
Other
Species/group
Number
SE
Number
SE
Number
SE
Number
SE
Number
SE
Australian Bass
195,802
62,660
European Carp
498,043
84,933
495
486
1,181
1,169
444
429
Golden Perch
142,483
18,752
118
117
Murray Cod
165,498
29,865
59
58
Redfin Perch
136,279
52,588
Trout
157,975
38,760
Scalefish, other
845,938
100,254
26,577
19,509
Blue Swimmer Crab
18,638
5,932
50,402
19,989
4,461
2,495
Mud Crab
1,394
576
46,217
13,979
1,022
1,017
Rock lobster
26,507
14,273
Prawns (saltwater)
728,843
426,343
Shrimp (freshwater)
400,040
148,147
9,672
5,651
Nippers (saltwater)
1,415,852
403,605
Yabbies (freshwater)
8,444
6,300
178,131
71,224
87,636
50,272
897
889
Crustaceans, other
109
108
1,058
747
276
270
8,427
6,567
Squids
106,331
53,227
5,469
4,237
Cephalopods, other
24,447
14,172
117
116
Abalone
18,566
11,616
278
275
Pipis
90,452
31,719
Worms
262,178
94,992
Other taxa
62
61
1,013
1,002

West et al. NSW/ACT Recreational Fishing Survey – 2013/14
121 NSW Department of Primary Industries, December 2015
Appendix 9 Annual recreational harvest (kept numbers) of key species by fishing method during 2013/14, by NSW/ACT residents aged five years and older.
SE is standard error; values in bold indicate relative standard error > 40%; values in italics indicate fewer than 30 households recorded catches
of the species.
Line
Pot/trap
Net
Dive
Other
Species/group
Number
SE
Number
SE
Number
SE
Number
SE
Number
SE
Bream
611,079
107,521
94
95
3,261
1,905
Flathead, Dusky
480,411
63,861
402
289
94
95
256
255
Flathead, Sand
439,111
98,733
189
189
1,464
1,066
Flathead, Tiger
39,417
14,738
Leatherjacket
53,144
13,135
18,125
16,551
Luderick
240,134
101,807
9,940
5,904
Mulloway
21,361
4,481
Red Rock Cod
6,430
3,022
Salmon, Australian
73,441
17,779
94
95
Sharks and rays
5,282
1,464
Silver Trevally
49,081
17,410
Snapper
185,034
29,728
555
550
Swallowtail Dart
43,275
18,872
Tailor
189,358
40,826
256
255
Tunas
46,333
24,191
Whiting, Sand
247,350
56,795
120
118
Whiting, School
4,995
2,078
Whiting, Trumpeter
123,580
100,107
Wrasse/gropers
18,721
6,662
582
410
Yellowtail Kingfish
34,943
13,719
191
189
Blue Mackerel
125,129
37,285
Mullet
57,302
20,144
14,423
8,620
Yellowtail Scad
90,182
33,361
Other small baitfish
313,551
150,072

West et al. NSW/ACT Recreational Fishing Survey – 2013/14
122 NSW Department of Primary Industries, December 2015
Appendix 9, continued.
Line
Pot/trap
Net
Dive
Other
Species/group
Number
SE
Number
SE
Number
SE
Number
SE
Number
SE
Australian Bass
11,305
3,690
European Carp
496,615
84,902
495
486
1,181
1,169
444
429
Golden Perch
76,410
11,117
118
117
Murray Cod
20,757
4,383
59
58
Redfin Perch
44,426
14,649
Trout
107,819
32,450
Scalefish, other
294,291
48,401
26,577
19,509
Blue Swimmer Crab
11,356
4,259
35,915
13,432
3,366
2,255
Mud Crab
857
433
29,195
8,774
Rock lobster
23,216
12,501
Prawns (saltwater)
724,756
426,343
Shrimp (freshwater)
320,353
108,056
9,672
5,651
Nippers (saltwater)
1,319,066
367,909
Yabbies (freshwater)
8,251
6,297
150,754
66,808
79,936
49,225
897
889
Crustaceans, other
109
108
237
188
276
270
8,427
6,567
Squids
99,839
51,476
5,469
4,237
Cephalopods, other
13,019
9,870
117
116
Abalone
18,145
11,599
278
275
Pipis
87,760
31,272
Worms
262,178
94,992
Other taxa
1,013
1,002

West et al. NSW/ACT Recreational Fishing Survey – 2013/14
123 NSW Department of Primary Industries, December 2015
Appendix 10 Annual recreational effort (numbers of fishers and fisher days) and catch (kept and
released numbers) of key species in NSW/ACT waters by fishing platform during 2013/14,
by residents aged five years and older. SE is standard error; values in bold indicate
relative standard error > 40%; values in italics indicate fewer than 30 households recorded
catches of the species.
Boat
Shore
Both
%
Species/group
Number
SE
Number
SE
Number
SE
Shore
Effort
Fishers
390,607
23,715
550,589
26,544
n/a
n/a
n/a
Fisher days
1,365,838
100,202
1,862,738
116,019
n/a
n/a
n/a
Catch
Bream
936,858
141,269
1,266,434
245,069
2,363
1,499
57.5
Flathead, Dusky
864,620
125,743
193,116
35,971
877
685
18.3
Flathead, Sand
865,775
179,864
97,117
16,412
10.1
Flathead, Tiger
82,330
31,558
0.0
Leatherjacket
72,994
16,201
43,628
20,022
37.4
Luderick
189,685
132,239
238,528
69,431
55.7
Mulloway
80,790
34,594
30,782
7,841
27.6
Red Rock Cod
133,235
33,816
18,296
5,984
12.1
Salmon, Australian
37,020
13,316
107,686
22,254
74.4
Sharks and rays
65,238
16,713
43,699
9,024
40.1
Silver Trevally
60,069
22,300
27,432
7,258
31.3
Snapper
600,898
129,578
154,345
62,710
108
108
20.4
Swallowtail Dart
2,697
1,730
116,238
39,636
97.7
Tailor
159,037
41,430
202,305
40,024
1,806
1,724
56.0
Tunas
29,762
9,285
27,285
22,846
47.8
Whiting, Sand
266,240
86,178
302,395
58,891
192
185
53.2
Whiting, School
7,647
3,508
3,866
2,442
294
293
33.6
Whiting, Trumpeter
149,356
104,862
3,630
3,365
2.4
Wrasse/gropers
73,324
22,912
38,476
16,342
34.4
Yellowtail Kingfish
87,868
28,437
8,247
5,093
8.6
Blue Mackerel
126,606
37,587
10,513
5,470
7.7
Mullet
24,718
12,900
74,140
22,635
75.0
Yellowtail Scad
115,238
39,390
27,992
12,356
19.5
Other small baitfish
84,881
47,696
233,130
138,828
73.3
Australian Bass
163,173
59,749
31,955
13,073
674
675
16.4
European Carp
103,567
23,912
394,026
79,355
2,571
1,410
79.2
Golden Perch
79,390
13,701
61,980
11,162
1,231
859
43.8
Murray Cod
92,435
21,205
71,065
16,726
2,057
1,325
43.5
Redfin Perch
108,842
51,691
26,650
8,732
786
775
19.7
Trout
89,902
33,836
66,395
17,050
1,678
1,439
42.5
Scalefish, other
531,477
65,342
340,010
76,029
1,028
613
39.0

West et al. NSW/ACT Recreational Fishing Survey – 2013/14
124 NSW Department of Primary Industries, December 2015
Appendix 10, continued
Boat
Shore
Both
%
Species/group
Number
SE
Number
SE
Number
SE
Shore
Blue Swimmer Crab
37,210
14,523
36,291
14,750
49.4
Mud Crab
20,308
8,653
28,325
10,712
58.2
Rock lobster
2,846
1,667
23,661
12,778
89.3
Prawns (saltwater)
356,186
323,746
372,657
191,261
51.1
Shrimp (freshwater)
113,617
70,639
296,095
108,889
72.3
Nippers (saltwater)
24,993
15,475
1,390,859
402,861
98.2
Yabbies (freshwater)
667
482
274,442
92,991
99.8
Crustaceans, other
3,313
2,363
6,448
6,178
109
108
66.1
Squids
93,986
52,451
17,814
7,480
15.9
Cephalopods, other
21,141
14,113
3,423
1,306
13.9
Abalone
6,851
4,177
11,992
7,824
63.6
Pipis
90,452
31,719
100.0
Worms
262,178
94,992
100.0
Other taxa
62
61
1,013
1,002
94.3

West et al. NSW/ACT Recreational Fishing Survey – 2013/14
125 NSW Department of Primary Industries, December 2015
Appendix 11 Annual recreational harvest (kept numbers) of key species by fishing platform during
2013/14, by NSW/ACT residents aged five years and older. SE is standard error; values
in bold indicate relative standard error > 40%; values in italics indicate fewer than 30
households recorded catches of the species.
Boat
Shore
Both
%
Species/group
Number
SE
Number
SE
Number
SE
Shore
Bream
327,621
88,151
286,813
45,903
46.7
Flathead, Dusky
395,582
61,812
85,583
13,954
17.8
Flathead, Sand
398,036
97,538
42,727
9,032
9.7
Flathead, Tiger
39,417
14,738
0.0
Leatherjacket
40,289
10,525
30,980
18,320
43.5
Luderick
116,483
77,396
133,591
44,543
53.4
Mulloway
9,615
2,673
11,746
3,534
55.0
Red Rock Cod
4,900
2,909
1,530
818
23.8
Salmon, Australian
22,759
10,500
50,776
14,210
69.1
Sharks and rays
3,058
1,007
2,224
941
42.1
Silver Trevally
35,955
16,935
13,126
4,079
26.7
Snapper
179,438
29,802
6,043
3,113
108
108
3.3
Swallowtail Dart
852
866
42,422
18,657
98.0
Tailor
74,365
26,327
115,249
29,637
60.8
Tunas
22,813
6,785
23,520
19,696
50.8
Whiting, Sand
103,972
35,833
143,497
40,693
58.0
Whiting, School
3,381
1,802
1,614
1,034
32.3
Whiting, Trumpeter
122,236
100,098
1,344
1,342
1.1
Wrasse/gropers
10,774
2,967
8,529
5,981
44.2
Yellowtail Kingfish
34,579
13,716
555
318
1.6
Blue Mackerel
117,337
37,072
7,792
3,969
6.2
Mullet
13,726
5,785
57,999
20,852
80.9
Yellowtail Scad
84,301
33,248
5,881
2,777
6.5
Other small baitfish
81,663
47,060
231,888
138,824
74.0
Australian Bass
8,282
3,467
3,023
1,240
26.7
European Carp
103,567
23,912
392,597
79,321
2,571
1,410
79.1
Golden Perch
41,415
8,081
34,089
6,862
1,025
730
45.1
Murray Cod
10,141
2,516
10,458
2,964
217
215
50.8
Redfin Perch
30,594
12,942
13,832
6,742
31.1
Trout
70,276
28,386
36,835
14,418
708
708
34.4
Scalefish, other
190,236
28,225
130,306
42,910
326
325
40.7
Blue Swimmer Crab
29,064
10,103
21,573
9,617
42.6
Mud Crab
11,760
4,659
18,292
7,068
60.9
Rock lobster
2,846
1,667
20,370
10,970
87.7
Prawns (saltwater)
356,186
323,746
368,570
191,243
50.9
Shrimp (freshwater)
80,137
58,244
249,888
88,160
75.7
Nippers (saltwater)
23,164
14,035
1,295,902
367,250
98.2
Yabbies (freshwater)
667
482
239,172
89,047
99.7
Crustaceans, other
2,492
2,250
6,448
6,178
109
108
72.1
Squids
88,597
50,680
16,711
7,431
15.9
Cephalopods, other
12,712
9,866
424
321
3.2
Abalone
6,851
4,177
11,571
7,798
62.8
Pipis
87,760
31,272
100.0
Worms
262,178
94,992
100.0
Other taxa
1,013
1,002
100.0

West et al. NSW/ACT Recreational Fishing Survey – 2013/14
126 NSW Department of Primary Industries, December 2015
Appendix 12 Annual recreational effort (numbers of fishers and fisher days) and catch (kept and
released numbers) of key species by season during 2013/14, by NSW/ACT residents
aged five years and older. SE is standard error; values in bold indicate relative standard
error > 40%; values in italics indicate fewer than 30 households recorded catches of the
species.
Winter (Jun-Aug)
Spring (Sep-Nov)
Summer (Dec-Feb)
Autumn (Mar-May)
Species/group
Number
SE
Number
SE
Number
SE
Number
SE
Effort
Fishers
239,037
15,440
327,757
20,006
407,411
22,390
312,535
20,813
Fisher days
603,908
44,496
729,641
52,882
1,049,339
68,240
798,148
59,119
Catch
Bream
471,108
74,585
366,909
64,615
735,284
121,017
632,355
148,935
Flathead, Dusky
168,224
37,261
244,886
42,962
362,627
57,957
282,876
57,505
Flathead, Sand
136,829
31,668
187,409
49,301
483,845
144,402
154,810
31,407
Flathead, Tiger
9,103
4,457
24,763
12,480
40,515
27,658
7,948
4,445
Leatherjacket
24,405
7,586
30,022
12,916
24,904
11,215
37,291
12,833
Luderick
198,106
104,398
63,828
24,964
77,338
28,520
88,941
56,014
Mulloway
18,450
5,962
10,934
4,332
48,256
29,523
33,933
17,136
Red Rock Cod
46,739
10,997
19,752
5,309
41,698
10,693
43,342
27,038
Salmon, Australian
46,234
12,559
50,836
15,180
22,140
6,283
25,495
6,956
Sharks and rays
12,606
3,257
25,945
10,575
47,273
12,869
23,113
6,539
Silver Trevally
30,005
11,492
26,822
13,107
14,316
4,288
16,357
4,324
Snapper
129,763
28,051
98,340
19,010
336,387
110,039
190,860
52,311
Swallowtail Dart
58,722
22,525
14,043
6,828
16,636
6,731
29,535
14,714
Tailor
134,854
34,205
38,219
9,439
60,531
14,725
129,544
25,457
Tunas
10,473
6,805
32,006
27,567
5,719
2,033
8,848
3,088
Whiting, Sand
46,228
10,405
66,079
17,471
296,100
76,649
160,419
37,137
Whiting, School
4,343
3,182
3,107
1,417
4,069
2,443
287
283
Whiting, Trumpeter
26,197
20,674
11,358
6,499
61,020
39,391
54,411
45,251
Wrasse/gropers
36,562
10,262
30,573
15,313
18,187
8,744
26,477
14,521
Yellowtail Kingfish
6,454
3,409
5,400
3,511
31,810
10,873
52,452
20,762
Blue Mackerel
15,951
8,301
19,274
8,034
58,315
23,871
43,580
19,051
Mullet
28,977
18,441
18,296
6,783
29,529
12,629
22,056
8,887
Yellowtail Scad
34,492
17,312
23,548
11,596
59,365
25,360
25,824
11,005
Other small baitfish
24,806
14,275
127,709
65,792
77,127
43,335
88,367
55,155
Australian Bass
6,658
5,496
92,567
34,606
52,932
24,515
43,645
25,482
European Carp
97,921
29,126
140,683
47,108
145,714
35,263
115,846
22,731
Golden Perch
17,184
4,482
56,819
10,398
29,306
5,995
39,291
7,695
Murray Cod
16,203
5,098
20,080
5,453
79,296
18,358
49,977
12,497
Redfin Perch
7,450
3,865
25,500
10,594
86,497
42,760
16,832
9,389
Trout
40,481
13,156
39,541
11,550
40,468
15,053
37,485
13,595
Scalefish, other
183,663
31,146
156,410
32,830
300,913
46,884
231,529
45,164

West et al. NSW/ACT Recreational Fishing Survey – 2013/14
127 NSW Department of Primary Industries, December 2015
Appendix 12, continued
Winter (Jun-Aug)
Spring (Sep-Nov)
Summer (Dec-Feb)
Autumn (Mar-May)
Species/group
Number
SE
Number
SE
Number
SE
Number
SE
Blue Swimmer Crab
816
610
4,322
2,187
39,951
12,634
28,411
10,811
Mud Crab
2,863
2,338
6,832
2,627
21,133
8,668
17,805
7,474
Rock lobster
2,469
1,528
8,438
5,114
7,286
5,678
8,314
4,596
Prawns (saltwater)
111,999
74,655
599,459
364,501
17,386
17,088
Shrimp (freshwater)
4,211
4,186
46,901
17,789
173,693
103,172
184,906
81,238
Nippers (saltwater)
232,692
84,809
238,783
77,716
612,080
240,574
332,297
129,930
Yabbies (freshwater)
100,531
62,884
29,364
16,694
103,582
35,961
41,632
22,056
Crustaceans, other
7,231
6,217
276
270
2,363
2,245
Squids
30,717
18,439
11,365
4,464
21,853
10,351
47,865
36,269
Cephalopods, other
2,034
983
150
121
7,729
3,191
14,651
13,780
Abalone
6,583
3,582
2,074
2,066
4,644
3,059
5,542
3,894
Pipis
36,763
25,902
16,413
8,349
20,338
13,192
16,939
10,000
Worms
77,938
32,101
47,530
20,737
106,954
60,497
29,756
15,967
Other taxa
1,013
1,002
62
61

West et al. NSW/ACT Recreational Fishing Survey – 2013/14
128 NSW Department of Primary Industries, December 2015
Appendix 13 Annual recreational effort (numbers of fishers and fisher days) and catch (kept and released numbers) of key species by fishing zone during
2013/14, by NSW/ACT residents aged five years and older. SE is standard error; values in bold indicate relative standard error > 40%; values in
italics indicate fewer than 30 households recorded catches of the species.
North
Coast
Mid North
Coast
Hunter
Sydney
Mid South
Coast
South
Coast
Murray/
Sth. West
Darling/
Nth. West
ACT
Effort
Fishers
No:
79,053
113,132
149,738
210,665
179,233
42,210
102,097
57,877
3,631
SE
8,882
9,990
16,549
21,875
15,184
4,815
7,964
6,888
1,147
Fisher days
No:
328,121
447,559
474,688
595,144
690,396
128,945
320,381
191,166
5,698
SE
45,493
57,745
66,177
78,485
66,943
20,944
29,918
25,718
2,110
Catch
Bream
No:
271,270
433,534
308,943
578,216
564,645
49,047
SE
53,664
109,997
59,470
165,427
147,579
13,755
Flathead, Dusky
No:
121,129
165,536
152,000
138,935
328,184
152,828
SE
35,152
51,204
72,114
31,929
69,245
47,679
Flathead, Sand
No:
26,950
131,137
132,901
225,062
377,984
68,858
SE
6,048
46,990
49,739
127,890
91,291
19,962
Flathead, Tiger
No:
3,244
1,245
6,246
7,926
56,662
7,007
SE
2,685
1,209
4,514
7,902
29,656
4,658
Leatherjacket
No:
372
10,351
16,336
49,943
35,293
4,326
SE
362
5,115
9,876
21,341
10,962
1,974
Luderick
No:
15,789
19,553
16,671
64,664
307,038
4,498
SE
11,980
7,609
7,882
40,148
181,309
3,363
Mulloway
No:
25,398
13,994
804
67,313
4,063
SE
7,676
5,145
450
34,124
2,853
Red Rock Cod
No:
47,534
37,531
14,610
6,255
43,001
2,601
SE
27,380
10,604
6,998
3,057
15,343
1,785
Salmon, Australian
No:
721
4,072
29,599
21,449
68,448
20,417
SE
548
2,304
12,361
10,943
16,716
8,165
Sharks and rays
No:
16,721
23,808
27,628
22,833
13,628
4,320
SE
5,601
8,853
10,983
11,296
2,731
2,004

West et al. NSW/ACT Recreational Fishing Survey – 2013/14
129 NSW Department of Primary Industries, December 2015
Appendix 13, continued
North
Coast
Mid North
Coast
Hunter
Sydney
Mid South
Coast
South
Coast
Murray/
Sth. West
Darling/
Nth. West
ACT
Silver Trevally
No:
4,531
4,313
11,779
37,707
24,737
4,434
SE
2,978
2,670
3,813
20,811
8,145
2,331
Snapper
No:
80,485
53,042
163,737
260,929
167,607
29,550
SE
24,593
23,560
45,902
105,905
44,010
11,030
Swallowtail Dart
No:
89,483
23,407
4,840
1,205
SE
38,139
11,302
2,909
1,105
Tailor
No:
47,324
110,931
57,093
65,319
52,494
29,987
SE
16,521
38,963
17,034
26,528
12,987
19,068
Tunas
No:
4,256
5,945
4,478
2,391
39,025
954
SE
1,961
2,634
2,559
1,726
28,206
643
Whiting, Sand
No:
98,100
72,859
158,209
31,121
179,306
29,231
SE
34,309
21,490
86,243
8,766
51,033
10,920
Whiting, School
No:
5,068
1,344
3,004
294
1,935
163
SE
3,278
844
2,282
293
1,236
163
Whiting, Trumpeter
No:
851
6,707
137,905
7,522
SE
864
4,564
104,688
5,331
Wrasse/gropers
No:
2,460
21,527
26,233
16,151
43,798
1,631
SE
1,190
8,666
20,752
11,444
15,735
853
Yellowtail Kingfish
No:
1,455
12,185
6,331
4,335
68,246
3,562
SE
980
11,347
3,100
3,043
27,042
1,776
Blue Mackerel
No:
15,615
35,936
14,787
4,047
53,199
13,535
SE
7,335
19,646
8,111
2,957
29,798
6,541
Mullet
No:
8,038
23,949
8,103
20,759
36,135
1,875
SE
3,728
11,454
4,709
16,710
16,116
1,125
Yellowtail Scad
No:
22,224
6,273
16,872
57,310
33,012
7,538
SE
15,753
3,658
6,931
29,715
21,629
6,540
Other small baitfish
No:
235,610
69,187
11,475
1,739
SE
142,375
48,552
10,031
1,110

West et al. NSW/ACT Recreational Fishing Survey – 2013/14
130 NSW Department of Primary Industries, December 2015
Appendix 13, continued
North
Coast
Mid North
Coast
Hunter
Sydney
Mid South
Coast
South
Coast
Murray/
Sth. West
Darling/
Nth. West
ACT
Australian Bass
No:
21,997
5,606
144,883
16,497
6,434
385
SE
11,197
2,944
60,292
11,481
3,395
378
European Carp
No:
902
2,826
946
260,160
231,577
3,752
SE
687
2,286
934
65,074
53,076
2,103
Golden Perch
No:
7,861
58,682
73,247
2,810
SE
3,887
11,909
12,679
1,857
Murray Cod
No:
107,743
55,388
2,426
SE
26,109
13,530
2,114
Redfin Perch
No:
2,242
751
59,627
68,851
4,807
SE
1,579
541
32,394
39,591
2,642
Trout
No:
24,781
131,159
2,035
SE
14,736
35,530
1,166
Scalefish, other
No:
106,478
109,055
163,262
210,567
166,821
13,593
63,712
39,026
SE
20,221
25,359
40,219
68,999
35,199
5,584
33,625
16,842

West et al. NSW/ACT Recreational Fishing Survey – 2013/14
131 NSW Department of Primary Industries, December 2015
Appendix 13, continued
North
Coast
Mid North
Coast
Hunter
Sydney
Mid South
Coast
South
Coast
Murray/
Sth. West
Darling/
Nth. West
ACT
Blue Swimmer Crab
No:
11,828
5,510
38,912
2,902
13,745
603
SE
11,589
2,698
16,241
1,712
5,522
428
Mud Crab
No:
20,893
16,818
6,559
4,364
SE
9,672
8,539
4,722
3,066
Rock lobster
No:
555
383
11,788
13,781
SE
550
378
9,851
9,795
Prawns (saltwater)
No:
71,586
194,275
454,336
8,646
SE
68,380
165,096
386,990
8,608
Shrimp (freshwater)
No:
3,289
27,152
215,468
163,802
SE
3,149
23,079
119,929
68,556
Nippers (saltwater)
No:
445,228
386,488
285,047
122,004
141,064
36,022
SE
262,609
206,374
198,301
85,792
62,987
26,287
Yabbies (freshwater)
No:
45,894
24,752
66,996
137,467
SE
45,382
24,360
26,205
72,827
Crustaceans, other
No:
2,530
6,173
1,167
SE
2,258
6,172
755
Squids
No:
431
53,847
32,994
24,397
130
SE
422
47,387
22,496
9,980
131
Cephalopods, other
No:
201
2,274
14,662
5,680
1,747
SE
197
1,183
13,787
3,018
675
Abalone
No:
2,765
7,605
8,473
SE
2,754
7,575
5,570
Pipis
No:
20,524
52,726
8,340
8,862
SE
9,535
28,595
6,817
7,154
Worms
No:
111,543
22,940
118,925
8,770
SE
55,770
13,298
72,410
4,652
Other taxa
No:
1,013
62
SE
1,002
61

West et al. NSW/ACT Recreational Fishing Survey – 2013/14
132 NSW Department of Primary Industries, December 2015
Appendix 14 Annual recreational harvest (kept numbers) of key species by fishing zone during 2013/14, by NSW/ACT residents aged five years and older.
SE is standard error; values in bold indicate relative standard error > 40%; values in italics indicate fewer than 30 households recorded catches
of the species.
Species/group
North
Coast
Mid North
Coast
Hunter
Sydney
Mid South
Coast
South
Coast
Murray/
Sth. West
Darling/
Nth. West
ACT
Bream
No:
60,683
112,175
99,442
119,467
202,985
19,681
SE
14,818
33,593
30,567
39,037
81,480
7,404
Flathead, Dusky
No:
40,534
66,984
67,811
74,090
160,170
71,575
SE
12,245
18,867
27,204
19,012
36,696
30,394
Flathead, Sand
No:
11,687
49,128
57,149
110,169
180,871
31,759
SE
3,259
18,552
23,162
68,477
46,976
9,549
Flathead, Tiger
No:
1,344
1,245
812
7,926
25,735
2,355
SE
948
1,209
815
7,902
12,223
1,379
Leatherjacket
No:
7,858
12,390
35,995
13,919
1,107
SE
4,094
7,561
18,522
4,981
730
Luderick
No:
14,873
10,246
10,746
56,143
154,777
3,288
SE
11,772
5,629
7,101
38,540
93,215
2,180
Mulloway
No:
10,858
5,389
295
3,117
1,702
SE
3,519
1,790
256
1,752
1,026
Red Rock Cod
No:
68
451
1,414
1,578
2,382
537
SE
67
415
1,378
1,391
1,074
419
Salmon, Aust.
No:
721
2,732
13,115
18,489
28,915
9,563
SE
548
1,589
8,646
9,979
6,660
4,124
Sharks and rays
No:
782
1,822
803
607
1,088
179
SE
451
1,035
486
604
489
178
Silver Trevally
No:
3,266
3,187
6,516
22,285
13,703
125
SE
2,082
2,236
2,476
15,522
5,679
124
Snapper
No:
41,827
20,511
27,510
7,028
80,674
8,041
SE
11,744
9,310
8,359
3,497
24,027
3,367
Swallowtail Dart
No:
41,307
1,873
94
SE
18,809
1,605
95
Tailor
No:
29,462
87,571
16,411
20,964
22,600
12,606
SE
12,718
33,972
6,891
13,431
6,469
7,367

West et al. NSW/ACT Recreational Fishing Survey – 2013/14
133 NSW Department of Primary Industries, December 2015
Appendix 14, continued
Species/group
North
Coast
Mid North
Coast
Hunter
Sydney
Mid South
Coast
South
Coast
Murray/
Sth. West
Darling/
Nth. West
ACT
Tunas
No:
3,161
4,659
4,188
1,450
31,922
954
SE
1,694
2,201
2,511
1,064
23,876
643
Whiting, Sand
No:
26,674
28,393
61,995
8,538
107,054
14,814
SE
9,728
8,780
30,299
3,202
41,790
7,336
Whiting, School
No:
1,888
1,117
1,527
299
163
SE
1,647
813
931
222
163
Whiting, Trumpeter
No:
511
3,415
118,310
1,344
SE
519
3,228
100,053
1,342
Wrasse/gropers
No:
1,277
1,646
368
5,960
8,915
1,138
SE
805
768
339
5,874
2,879
687
Yellowtail Kingfish
No:
427
11,745
1,763
189
19,084
1,927
SE
236
11,348
1,345
188
7,365
1,033
Blue Mackerel
No:
14,053
34,062
14,026
3,721
47,691
11,575
SE
6,715
19,423
8,089
2,940
29,436
5,368
Mullet
No:
7,675
19,788
4,276
17,371
20,842
1,772
SE
3,720
10,658
2,937
16,395
8,605
1,120
Yellowtail Scad
No:
7,975
5,979
5,115
45,127
24,092
1,894
SE
4,518
3,646
3,175
28,071
16,637
1,855
Other small baitfish
No:
232,122
69,187
11,475
768
SE
142,030
48,552
10,031
546
Australian Bass
No:
2,186
1,202
5,967
336
1,228
385
SE
996
1,040
3,283
337
724
378
European Carp
No:
902
2,826
946
259,715
230,594
3,752
SE
687
2,286
934
65,074
53,067
2,103
Golden Perch
No:
1,132
32,099
42,437
860
SE
754
7,322
8,026
842
Murray Cod
No:
11,528
9,288
SE
2,578
3,376
Redfin Perch
No:
1,498
751
20,734
20,634
809
SE
1,086
541
9,858
10,756
498
Trout
No:
17,163
90,657
SE
13,248
29,460

West et al. NSW/ACT Recreational Fishing Survey – 2013/14
134 NSW Department of Primary Industries, December 2015
Appendix 14, continued
Species/group
North
Coast
Mid North
Coast
Hunter
Sydney
Mid South
Coast
South
Coast
Murray/
Sth. West
Darling/
Nth. West
ACT
Scalefish, other
No:
39,547
48,986
57,418
74,012
54,039
4,656
37,357
4,853
SE
10,110
15,064
18,662
28,038
11,576
1,631
32,435
2,961
Blue Swimmer Crab
No:
5,998
3,381
30,341
2,187
8,128
603
SE
5,796
2,187
12,183
1,556
3,604
428
Mud Crab
No:
10,648
10,718
5,024
3,662
SE
4,805
5,829
3,944
2,446
Rock lobster
No:
555
383
11,788
10,490
SE
550
378
9,851
7,178
Prawns (saltwater)
No:
69,542
194,275
452,293
8,646
SE
68,350
165,096
386,996
8,608
Shrimp (freshwater)
No:
3,289
27,152
148,533
151,052
SE
3,149
23,079
69,547
63,636
Nippers (saltwater)
No:
441,155
316,901
266,034
117,891
141,064
36,022
SE
262,326
143,724
185,315
82,560
62,987
26,287
Yabbies
(freshwater)
No:
45,894
9,076
54,294
130,575
SE
45,382
8,932
23,110
72,465
Crustaceans, other
No:
2,530
6,173
346
SE
2,258
6,172
217
Squids
No:
431
53,466
28,048
23,233
130
SE
422
47,387
18,002
9,909
131
Cephalopods, other
No:
10,397
2,182
557
SE
9,659
1,997
371
Abalone
No:
2,765
7,605
8,052
SE
2,754
7,575
5,534
Pipis
No:
20,524
52,726
5,648
8,862
SE
9,535
28,595
4,281
7,154
Worms
No:
111,543
22,940
118,925
8,770
SE
55,770
13,298
72,410
4,652
Other taxa
No:
1,013
SE
1,002

West et al. NSW/ACT Recreational Fishing Survey – 2013/14
135 NSW Department of Primary Industries, December 2015
Appendix 15 Numbers of NSW/ACT resident households reporting boat ownership as at June 2013, by previous fishing activity in the 12 months prior to June
2013, by residential stratum. SE is standard error.
Residential stratum
Fishers
Non-fishers
Total
Own boat
No boat
Own boat
No boat
Own boat
No boat
Number
SE
Number
SE
Number
SE
Number
SE
Number
SE
Number
SE
Sydney
64,629
6,383
140,142
9,789
81,200
7,894
1,428,017
13,339
145,829
9,961
1,568,159
9,961
Hunter
19,058
2,129
24,157
2,412
17,683
2,132
181,966
3,429
36,741
2,860
206,123
2,860
Illawarra
14,696
1,665
22,044
2,159
7,284
1,313
126,474
2,751
21,980
2,062
148,518
2,062
Richmond/Tweed
7,573
1,021
12,556
1,303
5,178
854
73,042
1,648
12,751
1,281
85,598
1,281
Mid North Coast
17,487
1,861
11,763
1,524
10,913
1,494
103,782
2,473
28,400
2,231
115,545
2,231
Central West/North
12,047
1,496
17,014
1,889
7,493
1,315
118,434
2,495
19,540
1,923
135,448
1,923
North West
4,378
542
5,111
592
4,058
544
33,416
837
8,436
721
38,527
721
South East
10,647
1,210
10,231
1,217
6,009
967
61,721
1,723
16,655
1,466
71,953
1,466
South West
12,441
1,355
12,696
1,410
6,165
1,030
76,673
1,917
18,606
1,617
89,369
1,617
ACT
6,485
1,092
15,622
1,735
5,394
1,089
117,846
2,167
11,879
1,506
133,468
1,506
Total
169,441
7,719
271,335
10,987
151,377
8,761
2,321,372
14,978
320,818
11,381
2,592,707
11,381

West et al. NSW/ACT Recreational Fishing Survey – 2013/14
136 NSW Department of Primary Industries, December 2015
Appendix 16 Boat ownership and numbers of boats owned by NSW/ACT resident households (as at
June 2013), with fishing activity in NSW/ACT waters during 2013/14. SE is standard error;
values in bold indicate relative standard error > 40%; values in italics indicate fewer than
30 households reported boat ownership.
Residential stratum
Fisher households
Boats
Own boat
SE
No boat
SE
Number
SE
Mean
Sydney
72,245
8,957
107,672
10,718
87,573
11,193
1.2
Hunter
16,527
2,304
24,539
2,930
22,490
3,314
1.4
Illawarra
16,433
2,079
19,815
2,340
21,365
2,905
1.3
Richmond/Tweed
9,621
1,346
9,978
1,461
12,398
1,872
1.3
Mid North Coast
17,064
2,075
14,708
1,994
21,405
2,825
1.3
Central West/North
14,912
1,982
14,177
2,065
19,914
2,897
1.3
North West
3,931
616
3,835
623
5,115
874
1.3
South East
10,698
1,384
9,126
1,419
14,223
2,327
1.3
South West
13,913
1,726
11,136
1,605
18,783
2,632
1.4
ACT
5,279
1,163
14,450
1,915
6,851
1,676
1.3
Total
180,622
10,322
229,437
12,164
230,118
13,435
1.3
Appendix 17 Numbers of boats owned and used for fishing in 2013/14 by NSW/ACT resident fisher
households (as at June 2013). SE is standard error; values in bold indicate relative
standard error > 40%; values in italics indicate fewer than 30 households reported boat
ownership.
Residential stratum
Numbers of Boats
% used for fishing
Any fishing use
SE
No fishing
SE
Sydney
62,562
8,898
25,012
6,159
71%
Hunter
16,727
2,724
5,763
1,644
74%
Illawarra
19,574
2,729
1,791
732
92%
Richmond/Tweed
8,232
1,482
4,166
1,103
66%
Mid North Coast
17,395
2,419
4,010
1,310
81%
Central West/North
13,296
2,208
6,618
1,865
67%
North West
3,983
766
1,131
360
78%
South East
12,067
1,955
2,156
680
85%
South West
14,791
2,206
3,992
961
79%
ACT
5,267
1,412
1,585
890
77%
Total
173,895
10,873
56,223
7,063
76%

West et al. NSW/ACT Recreational Fishing Survey – 2013/14
137 NSW Department of Primary Industries, December 2015
Appendix 18 Numbers of boats used for fishing in 2013/14 by NSW/ACT resident fisher households (as at June 2013), by length of boat and stratum. SE is
standard error; values in bold indicate relative standard error > 40%; values in italics indicate fewer than 30 households reported boat ownership.
Residential stratum
< 4 metres
4-4.9 metres
5-5.9 metres
6-6.9 metres
7 metres plus
Number
SE
Number
SE
Number
SE
Number
SE
Number
SE
Sydney
9,740
2,859
25,999
5,502
19,048
4,380
2,667
1,510
5,108
2,573
Hunter
3,689
1,388
6,487
1,535
5,211
1,366
1,143
481
197
197
Illawarra
6,577
1,599
5,662
1,238
6,029
1,364
516
396
791
533
Richmond/Tweed
2,163
780
3,935
939
1,630
535
331
237
174
172
Mid North Coast
5,182
1,423
7,464
1,521
3,707
987
794
471
249
247
Central West/North
5,554
1,453
4,254
1,058
2,425
832
743
440
318
237
North West
2,035
592
1,316
386
376
194
152
108
104
103
South East
3,092
1,055
5,614
1,185
2,290
615
810
450
262
257
South West
4,837
1,165
5,623
1,199
3,061
935
517
382
753
429
ACT
1,771
686
2,508
882
683
361
305
221
Total
44,641
4,549
68,862
6,500
44,459
5,127
7,673
1,871
8,259
2,720

West et al. NSW/ACT Recreational Fishing Survey – 2013/14
138 NSW Department of Primary Industries, December 2015
Appendix 19 Overall satisfaction with recreational fishing in the period June 2013 to May 2014 - as reported by the main/key fisher aged 15 years or more, in
resident households with recreational fishing activity in NSW/ACT waters. SE is standard error; values in bold indicate relative standard error >
40%; values in italics indicate fewer than 30 fishing households responded.
How satisfied …
% at
least
quite
satisfied
Residential stratum
Very
Quite
Not very
Not at all
Unsure
Number
SE
Number
SE
Number
SE
Number
SE
Number
SE
Sydney
25,994
5,508
110,462
10,992
29,240
5,464
6,286
2,866
3,837
1,954
78%
Hunter
5,516
1,552
24,884
2,880
8,564
1,702
638
457
1,066
557
75%
Illawarra
5,686
1,375
20,910
2,374
8,386
1,575
628
445
404
298
74%
Richmond/Tweed
2,053
624
11,666
1,495
4,184
1,022
788
450
512
292
71%
Mid North Coast
3,518
986
17,152
2,162
7,600
1,406
1,264
579
1,636
675
66%
Central West/North
4,412
1,133
18,938
2,299
4,680
1,157
314
306
548
395
81%
North West
1,238
376
4,862
699
885
292
294
151
136
133
82%
South East
3,387
883
11,085
1,522
4,482
942
322
193
401
285
74%
South West
4,629
1,090
14,785
1,807
4,581
1,024
187
186
615
434
78%
ACT
2,653
812
13,346
1,838
3,354
1,008
177
176
82%
Total
59,086
6,328
248,089
12,506
75,955
6,529
10,898
3,062
9,154
2,281
76%

West et al. NSW/ACT Recreational Fishing Survey – 2013/14
139 NSW Department of Primary Industries, December 2015
Appendix 20 Estimated number of persons and proportion of the resident population aged 5 years and older, who fished recreationally in NSW or the ACT in
the 12 months prior to May 2000 and the 12 months prior to June 2013, by residential stratum. SE is standard error.
Residential stratum
Fishers
Non-fishers
Participation Rates
2000
2013
2000
2013
2000
2013
Number
SE
Number
SE
Number
SE
Number
SE
%
SE
%
SE
Sydney
459,104
26,578
375,558
23,716
3,237,541
26,578
3,982,956
23,716
12.4
0.7
8.6
0.5
Hunter
128,360
8,430
86,200
6,858
393,003
8,430
485,426
6,858
24.6
1.6
15.1
1.2
Illawarra
69,207
5,356
72,700
5,661
283,201
5,356
330,461
5,661
19.6
1.5
18.0
1.4
Richmond/Tweed
48,076
3,114
39,196
3,470
144,519
3,114
181,830
3,470
25.0
1.6
17.7
1.6
Mid North Coast
74,889
4,556
55,533
5,026
174,048
4,556
264,416
5,026
30.1
1.8
17.4
1.6
Central West/North
61,674
5,174
56,174
5,207
245,044
5,174
302,557
5,207
20.1
1.7
15.7
1.5
North West
28,774
2,327
19,519
1,806
96,263
2,327
88,532
1,806
23.0
1.9
18.1
1.7
South East
48,919
3,064
41,886
3,850
115,034
3,064
160,178
3,850
29.8
1.9
20.7
1.9
South West
43,199
3,523
49,831
4,009
186,848
3,523
198,508
4,009
18.8
1.5
20.1
1.6
ACT
52,005
3,697
40,034
3,708
226,013
3,697
304,026
3,708
18.7
1.3
11.6
1.1
Total
1,014,207
30,071
836,632
27,456
5,101,514
30,071
6,298,889
27,456
16.6
0.50
11.7
0.4

West et al. NSW/ACT Recreational Fishing Survey – 2013/14
140 NSW Department of Primary Industries, December 2015
Appendix 21 Annual recreational effort (number of fishers and fisher days) by residents aged five years
and older who fished in NSW/ACT waters during 2000/01, compared with 2013/14 – by
fishing zone. SE is standard error; values in bold indicate relative standard error > 40%;
values in italics indicate fewer than 30 fishing households responded.
2000/01
2013/14
Fishing Zone
Fishers
SE
Fisher
days
SE
Fishers
SE
Fisher
days
SE
North Coast
138,712
11,854
684,337
64,419
79,053
8,882
328,121
45,493
Mid North Coast
160,348
14,370
729,071
93,245
113,132
9,990
447,559
57,745
Hunter
240,228
20,533
931,667
102,617
149,738
16,549
474,688
66,177
Sydney
228,995
22,583
712,247
135,567
210,665
21,875
595,144
78,485
Mid South Coast
219,375
19,294
867,959
118,663
179,233
15,184
690,396
66,943
South Coast
67,290
8,797
266,220
41,399
42,210
4,815
128,945
20,944
Murray/South West
115,406
10,546
460,746
50,472
102,097
7,964
320,381
29,918
Darling/North West
972,669
10,228
358,206
39,146
57,877
6,888
191,166
25,718
ACT
14,821
2,550
25,244
5,107
3,631
1,147
5,698
2,110

West et al. NSW/ACT Recreational Fishing Survey – 2013/14
141 NSW Department of Primary Industries, December 2015
Appendix 22 Annual recreational catch (kept and released numbers) of key species by residents aged
five years and older who fished in NSW/ACT waters during 2000/01, compared with
2013/14. SE is standard error; values in bold indicate relative standard error > 40%;
values in italics indicate fewer than 30 households recorded catches of the species.
2000/01
2013/14
%
Species/group
Number
SE
Number
SE
change
Bream
4,274,412
481,383
2,205,656
299,714
51.6
Flathead
3,343,172
372,340
2,103,835
246,280
62.9
Leatherjacket
438,343
88,698
116,622
26,752
26.6
Luderick
912,106
242,478
428,213
186,579
46.9
Mulloway
109,400
23,872
111,573
35,512
102.0
Red Rock Cod
225,254
32,272
151,531
34,435
67.3
Salmon, Australian
166,315
30,509
144,706
27,036
87.0
Sharks
113,422
37,308
37,703
11,452
33.2
Rays
135,998
47,076
71,235
13,877
52.4
Snapper
1,242,083
384,122
755,350
144,387
60.8
Swallowtail Dart
196,259
62,526
118,935
39,889
60.6
Tailor
1,511,131
219,254
363,147
59,901
24.0
Trevally
229,760
48,439
88,034
23,513
38.3
Tuna
108,445
47,962
57,047
28,585
52.6
Whiting
2,259,931
639,150
733,620
154,662
32.5
Wrasse/gropers
213,232
43,307
111,800
34,111
52.4
Yellowtail Kingfish
122,064
26,963
96,115
29,791
78.7
Blue Mackerel
259,359
60,161
137,119
37,988
52.9
Mullet
535,637
119,509
98,859
26,572
18.5
Yellowtail Scad
318,947
89,733
143,230
41,272
44.9
Other small baitfish
235,233
66,875
318,010
150,408
135.2
Australian Bass
102,544
21,429
195,802
62,660
190.9
European Carp
677,724
115,151
500,164
84,945
73.8
Golden Perch
568,743
82,808
142,601
18,752
25.1
Murray Cod
160,680
36,670
165,557
29,865
103.0
Redfin Perch
354,834
141,973
136,279
52,588
38.4
Trout
325,347
56,929
157,975
38,760
48.6
Blue Swimmer Crab
426,880
118,206
73,501
20,944
17.2
Mud Crab
58,642
22,011
48,634
14,075
82.9
Rock lobster
18,162
8,075
26,507
14,273
145.9
Prawns saltwater
9,564,042
5,379,154
728,843
426,343
7.6
Shrimp freshwater
239,577
93,882
409,711
148,424
171.0
Nippers saltwater
2,580,638
492,261
1,415,852
403,605
54.9
Yabbies freshwater
1,170,880
251,740
275,108
92,992
23.5
Squids
139,419
47,038
111,799
53,498
80.2
Cephalopods, other
19,771
5,896
24,564
14,173
124.2
Abalone
85,311
58,262
18,843
11,735
22.1
Pipis
832,677
194,589
90,452
31,719
10.9
Worms
301,381
84,488
262,178
94,992
87.0

West et al. NSW/ACT Recreational Fishing Survey – 2013/14
142 NSW Department of Primary Industries, December 2015
Appendix 23 Annual recreational harvest (kept numbers) of key species by residents aged five years
and older who fished in NSW/ACT waters during 2000/01, compared with 2013/14. SE is
standard error; values in bold indicate relative standard error > 40%; values in italics
indicate fewer than 30 households recorded catches of the species.
2000/01
2013/14
%
Species/group
Number
SE
Number
SE
change
Bream
1,494,515
246,427
614,434
107,686
41.1
Flathead
1,689,523
211,518
961,344
126,411
56.9
Leatherjacket
246,212
61,054
71,269
21,133
28.9
Luderick
609,992
173,546
250,074
102,050
41.0
Mulloway
79,095
16,889
21,361
4,481
27.0
Red Rock Cod
28,238
7,344
6,430
3,022
22.8
Salmon, Australian
80,389
16,901
73,535
17,779
91.5
Sharks
19,212
4,647
3,089
1,160
16.1
Rays
7,943
4,217
2,193
895
27.6
Snapper
253,298
36,796
185,590
29,943
73.3
Swallowtail Dart
76,445
25,715
43,275
18,872
56.6
Tailor
879,011
163,103
189,614
40,826
21.6
Trevally
142,078
34,881
49,454
17,413
34.8
Tuna
94,281
47,496
46,333
24,191
49.1
Whiting
1,385,810
502,701
376,044
115,771
27.1
Wrasse/gropers
93,955
20,122
19,303
6,674
20.5
Yellowtail Kingfish
58,597
13,637
35,134
13,720
60.0
Blue Mackerel
206,313
51,876
125,129
37,285
60.7
Mullet
383,117
98,143
71,725
21,899
18.7
Yellowtail Scad
159,635
41,152
90,182
33,361
56.5
Other small baitfish
191,820
62,095
313,551
150,072
163.5
Australian Bass
13,677
4,378
11,305
3,690
82.7
European Carp
586,553
109,183
498,735
84,914
85.0
Golden Perch
344,881
52,406
76,529
11,117
22.2
Murray Cod
41,169
7,705
20,816
4,383
50.6
Redfin Perch
169,167
68,004
44,426
14,649
26.3
Trout
176,334
39,244
107,819
32,450
61.1
Blue Swimmer Crab
301,995
98,515
50,637
14,220
16.8
Mud Crab
39,964
13,161
30,052
8,865
75.2
Rock lobster
11,972
5,751
23,216
12,501
193.9
Prawns saltwater
9,458,274
5,368,839
724,756
426,343
7.7
Shrimp freshwater
228,353
88,955
330,025
108,398
144.5
Nippers saltwater
2,479,647
478,049
1,319,066
367,909
53.2
Yabbies freshwater
916,091
213,361
239,838
89,047
26.2
Squids
134,649
46,939
105,308
51,757
78.2
Cephalopods, other
10,574
4,886
13,136
9,871
124.2
Abalone
41,087
18,792
18,423
11,718
44.8
Pipis
743,444
170,324
87,760
31,272
11.8
Worms
298,472
84,409
262,178
94,992
87.8

West et al. NSW/ACT Recreational Fishing Survey – 2013/14
143 NSW Department of Primary Industries, December 2015
Appendix 24 Mean line fishing catch rates of key marine finfish species/groups (numbers per fisher day), by residents aged five years and older who fished in
NSW waters during 2000/01, compared with 2013/14 - by water body type. SE is standard error; values in bold indicate relative standard error >
40%; values in italics indicate fewer than 30 households recorded catches of the species.
Species/group
2000/01
2013/14
% change
in total
catch rate
Total catch
(numbers)
Ocean
Estuary
All Saltwater
Total catch
(numbers)
Ocean
Estuary
All Saltwater
Catch
rate
SE
Catch
rate
SE
Catch
rate
SE
Catch
rate
SE
Catch
rate
SE
Catch
rate
SE
Bream
4,237,360
0.87
0.12
1.29
0.12
0.91
0.09
2,195,105
0.35
0.05
1.13
0.13
0.72
0.08
80.0
Flathead
3,339,716
1.08
0.19
0.77
0.08
0.71
0.07
2,095,595
1.30
0.19
0.69
0.08
0.69
0.07
96.9
Leatherjacket
379,545
0.09
0.02
0.11
0.03
0.08
0.02
98,497
0.08
0.02
0.03
0.01
0.03
0.01
40.1
Luderick
881,651
0.23
0.11
0.24
0.05
0.19
0.05
418,273
0.14
0.06
0.19
0.10
0.14
0.06
73.3
Mulloway
102,571
0.04
0.01
0.02
0.01
0.02
0.00
111,359
0.02
0.01
0.06
0.02
0.04
0.01
167.7
Salmon, Australian
165,576
0.10
0.02
0.01
0.00
0.04
0.01
144,517
0.15
0.03
0.02
0.01
0.05
0.01
134.8
Snapper
1,240,551
0.35
0.05
0.32
0.15
0.26
0.08
754,655
0.42
0.06
0.27
0.07
0.25
0.04
93.9
Swallowtail Dart
196,259
0.13
0.04
0.00
0.00
0.04
0.01
118,935
0.16
0.05
0.00
0.00
0.04
0.01
93.6
Tailor
1,480,837
0.52
0.10
0.32
0.05
0.32
0.04
362,557
0.26
0.06
0.10
0.02
0.12
0.02
37.8
Trevally
221,269
0.11
0.03
0.03
0.01
0.05
0.01
87,940
0.07
0.02
0.02
0.01
0.03
0.01
61.4
Tuna
108,368
0.07
0.03
0.00
0.00
0.02
0.01
55,253
0.08
0.04
0.00
0.00
0.02
0.01
78.7
Whiting
2,255,992
0.31
0.05
0.78
0.24
0.48
0.13
725,097
0.16
0.03
0.35
0.08
0.24
0.05
49.6
Yellowtail Kingfish
122,005
0.06
0.01
0.01
0.01
0.03
0.01
95,924
0.11
0.04
0.01
0.01
0.03
0.01
121.4

West et al. NSW/ACT Recreational Fishing Survey – 2013/14
144 NSW Department of Primary Industries, December 2015
Appendix 25 Mean line fishing catch rates of key freshwater finfish species/groups (numbers per fisher day), by residents aged five years and older who
fished in NSW/ACT waters during 2000/01, compared with 2013/14 - by water body type. SE is standard error; values in bold indicate relative
standard error > 40%; values in italics indicate fewer than 30 households recorded catches of the species.
Species/group
2000/01
2013/14
% change
in total
catch rate
Total catch
(numbers)
River
Lake/dam
All
Freshwater
Total catch
(numbers)
River
Lake/dam
All
Freshwater
Catch
rate
SE
Catch
rate
SE
Catch
rate
SE
Catch
rate
SE
Catch
rate
SE
Catch
rate
SE
Australian Bass
90,956
0.13
0.03
0.05
0.02
0.02
0.00
192,181
0.24
0.09
0.39
0.17
0.06
0.02
326.3
Golden Perch
568,744
0.67
0.11
0.51
0.10
0.12
0.02
142,483
0.23
0.04
0.23
0.03
0.05
0.01
38.7
Murray Cod
160,104
0.27
0.06
0.06
0.02
0.03
0.01
165,384
0.43
0.07
0.07
0.02
0.05
0.01
159.5
Redfin Perch
353,849
0.05
0.01
0.71
0.29
0.08
0.03
136,279
0.12
0.11
0.33
0.13
0.04
0.02
59.5
Trout
325,045
0.31
0.07
0.37
0.08
0.07
0.01
157,975
0.08
0.02
0.46
0.12
0.05
0.01
75.1

West et al. NSW/ACT Recreational Fishing Survey – 2013/14
145 NSW Department of Primary Industries, December 2015
Other titles in this series
No. 1 Andrew, N.L., Graham, K.J., Hodgson, K.E. and Gordon, G.N.G., 1998. Changes after 20 years in relative
abundance and size composition of commercial fishes caught during fishery independent surveys on SEF
trawl grounds. Final Report to Fisheries Research and Development Corporation. Project no. 96/139.
No. 2 Virgona, J.L., Deguara, K.L., Sullings, D.J., Halliday, I. and Kelly, K., 1998. Assessment of the stocks of sea
mullet in New South Wales and Queensland waters.
No. 3 Stewart, J., Ferrell, D.J. and Andrew, N.L., 1998. Ageing Yellowtail (Trachurus novaezelandiae) and Blue
Mackerel (Scomber australasicus) in New South Wales.
No. 4 Pethebridge, R., Lugg, A. and Harris, J., 1998. Obstructions to fish passage in New South Wales South
Coast streams. 70pp.
No. 5 Kennelly, S.J. and Broadhurst, M.K., 1998. Development of by-catch reducing prawn-trawls and fishing
practices in NSW's prawn-trawl fisheries (and incorporating an assessment of the effect of increasing mesh
size in fish trawl gear). 18pp + appendices.
No. 6 Allan, G.L. and Rowland, S.J., 1998. Fish meal replacement in aquaculture feeds for silver perch. 237pp +
appendices.
No. 7 Allan, G.L., 1998. Fish meal replacement in aquaculture feeds: subprogram administration. 54pp +
appendices.
No. 8 Heasman, M.P., O'Connor, W.A. and O'Connor, S.J., 1998. Enhancement and farming of scallops in NSW
using hatchery produced seedstock. 146pp.
No. 9 Nell, J.A., McMahon, G.A. and Hand, R.E., 1998. Tetraploidy induction in Sydney rock oysters. 25pp.
No. 10 Nell, J.A. and Maguire, G.B., 1998. Commercialisation of triploid Sydney rock and Pacific oysters. Part 1:
Sydney rock oysters. 122pp.
No. 11 Watford, F.A. and Williams, R.J., 1998. Inventory of estuarine vegetation in Botany Bay, with special
reference to changes in the distribution of seagrass. 51pp.
No. 12 Andrew, N.L., Worthington D.G., Brett, P.A. and Bentley N., 1998. Interactions between the abalone fishery
and sea urchins in New South Wales.
No. 13 Jackson, K.L. and Ogburn, D.M., 1999. Review of depuration and its role in shellfish quality assurance.
77pp.
No. 14 Fielder, D.S., Bardsley, W.J. and Allan, G.L., 1999. Enhancement of Mulloway (Argyrosomus japonicus) in
intermittently opening lagoons. 50pp + appendices.
No. 15 Otway, N.M. and Macbeth, W.G., 1999. The physical effects of hauling on seagrass beds. 86pp.
No. 16 Gibbs, P., McVea, T. and Louden, B., 1999. Utilisation of restored wetlands by fish and invertebrates.
142pp.
No. 17 Ogburn, D. and Ruello, N., 1999. Waterproof labelling and identification systems suitable for shellfish and
other seafood and aquaculture products. Whose oyster is that? 50pp.
No. 18 Gray, C.A., Pease, B.C., Stringfellow, S.L., Raines, L.P. and Walford, T.R., 2000. Sampling estuarine fish
species for stock assessment. Includes appendices by D.J. Ferrell, B.C. Pease, T.R. Walford, G.N.G.
Gordon, C.A. Gray and G.W. Liggins. 194pp.
No. 19 Otway, N.M. and Parker, P.C., 2000. The biology, ecology, distribution, abundance and identification of
marine protected areas for the conservation of threatened Grey Nurse Sharks in south east Australian
waters. 101pp.
No. 20 Allan, G.L. and Rowland, S.J., 2000. Consumer sensory evaluation of silver perch cultured in ponds on
meat meal based diets. 21pp + appendices.
No. 21 Kennelly, S.J. and Scandol, J. P., 2000. Relative abundances of spanner crabs and the development of a
population model for managing the NSW spanner crab fishery. 43pp + appendices.
No. 22 Williams, R.J., Watford, F.A. and Balashov, V., 2000. Kooragang Wetland Rehabilitation Project: History of
changes to estuarine wetlands of the lower Hunter River. 82pp.
No. 23 Survey Development Working Group, 2000. Development of the National Recreational and Indigenous
Fishing Survey. Final Report to Fisheries Research and Development Corporation. (Volume 1 – 36pp +
Volume 2 – attachments).
No.24 Rowling, K.R and Raines, L.P., 2000. Description of the biology and an assessment of the fishery of Silver
Trevally Pseudocaranx dentex off New South Wales. 69pp.
No. 25 Allan, G.L., Jantrarotai, W., Rowland, S., Kosuturak, P. and Booth, M., 2000. Replacing fishmeal in
aquaculture diets. 13pp.
No. 26 Gehrke, P.C., Gilligan, D.M. and Barwick, M., 2001. Fish communities and migration in the Shoalhaven
River – Before construction of a fishway. 126pp.

West et al. NSW/ACT Recreational Fishing Survey – 2013/14
146 NSW Department of Primary Industries, December 2015
No. 27 Rowling, K.R. and Makin, D.L., 2001. Monitoring of the fishery for Gemfish Rexea solandri, 1996 to 2000.
44pp.
No. 28 Otway, N.M., 1999. Identification of candidate sites for declaration of aquatic reserves for the conservation
of rocky intertidal communities in the Hawkesbury Shelf and Batemans Shelf Bioregions. 88pp.
No. 29 Heasman, M.P., Goard, L., Diemar, J. and Callinan, R., 2000. Improved Early Survival of Molluscs: Sydney
Rock Oyster (Saccostrea glomerata). 63pp.
No. 30 Allan, G.L., Dignam, A and Fielder, S., 2001. Developing Commercial Inland Saline Aquaculture in
Australia: Part 1. R&D Plan.
No. 31 Allan, G.L., Banens, B. and Fielder, S., 2001. Developing Commercial Inland Saline Aquaculture in
Australia: Part 2. Resource Inventory and Assessment. 33pp.
No. 32 Bruce, A., Growns, I. and Gehrke, P., 2001. Woronora River Macquarie Perch Survey. 116pp.
No. 33 Morris, S.A., Pollard, D.A., Gehrke, P.C. and Pogonoski, J.J., 2001. Threatened and Potentially Threatened
Freshwater Fishes of Coastal New South Wales and the Murray-Darling Basin. 177pp.
No. 34 Heasman, M.P., Sushames, T.M., Diemar, J.A., O’Connor, W.A. and Foulkes, L.A., 2001. Production of
Micro-algal Concentrates for Aquaculture Part 2: Development and Evaluation of Harvesting, Preservation,
Storage and Feeding Technology. 150pp + appendices.
No. 35 Stewart, J. and Ferrell, D.J., 2001. Mesh selectivity in the NSW demersal trap fishery. 86pp.
No. 36 Stewart, J., Ferrell, D.J., van der Walt, B., Johnson, D. and Lowry, M., 2001. Assessment of length and age
composition of commercial kingfish landings. 49pp.
No. 37 Gray, C.A. and Kennelly, S.J., 2001. Development of discard-reducing gears and practices in the estuarine
prawn and fish haul fisheries of NSW. 151pp.
No. 38 Murphy, J.J., Lowry, M.B., Henry, G.W. and Chapman, D., 2002. The Gamefish Tournament Monitoring
Program – 1993 to 2000. 93pp.
No. 39 Kennelly, S.J. and McVea, T.A. (Ed), 2002. Scientific reports on the recovery of the Richmond and Macleay
Rivers following fish kills in February and March 2001. 325pp.
No. 40 Pollard, D.A. and Pethebridge, R.L., 2002. Report on Port of Botany Bay Introduced Marine Pest Species
Survey. 69pp.
No. 41 Pollard, D.A. and Pethebridge, R.L., 2002. Report on Port Kembla Introduced Marine Pest Species Survey.
72pp.
No. 42 O’Connor, W.A, Lawler, N.F. and Heasman, M.P., 2003. Trial farming the akoya pearl oyster, Pinctada
imbricata, in Port Stephens, NSW. 170pp.
No. 43 Fielder, D.S. and Allan, G.L., 2003. Improving fingerling production and evaluating inland saline water
culture of snapper, Pagrus auratus. 62pp.
No. 44 Astles, K.L., Winstanley, R.K., Harris, J.H. and Gehrke, P.C., 2003. Experimental study of the effects of
cold water pollution on native fish. 55pp.
No. 45 Gilligan, D.M., Harris, J.H. and Mallen-Cooper, M., 2003. Monitoring changes in the Crawford River fish
community following replacement of an effective fishway with a vertical-slot fishway design: Results of an
eight year monitoring program. 80pp.
No. 46 Pollard, D.A. and Rankin, B.K., 2003. Port of Eden Introduced Marine Pest Species Survey. 67pp.
No. 47 Otway, N.M., Burke, A.L., Morrison, NS. and Parker, P.C., 2003. Monitoring and identification of NSW
Critical Habitat Sites for conservation of Grey Nurse Sharks. 62pp.
No. 48 Henry, G.W. and Lyle, J.M. (Ed), 2003. The National Recreational and Indigenous Fishing Survey. 188 pp.
No. 49 Nell, J.A., 2003. Selective breeding for disease resistance and fast growth in Sydney rock oysters. 44pp.
(Also available – a CD-Rom published in March 2004 containing a collection of selected manuscripts
published over the last decade in peer-reviewed journals).
No. 50 Gilligan, D. and Schiller, S., 2003. Downstream transport of larval and juvenile fish. 66pp.
No. 51 Liggins, G.W., Scandol, J.P. and Kennelly, S.J., 2003. Recruitment of Population Dynamacist. 44pp.
No. 52 Steffe, A.S. and Chapman, J.P., 2003. A survey of daytime recreational fishing during the annual period,
March 1999 to February 2000, in Lake Macquarie, New South Wales. 124pp.
No. 53 Barker, D. and Otway, N., 2003. Environmental assessment of zinc coated wire mesh sea cages in Botany
Bay NSW. 36pp.
No. 54 Growns, I., Astles, A. and Gehrke, P., 2003. Spatial and temporal variation in composition of riverine fish
communities. 24pp.
No. 55 Gray, C. A., Johnson, D.D., Young, D.J. and Broadhurst, M. K., 2003. Bycatch assessment of the Estuarine
Commercial Gill Net Fishery in NSW. 58pp.
No. 56 Worthington, D.G. and Blount, C., 2003. Research to develop and manage the sea urchin fisheries of NSW
and eastern Victoria. 182pp.

West et al. NSW/ACT Recreational Fishing Survey – 2013/14
147 NSW Department of Primary Industries, December 2015
No. 57 Baumgartner, L.J., 2003. Fish passage through a Deelder lock on the Murrumbidgee River, Australia. 34pp.
No. 58 Allan, G.L., Booth, M.A., David A.J. Stone, D.A.J. and Anderson, A.J., 2004. Aquaculture Diet Development
Subprogram: Ingredient Evaluation. 171pp.
No. 59 Smith, D.M., Allan, G.L. and Booth, M.A., 2004. Aquaculture Diet Development Subprogram: Nutrient
Requirements of Aquaculture Species. 220pp.
No. 60 Barlow, C.G., Allan, G.L., Williams, K.C., Rowland, S.J. and Smith, D.M., 2004. Aquaculture Diet
Development Subprogram: Diet Validation and Feeding Strategies. 197pp.
No. 61 Heasman, M.H., 2004. Sydney Rock Oyster Hatchery Workshop 8 – 9 August 2002, Port Stephens, NSW.
115pp.
No. 62 Heasman, M., Chick, R., Savva, N., Worthington, D., Brand, C., Gibson, P. and Diemar, J., 2004.
Enhancement of populations of abalone in NSW using hatchery-produced seed. 269pp.
No. 63 Otway, N.M. and Burke, A.L., 2004. Mark-recapture population estimate and movements of Grey Nurse
Sharks. 53pp.
No. 64 Creese, R.G., Davis, A.R. and Glasby, T.M., 2004. Eradicating and preventing the spread of the invasive
alga Caulerpa taxifolia in NSW. 110pp.
No. 65 Baumgartner, L.J., 2004. The effects of Balranald Weir on spatial and temporal distributions of lower
Murrumbidgee River fish assemblages. 30pp.
No. 66 Heasman, M., Diggles, B.K., Hurwood, D., Mather, P., Pirozzi, I. and Dworjanyn, S., 2004. Paving the way
for continued rapid development of the flat (angasi) oyster (Ostrea angasi) farming in New South Wales.
40pp.
ISSN 1449-9967 (NSW Department of Primary Industries – Fisheries Final Report Series)
No. 67 Kroon, F.J., Bruce, A.M., Housefield, G.P. and Creese, R.G., 2004. Coastal floodplain management in
eastern Australia: barriers to fish and invertebrate recruitment in acid sulphate soil catchments. 212pp.
No. 68 Walsh, S., Copeland, C. and Westlake, M., 2004. Major fish kills in the northern rivers of NSW in 2001:
Causes, Impacts & Responses. 55pp.
No. 69 Pease, B.C. (Ed), 2004. Description of the biology and an assessment of the fishery for adult longfinned
eels in NSW. 168pp.
No. 70 West, G., Williams, R.J. and Laird, R., 2004. Distribution of estuarine vegetation in the Parramatta River
and Sydney Harbour, 2000. 37pp.
No. 71 Broadhurst, M.K., Macbeth, W.G. and Wooden, M.E.L., 2005. Reducing the discarding of small prawns in
NSW's commercial and recreational prawn fisheries. 202pp.
No. 72. Graham, K.J., Lowry, M.B. and Walford, T.R., 2005. Carp in NSW: Assessment of distribution, fishery and
fishing methods. 88pp.
No. 73 Stewart, J., Hughes, J.M., Gray, C.A. and Walsh, C., 2005. Life history, reproductive biology, habitat use
and fishery status of eastern sea garfish (Hyporhamphus australis) and river garfish (H. regularis ardelio) in
NSW waters. 180pp.
No. 74 Growns, I. and Gehrke, P., 2005. Integrated Monitoring of Environmental Flows: Assessment of predictive
modelling for river flows and fish. 33pp.
No. 75 Gilligan, D., 2005. Fish communities of the Murrumbidgee catchment: Status and trends. 138pp.
No. 76 Ferrell, D.J., 2005. Biological information for appropriate management of endemic fish species at Lord
Howe Island. 18 pp.
No. 77 Gilligan, D., Gehrke, P. and Schiller, C., 2005. Testing methods and ecological consequences of large-
scale removal of common carp. 46pp.
No. 78 Boys, C.A., Esslemont, G. and Thoms, M.C., 2005. Fish habitat and protection in the Barwon-Darling and
Paroo Rivers. 118pp.
No. 79 Steffe, A.S., Murphy, J.J., Chapman, D.J. and Gray, C.C., 2005. An assessment of changes in the daytime
recreational fishery of Lake Macquarie following the establishment of a ‘Recreational Fishing Haven’.
103pp.
No. 80 Gannassin, C. and Gibbs, P., 2005. Broad-Scale Interactions Between Fishing and Mammals, Reptiles and
Birds in NSW Marine Waters. 171pp.
No. 81 Steffe, A.S., Murphy, J.J., Chapman, D.J., Barrett, G.P. and Gray, C.A., 2005. An assessment of changes
in the daytime, boat-based, recreational fishery of the Tuross Lake estuary following the establishment of a
'Recreational Fishing Haven'. 70pp.
No. 82 Silberschnieder, V. and Gray, C.A., 2005. Arresting the decline of the commercial and recreational fisheries
for mulloway (Argyrosomus japonicus). 71pp.
No. 83 Gilligan, D., 2005. Fish communities of the Lower Murray-Darling catchment: Status and trends. 106pp.

West et al. NSW/ACT Recreational Fishing Survey – 2013/14
148 NSW Department of Primary Industries, December 2015
No. 84 Baumgartner, L.J., Reynoldson, N., Cameron, L. and Stanger, J., 2006. Assessment of a Dual-frequency
Identification Sonar (DIDSON) for application in fish migration studies. 33pp.
No. 85 Park, T., 2006. FishCare Volunteer Program Angling Survey: Summary of data collected and
recommendations. 41pp.
No. 86 Baumgartner, T., 2006. A preliminary assessment of fish passage through a Denil fishway on the Edward
River, Australia. 23pp.
No. 87 Stewart, J., 2007. Observer study in the Estuary General sea garfish haul net fishery in NSW. 23pp.
No. 88 Faragher, R.A., Pogonoski, J.J., Cameron, L., Baumgartner, L. and van der Walt, B., 2007. Assessment of
a stocking program: Findings and recommendations for the Snowy Lakes Trout Strategy. 46pp.
No. 89 Gilligan, D., Rolls, R., Merrick, J., Lintermans, M., Duncan, P. and Kohen, J., 2007. Scoping knowledge
requirements for Murray crayfish (Euastacus armatus). Final report to the Murray Darling Basin
Commission for Project No. 05/1066 NSW 103pp.
No. 90 Kelleway, J., Williams. R.J. and Allen, C.B., 2007. An assessment of the saltmarsh of the Parramatta River
and Sydney Harbour. 100pp.
No. 91 Williams, R.J. and Thiebaud, I., 2007. An analysis of changes to aquatic habitats and adjacent land-use in
the downstream portion of the Hawkesbury Nepean River over the past sixty years. 97pp.
No. 92 Baumgartner, L., Reynoldson, N., Cameron, L. and Stanger, J. The effects of selected irrigation practices
on fish of the Murray-Darling Basin. 90pp.
No. 93 Rowland, S.J., Landos, M., Callinan, R.B., Allan, G.L., Read, P., Mifsud, C., Nixon, M., Boyd, P. and Tally,
P., 2007. Development of a health management strategy for the Silver Perch Aquaculture Industry. 219pp.
No. 94 Park, T., 2007. NSW Gamefish Tournament Monitoring – Angling Research Monitoring Program. Final
report to the NSW Recreational Fishing Trust. 142pp.
No. 95 Heasman, M.P., Liu, W., Goodsell, P.J., Hurwood D.A. and Allan, G.L., 2007. Development and delivery of
technology for production, enhancement and aquaculture of blacklip abalone (Haliotis rubra) in New South
Wales. 226pp.
No. 96 Ganassin, C. and Gibbs, P.J., 2007. A review of seagrass planting as a means of habitat compensation
following loss of seagrass meadow. 41pp.
No. 97 Stewart, J. and Hughes, J., 2008. Determining appropriate harvest size at harvest for species shared by the
commercial trap and recreational fisheries in New South Wales. 282pp.
No. 98 West, G. and Williams, R.J., 2008. A preliminary assessment of the historical, current and future cover of
seagrass in the estuary of the Parramatta River. 61pp.
No. 99 Williams, D.L. and Scandol, J.P., 2008. Review of NSW recreational fishing tournament-based monitoring
methods and datasets. 83pp.
No. 100 Allan, G.L., Heasman, H. and Bennison, S., 2008. Development of industrial-scale inland saline
aquaculture: Coordination and communication of R&D in Australia. 245pp.
No. 101 Gray, C.A and Barnes, L.M., 2008. Reproduction and growth of dusky flathead (Platycephalus fuscus) in
NSW estuaries. 26pp.
No. 102 Graham, K.J., 2008. The Sydney inshore trawl-whiting fishery: codend selectivity and fishery
characteristics. 153pp.
No. 103 Macbeth, W.G., Johnson, D.D. and Gray, C.A., 2008. Assessment of a 35-mm square-mesh codend and
composite square-mesh panel configuration in the ocean prawn-trawl fishery of northern New South Wales.
104pp.
No. 104 O’Connor, W.A., Dove, M. and Finn, B., 2008. Sydney rock oysters: Overcoming constraints to commercial
scale hatchery and nursery production. 119pp.
No. 105 Glasby, T.M. and Lobb, K., 2008. Assessing the likelihoods of marine pest introductions in Sydney
estuaries: A transport vector approach. 84pp.
No. 106 Rotherham, D., Gray, C.A., Underwood, A.J., Chapman, M.G. and Johnson, D.D., 2008. Developing
fishery-independent surveys for the adaptive management of NSW’s estuarine fisheries. 135pp.
No. 107 Broadhurst, M., 2008. Maximising the survival of bycatch discarded from commercial estuarine fishing
gears in NSW. 192pp.
No. 108 Gilligan, D., McLean, A. and Lugg, A., 2009. Murray Wetlands and Water Recovery Initiatives: Rapid
assessment of fisheries values of wetlands prioritised for water recovery. 69pp.
No. 109 Williams, R.J. and Thiebaud, I., 2009. Occurrence of freshwater macrophytes in the catchments of the
Parramatta River, Lane Cove River and Middle Harbour Creek, 2007 – 2008. 75pp.
No. 110 Gilligan, D., Vey, A. and Asmus, M., 2009. Identifying drought refuges in the Wakool system and assessing
status of fish populations and water quality before, during and after the provision of environmental, stock
and domestic flows. 56pp.

West et al. NSW/ACT Recreational Fishing Survey – 2013/14
149 NSW Department of Primary Industries, December 2015
ISSN 1837-2112 (Industry & Investment NSW – Fisheries Final Report Series)
No. 111 Gray, C.A., Scandol. J.P., Steffe, A.S. and Ferrell, D.J., 2009. Australian Society for Fish Biology Annual
Conference & Workshop 2008: Assessing Recreational Fisheries; Current and Future Challenges. 54pp.
No. 112 Otway, N.M. Storrie, M.T., Louden, B.M. and Gilligan, J.J., 2009. Documentation of depth-related migratory
movements, localised movements at critical habitat sites and the effects of scuba diving for the east coast
grey nurse shark population. 90pp.
No. 113 Creese, R.G., Glasby, T.M., West, G. and Gallen, C., 2009. Mapping the habitats of NSW estuaries. 95pp.
No. 114 Macbeth, W.G., Geraghty, P.T., Peddemors, V.M. and Gray, C.A., 2009. Observer-based study of targeted
commercial fishing for large shark species in waters off northern New South Wales. 82pp.
No. 115 Scandol, J.P., Ives, M.C. and Lockett, M.M., 2009. Development of national guidelines to improve the
application of risk-based methods in the scope, implementation and interpretation of stock assessments for
data-poor species. 186pp.
No. 116 Baumgartner, L., Bettanin, M., McPherson, J., Jones, M., Zampatti, B. and Kathleen Beyer., 2009.
Assessment of an infrared fish counter (Vaki Riverwatcher) to quantify fish migrations in the Murray-Darling
Basin. 47pp.
No. 117 Astles, K., West, G., and Creese, R.G., 2010. Estuarine habitat mapping and geomorphic characterisation
of the Lower Hawkesbury river and Pittwater estuaries. 229pp.
No. 118 Gilligan, D., Jess, L., McLean, G., Asmus, M., Wooden, I., Hartwell, D., McGregor, C., Stuart, I., Vey, A.,
Jefferies, M., Lewis, B. and Bell, K., 2010. Identifying and implementing targeted carp control options for
the Lower Lachlan Catchment. 126pp.
No. 119 Montgomery, S.S., Walsh, C.T., Kesby, C.L and Johnson, D.D., 2010. Studies on the growth and mortality
of school prawns. 90pp.
No. 120 Liggins, G.W. and Upston, J., 2010. Investigating and managing the Perkinsus-related mortality of blacklip
abalone in NSW. 182pp.
No. 121 Knight, J., 2010. The feasibility of excluding alien redfin perch from Macquarie perch habitat in the
Hawkesbury-Nepean Catchment. 53pp.
No. 122 Ghosn, D., Steffe, A., Murphy, J., 2010. An assessment of the effort and catch of shore and boat-based
recreational fishers in the Sydney Harbour estuary over the 2007/08 summer period. 60pp.
No. 123 Rourke, M. and Gilligan, D., 2010. Population genetic structure of freshwater catfish (Tandanus tandanus)
in the Murray-Darling Basin and coastal catchments of New South Wales: Implications for future re-stocking
programs. 74pp.
No. 124 Tynan, R., Bunter, K. and O’Connor, W., 2010. Industry Management and Commercialisation of the Sydney
Rock Oyster Breeding Program. 21pp.
No. 125 Lowry, M., Folpp, H., Gregson, M. and McKenzie, R., 2010. Assessment of artificial reefs in Lake
Macquarie NSW. 47pp.
No. 126 Howell, T. and Creese, R., 2010. Freshwater fish communities of the Hunter, Manning, Karuah and
Macquarie-Tuggerah catchments: a 2004 status report. 93pp.
No. 127 Gilligan, D., Rodgers, M., McGarry, T., Asmus, M. and Pearce, L., 2010. The distribution and abundance of
two endangered fish species in the NSW Upper Murray Catchment. 34pp.
No. 128 Gilligan, D., McGarry, T. and Carter, S., 2010. A scientific approach to developing habitat rehabilitation
strategies in aquatic environments: A case study on the endangered Macquarie perch (
Macquaria
australasica
) in the Lachlan catchment. 61pp.
No. 129 Stewart, J., Hughes, J., McAllister, J., Lyle, J. and MacDonald, M., 2011. Australian salmon (Arripis trutta):
Population structure, reproduction, diet and composition of commercial and recreational catches. 257 pp.
ISSN 1837-2112 (Fisheries Final Report Series)
No. 130 Boys, C., Glasby, T., Kroon, F., Baumgartner, L., Wilkinson, K., Reilly, G. and Fowler, T., 2011. Case
studies in restoring connectivity of coastal aquatic habitats: floodgates, box culvert and rock-ramp fishway.
75pp.
No. 131 Steffe, A.S. and Murphy, J.J., 2011. Recreational fishing surveys in the Greater Sydney Region. 122pp.
No. 132 Robbins, W.D., Peddemors, V.M. and Kennelly, S.J., 2012. Assessment of shark sighting rates by aerial
beach patrols. 38pp.
No. 133 Boys, C.A. and Williams, R.J., 2012. Fish and decapod assemblages in Kooragang Wetlands: the impact of
tidal restriction and responses to culvert removal. 80pp.
No. 134 Boys, C.A, Baumgartner,L., Rampano, B., Alexander, T., Reilly, G., Roswell, M., Fowler, T and Lowry. M.
2012. Development of fish screening criteria for water diversions in the Murray-Darling Basin. 62pp.

West et al. NSW/ACT Recreational Fishing Survey – 2013/14
150 NSW Department of Primary Industries, December 2015
No. 135 Boys, C.A, Southwell, M., Thoms, M., Fowler, T, Thiebaud, I., Alexander, T. and Reilly, G. 2012. Evaluation
of aquatic rehabilitation in the Bourke to Brewarrina Demonstration Reach, Barwon-Darling River, Australia.
133pp
No. 136 Baumgartner, L., McPherson, B., Doyle, J., Cory, J., Cinotti, N. and Hutchison, J. 2013. Quantifying and
mitigating the impacts of weirs on downstream passage of native fish in the Murray-Darling Basin. 79pp.
No. 137 Boys, C.A, Baumgartner, B., Miller, B., Deng, Z., Brown, R. and Pflugrath, B. 2013. Protecting downstream
migrating fish at mini hydropower and other river infrastructure. 93pp.
No. 138 Hughes, J.M. and Stewart, J. 2013. Assessment of barotrauma and its mitigation measures on the
behaviour and survival of snapper and mulloway. 152pp.
No. 139 Ochwada-Doyle, F.A., McLeod, J., Barrett, G., Clarke, G. and Gray, C.A., 2014. Assessment of
recreational fishing in three recreational fishing havens in New South Wales. 29pp.
No. 140 Walsh, C. T., Rodgers, M. P., Thorne, N. J. and Robinson, W. A., 2013. Thermoshock Fish Mortality
Investigation. 32pp.
No. 141 Boys, C.A., Navarro, A., Robinson, W., Fowler, T., Chilcott, S., Miller, B., Pflugrath, B., Baumgartner, L.J.,
McPherson, J., Brown, R. and Deng, Z., 2014. Downstream fish passage criteria for hydropower and
irrigation infrastructure in the Murray-Darling Basin. 119pp.
No. 142 Cameron, L., Baumgartner, L. and Miners, B., 2012. Assessment of Australian bass restocking in the
upper Snowy River. 102pp.
No. 143 Walsh, C., Rodgers, M., Robinson, W. and Gilligan, D., 2014. Evaluation of the effectiveness of the
Tallowa Dam Fishway. 89pp.
ISSN 2204-8669 (NSW Trade & Investment – Fisheries Final Report Series)
No. 144 Ghosn, D.L., Collins, D.P. and Gould, A., 2015. The NSW Game Fish Tournament Monitoring Program
1994 to 2013: A summary of data and assessment of the role and design. 200pp.
No. 145 Boys, C., 2015. Changes in fish and crustacean assemblages in tidal creeks of Hexham Swamp following
the staged opening of Ironbark Creek floodgates. 47pp.
No. 146 Jordan, A., and Creese, R. 2015. Ecological Background to the Assessment of Shore-Based Recreational
fishing on Ocean Beaches and Rocky Headlands in Sanctuary Zones in mainland NSW Marine Parks.
114pp.
No. 147 Glasby, T.M. and West, G., 2015. Estimating losses of Posidonia australis due to boat moorings in Lake
Macquarie, Port Stephens and Wallis Lake. 30pp.
No. 148 Macbeth, W.G. and Gray, C.A., 2016. Observer-based study of commercial line fishing in waters off New
South Wales. 151p.
No. 149 West, L.D., Stark, K.E., Murphy, J.J., Lyle, J.M. and Ochwada-Doyle, F.A., 2016. Survey of Recreational
Fishing in New South Wales and the ACT, 2013/14. 150p.
