
Environmental and Hydrologic Overview of the
Yukon River Basin, Alaska and Canada
Water-Resources Investigations Report 99-4204
U.S. Department of the Interior
U.S. Geological Survey
Cover: Digital elevation model of the Yukon River Basin
Environmental and Hydrologic Overview of the Yukon River Basin,
Alaska and Canada
By Timothy P. Brabets, Bronwen Wang, and Robert H. Meade
________________________________________________________________________________________________
U.S. GEOLOGICAL SURVEY
Water-Resources Investigations Report 99-4204
Anchorage, Alaska
2000

U.S. DEPARTMENT OF THE INTERIOR
BRUCE BABBITT, Secretary
U.S. GEOLOGICAL SURVEY
CHARLES G. GROAT, Director
CONTRIBUTING U.S. GEOLOGICAL SURVEY STAFF
Editorial, Graphics, and Text Preparation
E.F. Snyder, Technical Editor
L-L. Harris, Cartographic Technician
For additional information: Copies of this report may be purchased from:
District Chief U.S. Geological Survey
U.S. Geological Survey Branch of Information Services
4230 University Drive, Suite 201 Box 25286
Anchorage, AK 99508-4664 Denver, CO 80225-0286
http://ak.water.usgs.gov
CONTENTS
Abstract . . . . . . . . . . . . . . . . . . . . . . . . . . . . . . . . . . . . . . . . . . . . . . . . . . . 1
Introduction. . . . . . . . . . . . . . . . . . . . . . . . . . . . . . . . . . . . . . . . . . . . . . . . . 1
Purpose and Scope. . . . . . . . . . . . . . . . . . . . . . . . . . . . . . . . . . . . . . . . 5
Acknowledgments . . . . . . . . . . . . . . . . . . . . . . . . . . . . . . . . . . . . . . . . 5
Description and History of the Yukon River Basin . . . . . . . . . . . . . . . . . . 7
The Yukon River and its Major Tributaries. . . . . . . . . . . . . . . . . . . . . 7
Exploration of the Yukon River Basin . . . . . . . . . . . . . . . . . . . . . . . . 11
People and Land. . . . . . . . . . . . . . . . . . . . . . . . . . . . . . . . . . . . . . . . . . 12
Economic Activity. . . . . . . . . . . . . . . . . . . . . . . . . . . . . . . . . . . . . . . . 14
Environmental Characteristics of the Yukon River Basin . . . . . . . . . . . . . 16
Physiography . . . . . . . . . . . . . . . . . . . . . . . . . . . . . . . . . . . . . . . . . . . . 16
Climate. . . . . . . . . . . . . . . . . . . . . . . . . . . . . . . . . . . . . . . . . . . . . . . . . 20
Geology . . . . . . . . . . . . . . . . . . . . . . . . . . . . . . . . . . . . . . . . . . . . . . . . 22
Land Cover . . . . . . . . . . . . . . . . . . . . . . . . . . . . . . . . . . . . . . . . . . . . . 25
Soils . . . . . . . . . . . . . . . . . . . . . . . . . . . . . . . . . . . . . . . . . . . . . . . . . . . 28
Permafrost . . . . . . . . . . . . . . . . . . . . . . . . . . . . . . . . . . . . . . . . . . . . . . 32
Ecoregions . . . . . . . . . . . . . . . . . . . . . . . . . . . . . . . . . . . . . . . . . . . . . . 36
Hydrologic Characteristics of the Yukon River Basin . . . . . . . . . . . . . . . . 48
Surface Water . . . . . . . . . . . . . . . . . . . . . . . . . . . . . . . . . . . . . . . . . . . 48
Snow and Ice. . . . . . . . . . . . . . . . . . . . . . . . . . . . . . . . . . . . . . . . . 50
Streamflow . . . . . . . . . . . . . . . . . . . . . . . . . . . . . . . . . . . . . . . . . . 50
Floods . . . . . . . . . . . . . . . . . . . . . . . . . . . . . . . . . . . . . . . . . . . . . . 60
Droughts . . . . . . . . . . . . . . . . . . . . . . . . . . . . . . . . . . . . . . . . . . . . 62
Sediment . . . . . . . . . . . . . . . . . . . . . . . . . . . . . . . . . . . . . . . . . . . . . . . 64
Sources of Sediment . . . . . . . . . . . . . . . . . . . . . . . . . . . . . . . . . . . 65
Suspended-Sediment Concentrations . . . . . . . . . . . . . . . . . . . . . . 66
Relation Between Suspended-Sediment Concentration
and Water Discharge. . . . . . . . . . . . . . . . . . . . . . . . . . . . . . . . . . . 68
Suspended-Sediment Discharge . . . . . . . . . . . . . . . . . . . . . . . . . 72
Storage of Sediment . . . . . . . . . . . . . . . . . . . . . . . . . . . . . . . . . . . 75
Bedload. . . . . . . . . . . . . . . . . . . . . . . . . . . . . . . . . . . . . . . . . . . . . 77
Water Quality. . . . . . . . . . . . . . . . . . . . . . . . . . . . . . . . . . . . . . . . . . . . 78
Yukon River Main Stem. . . . . . . . . . . . . . . . . . . . . . . . . . . . . . . . 84
Temporal Variations in Water Quality. . . . . . . . . . . . . . . . . . . . . 94
Spatial Variations in Water Quality . . . . . . . . . . . . . . . . . . . . . . . 97
Anthropogenic Effects on Water Quality . . . . . . . . . . . . . . . . . . . 102
Summary. . . . . . . . . . . . . . . . . . . . . . . . . . . . . . . . . . . . . . . . . . . . . . . . . . . 103
References Cited . . . . . . . . . . . . . . . . . . . . . . . . . . . . . . . . . . . . . . . . . . . . . 104
FIGURES
1. Map showing location of the Yukon River Basin in Canada
and Alaska . . . . . . . . . . . . . . . . . . . . . . . . . . . . . . . . . . . . . . . . . . . . 2
2. Map showing digital elevation model of the Yukon River Basin . . 3
3. Graph showing number of growing days for four ecoregions of the
Yukon River Basin, 1991-99 . . . . . . . . . . . . . . . . . . . . . . . . . . . . . . 4
4. Map showing observed trends of Arctic annual mean
temperatures from 1961-90 . . . . . . . . . . . . . . . . . . . . . . . . . . . . . . . 5
5. A. Map showing rivers, lakes, and glaciers of the Yukon
River Basin . . . . . . . . . . . . . . . . . . . . . . . . . . . . . . . . . . . . . . . . 8
B. Map showing roads and towns in the Yukon River Basin . . . . . 9
6. Cross sections of the Yukon River above Frank Creek, Yukon
Territory, to Pilot Station, Alaska . . . . . . . . . . . . . . . . . . . . . . . . . . 10
7-18. Maps showing:
7. Land ownership of the Yukon River Basin . . . . . . . . . . . . . . . . 13
8. Physiographic regions of the Yukon River Basin . . . . . . . . . . . 17
9. Precipitation regions of the Yukon River Basin . . . . . . . . . . . . 21
10. Geology of the Yukon River Basin . . . . . . . . . . . . . . . . . . . . . . 23
11. Land cover classes of the Yukon River Basin . . . . . . . . . . . . . . 26
12. Soils of the Yukon River Basin . . . . . . . . . . . . . . . . . . . . . . . . . 29
13. Permafrost regions of the Yukon River Basin . . . . . . . . . . . . . . 33
14. Wetland areas of the Yukon River Basin . . . . . . . . . . . . . . . . . . 34
15. Areas of forest fires in the Yukon River Basin . . . . . . . . . . . . . 35
16. Ecoregions of the Yukon River Basin . . . . . . . . . . . . . . . . . . . . 37
17. Major drainage basins in the Yukon River Basin. . . . . . . . . . . . 49
18. Location of streamflow-gaging stations with 10 or more
years of record in the Yukon River Basin . . . . . . . . . . . . . . . . . 51
19-22. Graphs showing:
19. Flow statistics of three rivers near the headwaters of the
Yukon River . . . . . . . . . . . . . . . . . . . . . . . . . . . . . . . . . . . . . . . . 54
20. Flow statistics of nine major rivers of the Yukon River Basin . 55
21. Average discharge of the Yukon River at eight locations . . . . . 57
22. Percent contributions of area and flow of the major drainage
basins of the Yukon River Basin . . . . . . . . . . . . . . . . . . . . . . . . 58
23. Map showing percentage of major river outflows into marginal
seas of the Arctic Ocean. . . . . . . . . . . . . . . . . . . . . . . . . . . . . . . 59
24-25. Graphs showing:
24. Flow statistics of the Salcha River near Salchaket, Alaska. . . . 61
25. Departure from average discharge for several long-term
streamflow-gaging stations in the Yukon River Basin . . . . . . . 63
26. Boxplots of suspended-sediment concentration at 14 sites in
the Yukon River Basin . . . . . . . . . . . . . . . . . . . . . . . . . . . . . . . . . . 67
27-34. Graphs showing:
27. Water discharge and suspended-sediment concentrations for
Chena River at Fairbanks, Alaska and Nenana River near
Healy, Alaska for 1964-66 runoff seasons. . . . . . . . . . . . . . . . . 69
28. Instantaneous discharge and suspended-sediment concen-
trations for different particle sizes for Tanana River near
Tanacross, Alaska and Tanana River at Fairbanks, Alaska. . . . 70
29. Average daily water discharge and suspended-sediment
concentration for Tanana River near Tanacross, Alaska and
Yukon River at Eagle, Alaska during 1963 runoff season . . . . 71
30. Seasonal distribution of suspended-sediment discharge for
three rivers in the Yukon River Basin . . . . . . . . . . . . . . . . . . . . 72
31. Differences in water discharge and suspended-sediment
load during water years 1964-66 for Nenana River near
Healy, Alaska and Chena River at Fairbanks, Alaska. . . . . . . . 73
32. Changing proportions of suspended-sediment discharge
during 1954 runoff season in Tanana River near
Tanacross, Alaska . . . . . . . . . . . . . . . . . . . . . . . . . . . . . . . . . . . 74
33. Annual suspended-sediment loads for 14 sites located in the
Yukon River Basin. . . . . . . . . . . . . . . . . . . . . . . . . . . . . . . . . . . 76
34. Suspended-sediment and bedload discharge measured in the
Tanana River at Fairbanks, Alaska, 1977-82. . . . . . . . . . . . . . . 77
35. Map showing location of water-quality sampling stations where
one or more samples have been collected in the Yukon River Basin. . 79
36. Map showing location of water-quality sampling stations where
10 or more samples have been collected in the Yukon River Basin . . 80
37. Boxplots of specific conductance from samples taken during open
water and under ice cover on the Yukon River. . . . . . . . . . . . . . . . 95
TABLES
1. Comparison of salmon harvests for various time periods, Yukon
River Basin, Alaska . . . . . . . . . . . . . . . . . . . . . . . . . . . . . . . . . . . . . 14
2. Watersheds where mining has occurred in the Yukon River
Basin. . . . . . . . . . . . . . . . . . . . . . . . . . . . . . . . . . . . . . . . . . . . . . . . . 15
3. Types and areas of land cover in the Yukon River Basin . . . . . . . . 25
4. Areas of ecoregions in the Yukon River Basin . . . . . . . . . . . . . . . . 36
5. Major drainage basins in the Yukon River Basin . . . . . . . . . . . . . . 48
6. Streamflow-gaging stations in the Yukon River Basin with
10 or more years of record . . . . . . . . . . . . . . . . . . . . . . . . . . . . . . . . 52
7. Flow contributions of major drainage basins to the Yukon River
Basin. . . . . . . . . . . . . . . . . . . . . . . . . . . . . . . . . . . . . . . . . . . . . . . . . 56
8. Suspended-sediment stations in the Yukon River Basin . . . . . . . . . 64
9. Mean grain-size composition of suspended sediment for stations
in the Yukon River Basin. . . . . . . . . . . . . . . . . . . . . . . . . . . . . . . . . 68
10. Estimated annual suspended-sediment loads for selected sites in
the Yukon River Basin. . . . . . . . . . . . . . . . . . . . . . . . . . . . . . . . . . . 75
11. Water-quality stations in the Yukon River Basin with 10 or
more years of record. . . . . . . . . . . . . . . . . . . . . . . . . . . . . . . . . . . . . 81
12. Summary statistics for selected properties and constituents of
surface-water samples from stations along the Yukon River. . . . . . 85
13. Summary statistics for selected properties and constituents of
surface-water samples from tributaries of the Yukon River . . . . . . 91
14. Comparison of samples taken during open water and under
ice cover, Yukon River at Pilot Station . . . . . . . . . . . . . . . . . . . . . . 96
15.Summary statistics for selected properties and constituents of
surface-water samples by ecoregion

CONVERSION FACTORS, ABBREVIATED UNITS, AND VERTICAL DATUM
Multiply by To obtain
inch (in.) 25.4 millimeter
foot (ft) 0.3048 meter
mile (mi) 1.609 kilometer
square foot (ft
2
) 0.09290 square meter
square mile (mi
2
) 2.590 square kilometer
foot per second (ft/s) 0.3048 meter per second
cubic foot per second (ft
3
/s) 0.02832 cubic meter per second
inch per year (in/yr) 25.4 millimeter per year
ton 0.9072 megagram
ton per day (ton/d) 0.9072 megagram per day
ton per year (ton/d) 0.9072 megagram per year
foot per mile (ft/mi) 0.1894 meter per kilometer
In this report, temperature is reported in degrees Fahrenheit (°F), which can be converted to degrees Celsius (°C)
by the following equation:
°
C = (°F-32)/1.8
OTHER ABBREVIATED UNITS
mg/L, milligram per liter
µg/L, microgram per liter
µS/cm, microsiemen per centimeter at 25 degrees Celsius
mm, millimeter
VERTICAL DATUM
Sea level: In this report, “sea level” refers to the National Geodetic Vertical Datum of 1929—A geodetic datum derived
from a general adjustment of the first-order level nets of the United States and Canada, formerly called Sea Level
Datum of 1929.

Introduction 1
ABSTRACT
The Yukon River, located in northwestern Canada and cen-
tral Alaska, drains an area of more than 330,000 square miles,
making it the fourth largest drainage basin in North America.
Approximately 126,000 people live in this basin and 10 percent of
these people maintain a subsistence lifestyle, depending on the
basin’s fish and game resources. Twenty ecoregions compose the
Yukon River Basin, which indicates the large diversity of natural
features of the watershed, such as climate, soils, permafrost, and
geology.
Although the annual mean discharge of the Yukon River near
its mouth is more than 200,000 cubic feet per second, most of the
flow occurs in the summer months from snowmelt, rainfall, and
glacial melt. Eight major rivers flow into the Yukon River. Two of
these rivers, the Tanana River and the White River, are glacier-fed
rivers and together account for 29 percent of the total water flow
of the Yukon. Two others, the Porcupine River and the Koyukuk
River, are underlain by continuous permafrost and drain larger
areas than the Tanana and the White, but together contribute only
22 percent of the total water flow in the Yukon.
At its mouth, the Yukon River transports about 60 million
tons of suspended sediment annually into the Bering Sea. How-
ever, an estimated 20 million tons annually is deposited on flood
plains and in braided reaches of the river. The waters of the main
stem of the Yukon River and its tributaries are predominantly cal-
cium magnesium bicarbonate waters with specific conductances
generally less than 400 microsiemens per centimeter. Water qual-
ity of the Yukon River Basin varies temporally between summer
and winter. Water quality also varies spatially among ecoregions.
INTRODUCTION
Few rivers have the intrinsic allure of the Yukon River. Its
history, people, and mystique have innate appeal. The Yukon is a
transportation corridor in a vast area of roadless Alaska. Salmon
species migrate the entire length of the river to spawn and are also
a staple of the subsistence lifestyle of rural villages. Villages and
towns obtain water for drinking from the river and associated aqui-
fers. Recreational activities abound for both residents and tourists.
However, the river is not benign: flooding and erosion are hazards
to people, buildings, roads, and airfields.
The Yukon River Basin (figs. 1 and 2) is located in north-
western Canada and central Alaska, and is approximately 330,000
mi
2
in area. The basin represents one of the largest and most
diverse ecosystems in North America. Despite its remoteness and
perceived invulnerability, the Yukon River Basin is changing. For
example, from 1991 to 1999, the number of growing days in
Environmental and Hydrologic Overview of the Yukon River Basin,
Alaska and Canada
By Timothy P. Brabets, Bronwen Wang and Robert H. Meade

2 Environmental and Hydrologic Overview of the Yukon River Basin, Alaska and Canada
Arctic Ocean
Canada
Alaska
Yukon River Basin
British
Columbia
Northwest Territories
168
o
160
o
152
o
144
o
136
o
128
o
176
o
180
o
176
o
120
o
112
o
72
o
160
o
168
o
68
o
64
o
60
o
56
o
Russia
Bering Sea
72
o
Yukon
Territory
Figure 1. Location of the Yukon River Basin in Canada and Alaska.
0
0
100
100
200
200 300 KILOMETERS
300 MILES

Introduction 3
DIGITAL ELEVATION MODEL
Figure 2. Digital elevation model of the Yukon River Basin.

4 Environmental and Hydrologic Overview of the Yukon River Basin, Alaska and Canada
Alaska for four ecoregions has ranged from 130 to 194 days (fig.
3). Air temperature records from 1961-90 indicate a warming
trend on the order of 1.4 °F (0.75 °C) per decade at latitudes where
the Yukon River is located (fig. 4) (Chapman and Walsh, 1993). If
this warming trend continues, the growing season will likely
increase. Climate changes will also influence the permafrost dis-
tribution, glacial runoff, and biogeochemical fluxes within and
from the basin (BESIS, 1997). The Yukon River is also fundamen-
tal to the Bering Sea ecosystem (fig. 1), providing most of the fresh
water runoff, sediments, and dissolved solutes in the eastern part
of the sea (Lisitsysn, 1969). Thus, processes that influence the
Yukon River could in turn influence the Bering Sea.
1990 20001992 1994 1996 1998
120
200
140
160
180
NUMBER OF GROWING DAYS
Figure 3. Number of growing days for four ecoregions of the Yukon River Basin, 1991-99 (data
provided by Carl Markon, USGS, 1999; see figure 16 for location of ecoregions).
YEAR
Yukon Plateau North
Interior Highlands
Interior Bottomlands
Interior Forested Lowlands & Uplands
EXPLANATION

Introduction 5
Purpose and Scope
This report summarizes the environ-
mental, flow, and water-quality character-
istics of the Yukon River Basin. The
purpose of this summary is twofold: (1) to
gain a more complete understanding of the
currently known surface-water and water-
quality characteristics of the Yukon River
and (2) to provide background information
needed to design a sound water-quality
sampling program for the basin. The scope
of this study includes the entire Yukon
River Basin. Only historical data were
used in this compilation. Although ground
water is an important water resource in the
Yukon River Basin, it is described in this
report only in general terms.
Acknowledgments
The authors gratefully acknowledge
the efforts of the Water Survey of Can-
ada/Environment Canada in providing
streamflow and water-quality information
for use in this report. Lynne Campo pro-
vided discharge and suspended-sediment
data and Andrea Ryan provided access via
the web to water-quality data. Carl
Markon (USGS) provided data on the
growing seasons in Alaska and combined
the land cover characteristics from Canada
and Alaska data sets into one cohesive
map of the entire basin.

6 Environmental and Hydrologic Overview of the Yukon River Basin, Alaska and Canada
Marshall
Russian Mission
Four villages along the lower Yukon River that were flooded from ice jams in 1988. Many villages located along the banks of the Yukon River
and its major tributaries are subject to flooding during ice breakup. (photographs courtesy of Larry Rundquist, National Weather Service).
Marshall
Pitkas Point
Russian Mission
Mountain Village
Description and History of the Yukon River Basin 7
DESCRIPTION AND HISTORY OF THE
YUKON RIVER BASIN
The Yukon River and its Major Tributaries
The Yukon River Basin is the fourth largest basin in North
America and the fifth largest in terms of average discharge
(Schumm and Winkley, 1994). Although no universal agreement
exists as to the source of the Yukon River, it is believed to originate
from the Llewellyn Glacier, near Atlin Lake, in northwestern Brit-
ish Columbia (Parfit, 1998) (fig. 5A). From this point, the river
flows for more than 2,000 mi in a broad arc through the Yukon Ter-
ritory of Canada and central Alaska, emptying into the Bering Sea.
From its headwaters, the Yukon River generally flows north-
westward to the Canada/Alaska boundary. Near the outlet of Lake
Laberge (fig. 5A) above Frank Creek, the river is approximately
300 ft wide (fig. 6A), but downstream from the junction of the Tes-
lin River at Carmacks, the width increases to about 600 ft (fig. 6B).
Below Carmacks, the Dawson Range lies on the west and the Ogil-
vie and Pelly Mountains lie on the east. The Pelly and Stewart Riv-
ers (fig. 5A), whose sources are along the Yukon Territory/
Northwest Territories border, drain about 38,000 mi
2
. The White
River (fig. 5A) drains about 18,000 mi
2
, and includes the extensive
snowfields and glaciers of the Wrangell–St. Elias Mountains. The
inflow from these three large rivers increases the width of the
Yukon to approximately 1,000 ft at Dawson (fig. 6C).
At Fortymile, in Canada, about 60 river miles upstream from
Eagle (fig. 5B), the Yukon River flows between bluffs of the
Tanana Uplands on the south and the Ogilvie Mountains on the
north. At Eagle, the width of the Yukon has increased to about
1,500 ft (fig. 6D). From Eagle, the Yukon flows for about 150 mi
through the Yukon-Charley Rivers National Preserve to Circle
(fig. 5B). This national park encompasses parts of the valley on
both sides of the Yukon and all of the drainage of the Charley
River, a designated National Wild and Scenic River. The Nation
and Kandik Rivers, entering from the north, are the other major
tributaries between Eagle and Circle.
At Circle, the altitude of the Yukon River is approximately
600 ft above sea level and yet the river is still more than 1,000 mi
inland. Circle marks the beginning of the Yukon Flats, a large low-
land area crisscrossed by meandering river channels that are con-
stantly shifting. Much of the lowland is part of the Yukon Flats
National Wildlife Refuge. The landscape is characterized by flat
terrain and is encircled by mountains, which trap the heat and the
cold. This feature results in extreme air temperatures in the sum-
mer (as high as 100
o
F) and winter (as low as -30
o
F).
Approximately 60 mi downstream from Circle is the village
of Fort Yukon (fig. 5B), where the Porcupine River enters the
Yukon River from the northeast (fig. 5A). The Porcupine River
drains about 45,000 mi
2
of the northeast part of the Yukon River
Basin and is about 500 mi long. Downstream from Fort Yukon, the
Chandalar River, which drains the Brooks Range, enters the Yukon
from the north. The Yukon River reaches its northernmost point at
the Arctic Circle at this location, and begins to flow westward and
southward to the Bering Sea.
Stevens Village (fig. 5B) marks the approximate end of the
Yukon Flats. The Yukon River flows in a more confined area,
sometimes referred to as Rampart Canyon. At this point, the river
is approximately 2,000 ft wide (fig. 6E) and is the location where
the trans-Alaska oil pipeline crosses the river. Approximately 150
mi downstream from Stevens Village, the Tanana River enters the
Yukon from the southeast (fig. 5A). The Tanana River is a large
tributary to the Yukon and drains approximately 44,000 mi
2
.
Included in the Tanana drainage is the north side of the Alaska
Range, an extensively glaciated area.

8 Environmental and Hydrologic Overview of the Yukon River Basin, Alaska and Canada
0
0
100
100
200
200
300 KILOMETERS
300 MILES
RIVERS, LAKES AND GLACIERS
Andreafsky R.
Innoko R.
Melozitna R.
Koyukuk R.
South Fork
Koyukuk R.
Kanuti R.
Nowitna R.
Tozitna R
.
Tanana R.
Dall
R.
Hodzana
R.
Chandalar
R.
Old Crow
R.
Porcupine R.
Tanana R.
Nenana R.
Chena R.
Salcha R.
Goodpaster R.
Charley
R.
Kandik R.
Nation R.
Klondike R.
Stewart R.
Pelly R.
White R.
Kluane R.
Frank Cr.
Lake
Laberge
Teslin R.
YUKON RIVER
YUKON RIVER
YU
K
O
N RIVER
YUKON RIVER
YUKON RIVER
YUKON
RIVER
Fantail R.
Swift
R.
BERING
SEA
Alaska Range
Wrangell-St.Elias Mt
Llewellyn
Glacier
Figure 5A. Rivers, lakes and glaciers of the Yukon River Basin.

Description and History of the Yukon River Basin 9
Figure 5B. Roads and towns in the Yukon River Basin.
ALASKA
HIGHWAY
ROADS & TOWNS
0
0
100
100
200
200
300 KILOMETERS
300 MILES
Newtok
Saint Marys
Pilot Station
Russian Mission
Holy Cross
Grayling
Shageluk
Kaltag
Koyukuk
Ruby
Huslia
Hughes
Alatna
Bettles
Anaktuvuk Pass
Wiseman
Tanana
Rampart
Minto
Fairbanks
Nenana
Cantwell
Healy
Delta Junction
Dot Lake
Eagle
Dawson
Northway Junction
Beaver Creek
Destruction
Bay
Stewart Crossing
Pelly Crossing
Faro
Carmacks
Whitehorse
Carcross
Teslin
Ross River
Mayo
Central
Circle
Birch Creek
Fort Yukon
Venetie
Arctic Village
Old Crow
Hooper
Bay
Chevak
Anvik
Kotlik
Alakanuk
Galena
Nulato
Allakaket
Beaver
Stevens
Village
Livengood
Manley Hot
Springs
North Pole
Two Rivers
Big Delta
Tok
Boundary
Burwash Landing
Ohogamiut
Mountain
Village
Tanacross
Fortymile

10 Environmental and Hydrologic Overview of the Yukon River Basin, Alaska and Canada
Discharge = 22,900 ft
3
/s
Width = 302 ft
Area = 3,540 ft
2
Velocity = 6.47 ft/s
Discharge = 23,000 ft
3
/s
Width = 597 ft
Area = 5,000 ft
2
Velocity = 4.60 ft/s
Discharge = 108,000 ft
3
/s
Area = 23,600 ft
2
Velocity = 4.58 ft/s
ARBITRARY GAGE HEIGHT, IN FEET
0
20
10
0
20
10
0
40
20
0 35050 100 150 200 250 300
A. YUKON RIVER ABOVE FRANK CREEK, AUGUST 6, 1991
0 800200 400 600
B. YUKON RIVER AT CARMACKS, MAY 20, 1992
0 1200200 400 600 800 1000
C. YUKON RIVER AT DAWSON, OCTOBER 9, 1991
Width = 1,000 ft
Figure 6. Cross sections of the Yukon River above Frank Creek, Yukon
Territory, to Pilot Station, Alaska.
-20
40
0
20
0 2000500 1000 1500
D. YUKON RIVER AT EAGLE, AUGUST 1, 1997
Discharge = 229,000 ft
3
/s
Width = 1550 ft
Area = 33,800 ft
2
Velocity = 6.78 ft/s
DISTANCE, IN FEET FROM LEFT BANK
0
40
10
20
30
0 2500500 1000 1500 2000
E. YUKON RIVER NEAR STEVENS VILLAGE,
SEPTEMBER 21, 1995
Discharge = 231,000 ft
3
/s
Width = 2150 ft
Area = 50,100 ft
2
Velocity = 4.61 ft/s
30000 1000 2000
F. YUKON RIVER AT RUBY, JULY 15, 1976
-40
20
-20
0
3000500 1000 1500 2000 2500
G. YUKON RIVER AT PILOT STATION, JUNE 26, 1996
-60
20
-40
-20
0
ARBITRARY GAGE HEIGHT, IN FEET
Discharge = 302,000 ft
3
/s
Width = 2,650 ft
Area = 74,900 ft
2
Velocity = 4.03 ft/s
Discharge = 415,000 ft
3
/s
Width = 2850 ft
Area = 131,000 ft
2
Velocity = 3.17 ft/s
DISTANCE, IN FEET FROM LEFT BANK
0
Description and History of the Yukon River Basin 11
Past the Tanana River, the Nowitna National Wildlife Refuge
is located on the south side of the Yukon River for approximately
70 mi. The Nowitna River, a National Wild and Scenic River,
enters the Yukon from the southeast. Past the wildlife refuge is the
village of Ruby, where the Melozitna River enters from the north
(fig. 5A). The width of the Yukon is approximately 2,500 ft at
Ruby (fig. 6F). Galena, a village located about 50 mi downstream
from Ruby is the largest community in this part of the Yukon River
Basin.
Downstream from Galena, the Koyukuk River, a major trib-
utary of the Yukon River, enters the Yukon from the north. The
Koyukuk, which drains much of the north-central part of the
Yukon River Basin, has a drainage area of about 35,000 mi
2
and is
about 400 mi in length. At this point, the Yukon changes direction,
flowing almost due south for about 160 mi. The Innoko National
Wildlife Refuge is located on the east side of the river and near the
end of this stretch of the Yukon, the Innoko River enters the Yukon
near the village of Holy Cross. The Innoko River drains much of
the area between the Yukon and Kuskokwim Rivers and flows in
a broad S for about 500 mi.
Holy Cross is located about 280 mi upstream from the mouth
of the Yukon. Several miles downstream from this village, the
Yukon River begins to flow to the west, between hills and bluffs
approximately 2,000 ft high. At Ohogamiut, an abandoned fishing
village, the river turns northward. As the Yukon passes Pilot Sta-
tion, the channel is about 3,000 ft wide (fig. 6G). Near Saint
Marys, the Andreafsky River enters. The Andreafsky River is rel-
atively small but has been designated a National Wild and Scenic
river. From Saint Marys, the Yukon River flows through many
channels in a large wetland area and then to the Bering Sea.
Exploration of the Yukon River Basin
The following history of the Yukon River Basin is summa-
rized from publications by the Alaska Geographic Society (1987,
1990, and 1991). The aboriginal people of the Yukon River Basin
may be among the oldest known residents of North America. After
crossing Beringia, the land bridge that once linked Asia and Amer-
ica, these early people occupied Alaska and the western part of the
Yukon Territory. Those who did not trade with the coastal Tlingits
of southeastern Alaska remained free of influence from other cul-
tures until the 19
th
century.
Interest in furs, not gold, lured the first outsiders to the
Yukon. One of the earliest explorations of the Yukon Basin by
Europeans was undertaken by Robert Campbell of the Hudson’s
Bay Company. In 1840, Campbell explored the Pelly River and in
1848 established an outpost at the junction of the Pelly and Yukon
Rivers. John Bell, also of the Hudson’s Bay Company, explored
the Porcupine River in 1844 and established an outpost at Fort
Yukon.
Beginning in the 1870’s, Leroy McQuesten, Arthur Harper,
and Alfred Mayo, established a number of trading posts up and
down the Yukon River. The threesome spent some time each sum-
mer and fall prospecting and began to realize the potential mineral
wealth of the Yukon. Foreseeing the passing of the fur trader and
the rise of the prospector, they gradually changed their stock from
the needs of Natives and fur traders to equipment and supplies for
miners. In 1885, miners found placer gold on the Stewart River
and in 1886, gold was discovered on the Fortymile River. Addi-
tional discoveries were made in the Circle and Rampart areas in
1893. However, these first paying strikes in the Yukon River Basin
were only a trickle compared to the tidal wave of miners that
would come with the Klondike discoveries at Dawson in 1897.

12 Environmental and Hydrologic Overview of the Yukon River Basin, Alaska and Canada
Between 1897 and 1900, people from virtually every corner
of the world and from every conceivable background headed
toward the Klondike. At its peak, Dawson was home to as many as
25,000 people. Although only a few “struck it rich,” the 1897 gold
rush to the Klondike in the Yukon Territory, more than any other
event, led to commercial mining in the Yukon River Basin. Many
prospectors who arrived too late began to explore all through the
Yukon River Basin, setting off mini-stampedes to areas reporting
new gold strikes.
The construction of the Alaska Highway (fig. 5B) in 1942, to
provide a road link from the Lower 48 to Alaska as a defense mea-
sure during World War II, signaled an end to a way of life in the
Yukon. Commercial river traffic ended a few years later. Gradu-
ally, a network of roads was constructed that today links many of
the communities.
People and Land
Approximately 126,000 people live in the Yukon River
Basin and 10 percent of these people maintain a subsistence life-
style, depending on the basin’s fish and game resources. In the
Canadian part of the Yukon River Basin, Whitehorse (fig. 5B) is
the center of population with just over 23,000 residents in 1998
(Environment Canada, 1999). The towns of Dawson and Faro
have just over 2,000 and 1,000 residents respectively. The remain-
ing towns have populations ranging from 100 to 500 residents. In
Alaska, the greater Fairbanks area (Fairbanks and North Pole) is
the center of population and had approximately 84,000 residents in
1996 (Alaska Department of Labor, 1999). About 12,000 other
residents are located in 43 villages scattered across the Yukon
River Basin from the Canadian border to the mouth of the Yukon
River. Village populations range from approximately 30 to 800
people, with typical villages having fewer than 300 residents. Two
major ethnic groups historically occupied the Yukon River Basin:
the Yupik Eskimos who live along the Bering Sea Coast and inland
up the river approximately 250 mi, and the Athabaskan Indians
who occupy the remainder of the basin.
The Canada segment of the Yukon River Basin includes
parts of two Canadian National Parks, Vuntut and Kluane (fig. 7),
in addition to several Habitat Protection Areas. Atlin Provincial
Park is located near the headwaters of the Yukon River. These
lands compose about 9 percent of the land area of the Canadian
Yukon. In the Alaska part of the Yukon River Basin, about 68 per-
cent of the land is owned by the Federal government. Four national
parks cover 10 percent of the area, 8 wildlife refuges cover 32 per-
cent of the area, and Bureau of Land Management (BLM) land
covers 22 percent (fig. 7). The U.S. military and Native corpora-
tions each own approximately 1 percent of the land.
The Yukon River at Dawson, Yukon Territory. At this point the
river is 1,000 feet wide. Today, the population of Dawson is
about 2,000, but at the height of the Klondike Gold Rush, the
population was 25,000.

Description and History of the Yukon River Basin 13
Figure 7. Land ownership of the Yukon River Basin.
0
0
100
100
200
200
300 KILOMETERS
300 MILES
Vuntut
National Park
Arctic NWR
Yukon Flats NWR
Gates of the Arctic
National Park and Preserve
Kanuti
NWR
Koyukuk
NWR
Nowitna
NWR
Innoko
NWR
Yukon Delta NWR
Denali
National
Park and
Preserve
Yukon-Charley Rivers National Preserve
Teslin NWR
Wrangell-St.Elias National Park and Preserve
Kluane National Park
Atlin Provincial Park
National and Provincial Parks and Preserves
National Wildlife Refuges (NWR)
BLM/Habitat Protection Area
Military
Native Patent
Native Selected
LAND OWNERSHIP

14 Environmental and Hydrologic Overview of the Yukon River Basin, Alaska and Canada
Economic Activity
To a large extent in Alaska, and to a smaller extent in Can-
ada, nearly all the people who reside in the Yukon River Basin vil-
lages are dependent to varying degrees on fish and game resources
for their livelihood (Holder and Senecal-Albrecht, 1998). Subsis-
tence salmon fishing is commonly undertaken by extended family
groups of two or more households cooperating to harvest, cut, pre-
serve, and store salmon for personal use. Many people who fish for
subsistence salmon also fish commercially. The development of
the commercial export salmon fishery has enabled many area res-
idents to obtain a cash income. In many cases, the cash income
provides a means for fishermen to maintain a subsistence life-
style. Income from commercial fishing is commonly used to
obtain hunting and fishing gear used for subsistence activities.
Thus, in many of these villages, the commercial and subsistence
sectors of the economy are complementary and mutually sup-
ported. Households have been required to convert to a cash-ori-
ented economy because payments for mortgages, water, sewer,
electric, telephone, and groceries require cash. Yet, even the most
modern villages have remained subsistence-based because of the
intrinsic value of subsistence activities and because local renew-
able resources form the most reliable base of the economy from
year to year.
Two commercial fishing seasons in the Yukon River Basin
are the summer season, which targets chinook and summer chum
salmon, and the fall season, which targets fall chum salmon with
an incidental harvest of coho salmon. Yukon River salmon stocks
have generally remained healthy, primarily because their spawn-
ing, rearing, and migration habitat remain undisturbed. However,
in 1997 and 1998, runs of the chum salmon in the Yukon River
Basin declined sharply (table 1) and many of the villages suffered
from the effects. Not only have commercial fisherman taken huge
Table 1. Comparison of salmon harvests for various time periods,
Yukon River Basin, Alaska
[Data from Holder and Senecal-Albrecht, 1998; --, data not available]
Year Subsistence Commercial Sport Total
Chinook salmon
1961-86 average 24,452 109,401 753 134,606
1987-91 average 49,634 109,302 763 159,699
1992-96 average 51,669 110,276 2,017 163,962
1997 66,278 121,732 1,913 189,923
1998 53,733 43,699 779 98,211
Summer chum salmon
1961-86 average 192,003 466,459 672 659,134
1987-91 average 155,754 978,726 1,105 1,135,585
1992-96 average 117,529 491,610 1,050 610,189
1997 97,109 230,842 475 328,426
1998 86,004 28,798 488 115, 290
Fall chum salmon
1961-86 average 106,897 182,251 -- 289,148
1987-91 average 210,392 173,539 -- 383,931
1992-96 average 113,673 84,408 -- 198,081
1997 102,937 67,122 -- 170,059
1998 62,867 0 -- 62,867
Coho salmon
1961-86 average 17,199 21,292 405 38,896
1987-91 average 55,517 68,399 2,049 125,965
1992-96 average 34,288 23,724 1,521 59,533
1997 24,593 35,820 1,470 61,883
1998 12,904 0 951 13,855

Description and History of the Yukon River Basin 15
losses (with a corresponding effect on local businesses), but many
villages that depend on salmon as a main staple of their diet now
find them in short supply.
Mining activity was, and remains, an important economic
industry within the basin (table 2). Most historical mining activity
occurred on localized, discrete, headwater streams using manual
labor which helped to minimize impacts on salmon spawning hab-
itat. Mining operations have to cope with short operating seasons,
difficult transportation conditions, and high freight and labor
costs. Both small and large mining operations exist today. Rigid
enforcement of environmental regulations since the mid-1980’s
has resulted in mining operations that are less detrimental to fish
habitat than in the past. In 1999, two large hard-rock mines were
operating: the Illinois Creek mine in the Upper Innoko drainage
near Galena and the Fort Knox mine near Fairbanks. A third site,
the Pogo Mine, was being assessed for development in the Good-
paster River Basin (fig. 5A) near Big Delta.
Another natural resource activity in the Yukon River Basin is
logging. Although not as large an industry as fishing or mining,
logging could increase as large tracts of Federal land are trans-
ferred into Native corporations and State ownership, and both
local and export timber demands increase. Primary areas of log-
ging are the Tanana River Basin (Alaska) and the southeastern part
of the Yukon Territory near Teslin.
Other economic activities complement the natural resource
activities in the Yukon River Basin. These include tourism in both
Alaska and Canada, government, and service industries. The U.S.
military also has a strong presence in Alaska with two Army res-
ervations and one Air Force base. During the Cold War, the mili-
tary also operated several radar sites along the Yukon River at Fort
Yukon and Galena.
Table 2. Watersheds where mining has occurred in the
Yukon River Basin
Watershed
Nearest village or town
(fig. 5B)
American Creek Tanana
Beaver Creek Fort Yukon
Birch Creek Fort Yukon
Chatanika River Fairbanks
Chena River Fairbanks
Coal Creek Circle
Eureka Creek Nenana
Fortymile River Eagle
Goldstream Creek Fairbanks
Hogatza River Alatna
Iditarod River Shageluk
Innoko River Shageluk
Livengood Creek Livengood
Middle Fork Koyukuk River Wiseman
Minook Creek Rampart
Nome Creek Livengood
South Fork Koyukuk River Wiseman
Sulatna Creek Ruby
Woodchopper Creek Circle
16 Environmental and Hydrologic Overview of the Yukon River Basin, Alaska and Canada
ENVIRONMENTAL CHARACTERISTICS OF THE
YUKON RIVER BASIN
Physiography
The purpose of physiographic classification is to divide an
area into smaller regions that are topographically distinct from sur-
rounding regions. Thus, the boundaries of the physiographic
regions are typically drawn where the topography changes in char-
acter. Physiographic divisions of the Yukon River Basin for
Alaska were classified by Wahrhaftig (1965) and for Canada by
Bostock (1970). Five general physiographic regions are present in
the Yukon River Basin (fig. 8): (1) rolling topography and gentle
slopes, 37 percent; (2) low mountains, generally rolling, 24 per-
cent; (3) plains and lowlands, 20 percent; (4) moderately high rug-
ged mountains, 17 percent; and (5) extremely high rugged
mountains, 2 percent. The following specific descriptions are
modified from Wahrhaftig (1965) and can be inferred from the
digital elevation map of the Yukon River Basin (fig. 2).
Alaska Range (Central and Eastern Part)—The central
and eastern part of the Alaska Range consists of two or three par-
allel rugged glaciated ridges, 6,000-9,000 ft in altitude, sur-
mounted by groups of extremely rugged snow-capped mountains
more than 9,500 ft in altitude. Mount McKinley, 20,320 ft high and
the highest mountain in North America, is located in this part of
the Alaska Range. Most of the rivers and streams flow into the
Tanana River. Rivers are swift and braided, and most rivers head
in glaciers. The high mountains are sheathed in ice, and valley gla-
ciers as much as 40 mi long and 5 mi wide radiate from them.
Central and Eastern Brooks Range—The Central and
Eastern Brooks Range is a wilderness of rugged glaciated east-
trending ridges that rise to summits 7,000-8,000 ft in altitude in the
northern part and 4,000-6,000 ft in altitude in the southern part.
The eastern part of the range has belts of hard and soft sedimentary
and volcanic rocks. The mountains have cliff-and-bench slopes
characteristic of glacially eroded bedded rocks. Major rivers flow
southward to the Yukon and Koyukuk Rivers in flat-floored glaci-
ated valleys ranging from 0.5 to 2 mi in width. Small cirque gla-
ciers are common in the higher parts of the range.
Indian River Uplands—This region consists of groups of
low gentle ridges having rounded accordant summits at 1,500-
2,000 ft altitude interspersed with irregular lowlands and broad
flat divides. A few mountains rise to 4,000 ft in altitude. The
Koyukuk and Kanuti Rivers cross the upland in narrow canyons a
few hundred feet deep. Most of the region is drained by the
Koyukuk River and its tributaries. Numerous thaw lakes are in the
lowlands, valleys, and broad passes. Although there are no gla-
ciers, the entire land area is underlain by permafrost.
Innoko Lowlands—The Innoko Lowlands are a group of
flat flood plains, dendritic in pattern, whose bounding slopes are
generally steep banks cut into the surrounding hills. The Yukon
River and a large tributary, the Innoko River, cross the lowlands.
The main part of the lowlands has a complex intersecting network
of meandering sloughs of these two streams. Oxbow and meander-
scroll lakes are abundant in recently abandoned flood plains and
partly silted sloughs. Thaw lakes also abound in old flood plains
and on gentle silt-covered slopes.
Kokrine-Hodzana Highlands—This region consists of
even-topped rounded ridges rising to 2,000-4,000 ft in altitude sur-
mounted by isolated areas of more rugged mountains. A rugged
compact highland in the northeastern part has many peaks between
4,500 and 5,700 ft in altitude. The irregular drainage divide
between the Yukon River and its large tributary, the Koyukuk
River, passes through these highlands. Drainage to the Yukon

Physiography 17
0
0
100
100
200
200
300 KILOMETERS
300 MILES
Figure 8. Physiographic regions of the Yukon River Basin (modified from Wahrhaftig, 1965 and Bostock, 1970).
Rolling topography and gentle slopes
Low mountains, generally rolling
Plains and lowlands
Moderately high rugged mountains
Extremely high rugged mountains
Central & Eastern Brooks Range
Porcupine Plateau
Ogilvie Mountains
Wrangell-St.Elias Mountains
Northern Foothills-Alaska Range
Alaska Range
Yukon-Tanana Upland
Yukon Flats
Kokrine-Hodzana Highlands
Indian River Uplands
Tanana-Kuskokwim Lowland
Nowitna Lowland
Tozitna-Melozitna
Lowland
Innoko
Lowlands
Yukon-Kuskokwim
Coastal Lowland
Nulato Hills
Koyukuk Flats
PHYSIOGRAPHIC REGIONS
18 Environmental and Hydrologic Overview of the Yukon River Basin, Alaska and Canada
River is by way of the Hodzana, Tozitna, Melozitna, and Dall Riv-
ers and many shorter streams. Drainage to the Koyukuk River is
by the Kanuti River and the South Fork Koyukuk River.
Koyukuk Flats—The Koyukuk Flats form an extensive
lowland of irregular outline at the junction of the Yukon and
Koyukuk Rivers. The central part of the Koyukuk Flats are flat
plains 5-20 mi wide, along the major rivers. The parts immediately
adjacent to the rivers are meander belts 5-10 mi wide and the parts
farther away are dotted by thaw lakes. Broad rolling silt plains
stand 100-200 ft above these central plains and merge with the sur-
rounding uplands. The Flats are drained by the Yukon River.
Northern Foothills of the Alaska Range—The topography
of this region consists of flat-topped east-trending ridges 2,000-
4,500 ft in altitude, 3-7 mi wide, and 5-20 mi long that are sepa-
rated by rolling lowlands 700-1,500 ft in altitude and 2-10 mi
wide. All rivers and streams in this region flow into the Tanana
River. No glaciers are present in this region.
Nowitna Lowland—The Nowitna Lowland is a rolling silt-
covered tableland ranging from 250-900 ft in altitude and having
a local relief of 50-250 ft and slopes of 100-150 ft/mi into which
flat flood plains of the major rivers have been incised 150-300 ft.
The entire lowland is drained by the Yukon River, which follows
the northern boundary. The confluence of the Yukon River with
the Tanana River is in the eastern part of the lowland. The southern
part of the lowland is drained by the Nowitna River, a tributary of
the Yukon River.
Nulato Hills—The Nulato Hills consist of northeast-trend-
ing even-crested ridges, 1,000-2,000 ft in altitude, having gentle
slopes. Valleys are narrow and have flat floors that are generally
trenched in their upstream parts to depths of about 30 ft. Streams
flow to the Yukon River.
Ogilvie Mountains—The Ogilvie Mountains have steep
slopes and deep narrow valleys. Mountain peaks rise to 5,000 ft in
altitude, and local relief is as much as 4,000 ft. The ridges are inter-
connected and passes are few. The narrow valleys are interrupted
by gorges where rivers cross cliff-forming layers of rock. The
major river drainages are the Kandik, Nation, and Tatonduk Riv-
ers, all tributaries of the Yukon River. No glaciers are present, but
most of this region is underlain by permafrost.
Porcupine Plateau—The Porcupine Plateau is dominated
by low ridges having gentle slopes and rounded to flat summits
1,500-2,500 ft in altitude. A few mountains rise to 3,500 ft. Valley
floors are broad and valley patterns are irregular. The Chandalar,
Sheenjek, and Coleen Rivers rise in the Brooks Range and flow
southward across the plateau in broad valley floors with moraines
and outwash terraces. The Porcupine River crosses the plateau in
a narrow cliff-lined canyon 50-500 ft deep. The Black and Little
Black Rivers, which drain the southeastern part of the area, mean-
der through broad irregular flats. The Porcupine Plateau has no
glaciers, but the entire area is underlain by continuous permafrost.
Tanana-Kuskokwim Lowland—This lowland is a broad
depression bordering the Alaska Range on the north. The central
and eastern parts of the lowland are drained by the Tanana River.
Braided glacial streams rising in the Alaska Range flow northward
across the lowland. Thaw lakes are present in areas of fine allu-
vium and the entire area consists of permafrost.
Tozitna-Melozitna Lowland—This long narrow rolling
plain, 5-10 mi wide, is drained by the Tozitna and Melozitna Riv-
ers. These two rivers flow southward from the lowland in narrow
gorges across the Kokrine-Hodzana Highlands to the Yukon River.
The lowland contains numerous thaw and oxbow lakes. Discontin-
uous areas of permafrost are present.
Physiography 19
Wrangell–St. Elias Mountains—The Wrangell Mountains
are an oval group of shield and composite volcanoes that rise
above a low plain on the north and west and above heavily glaci-
ated cliffed and castellated ridges on the south and east. About 25
percent of the region drains into the Tanana River by way of the
Nabesna and Chisana Rivers and into the Yukon River by way of
the White River. The St. Elias Mountains are probably the most
spectacular mountains of North America. Massive isolated block-
like mountains 14,000-19,000 ft in altitude rise at intervals of 5-30
mi from a network of narrow ridges and sharp peaks. The average
altitude of icefields in the interconnected valley system is 3,000-
7,000 ft. Local relief is extreme and jagged cliffs abound.
Yukon Flats—The Yukon Flats region consists of marshy
lake-dotted flats rising from 300 ft in altitude on the west to 600-
900 ft on the north and east. The northern part of the flats is made
up of gently sloping outwash fans of the Chandalar, Christian, and
Sheenjek Rivers. The southeastern part of the flats is the broad
gentle outwash fan of the Yukon River. Other areas are flat flood
plains. Rolling silt and gravel-covered marginal terraces having
sharp escarpments 150-600 ft high rise above the flats and slope
gradually up to altitudes of about 1,500 ft at the base of surround-
ing uplands and mountains. The region is drained by the Yukon
River, which has a braided course southeast of the bend at Fort
Yukon and a meandering course, containing many sloughs, south-
west of the bend at Fort Yukon. Most tributaries rise in surround-
ing uplands and mountains and have meandering courses through
the flats.
Yukon-Kuskokwim Coastal Lowland—The Yukon-
Kuskokwim Coastal Lowland is a triangular lake-dotted marshy
plain rising from sea level on its west margin to 100-300 ft at its
east end. Low beach ridges, marked by lines of thaw lakes, lie
along part of the west coast. The lowland is crossed by meandering
streams of extremely low gradient, many of them distributaries or
former channels of the Yukon River. The Yukon River flows along
the base of hills on the north side of the lowland and is building a
delta into the Bering Sea. This region is dotted with innumerable
thaw lakes, many of them 10 or more miles long. Probably 30-50
percent of the lowland is lake surface.
Yukon-Tanana Upland—The Yukon-Tanana Upland is
characterized by rounded even-topped ridges. In the western part,
these rounded ridges trend northwestward to eastward and have
altitudes of 1,500-3,000 ft. The ridges are surmounted by compact
rugged mountains 4,000-5,000 ft in altitude. Ridges in the eastern
part have no preferred direction, are 3,000-5,000 ft in altitude and
rise 1,500-3,000 ft above adjacent valleys. Valleys in the western
part are generally flat, alluvium floored, and 0.25-0.50 mi wide to
within a few miles of headwaters. Streams in the eastern part that
drain to the Yukon River flow in narrow V-shaped terraced can-
yons. Streams flow southward to the Tanana River or northward to
the Yukon River. No glaciers are in the region, but the entire sec-
tion is underlain by discontinuous permafrost.

20 Environmental and Hydrologic Overview of the Yukon River Basin, Alaska and Canada
Climate
The Yukon River Basin has a variable climate because of its
large size and range in altitude of the land surface. Climate zones
have been broadly defined primarily by variations in precipitation
and temperature (Searby, 1968; Hartman and Johnson, 1978).
With the exception of the Yukon River Delta, the Yukon River
Basin lies in the continental zone. Temperature extremes are
greater in this zone than in the other climatic zones. Air tempera-
tures average about 22 °F. The Yukon Delta is located in the tran-
sition zone. Temperature in this zone averages about 27 °F, slightly
higher than that in the continental zone.
Precipitation in the Yukon River Basin ranges from 10 to 130
in. annually (fig. 9). Averaged over the entire basin, the annual pre-
cipitation is approximately 19 in. The amount of precipitation is
directly related to topography: high rugged mountains receive the
greatest amounts of precipitation and lowland areas receive the
least. About half of the precipitation falls as snow from November
through March. Snow may fall year-round in the high mountains,
where much of it is stored for long periods in glaciers and ice-
fields.
The climate in the Yukon River basin has been undergoing
significant long-term change. Tree-ring studies and 20
th
century
weather records indicate that the temperatures at Fairbanks and in
the surrounding area of Interior Alaska have been warming
steadily since about 1840, with a brief interruption of this trend
from about the mid 1940’s to the mid 1970’s (Juday and others,
1998). During the period 1949–96, the rate of warming has been
about 0.4 °F per 100 years. This warming also manifests itself as
an increase in the length of the growing season and in earlier onset
of snowmelt and “break up” of the ice cover on the rivers. Precip-
itation at Fairbanks has been generally decreasing during the 81
years from 1906–96 at a rate of about 1 in. per 100 years. Glaciers
are receding as a result of both warmer temperatures and locally
decreased precipitation. The 30-year record for Gulkana Glacier in
the Alaska Range indicates that ablation has exceeded precipita-
tion for 27 out of the past 32 years. Although other long-term
records are not available for the Yukon River Basin, Gulkana Gla-
cier is commonly thought to be representative of other glaciers in
the basin.
View of a valley glacier. Extensive systems of valley glaciers
are present in the Alaska Range and the Wrangell–St. Elias
Mountains. Although glaciers compose only one percent of
the Yukon River Basin, they have significant effects on the
runoff characteristics.

Climate 21
0
0
100
100
200
200
300 KILOMETERS
300 MILES
Figure 9. Precipitation regions in the Yukon River Basin (from Jones and Fahl, 1994).
Less than 10 inches per year
10-15
15-20
20-30
30-50
Greater than 50
PRECIPITATION REGIONS
Newtok
Saint Marys
Pilot Station
Russian Mission
Holy Cross
Grayling
Shageluk
Kaltag
Koyukuk
Ruby
Huslia
Hughes
Alatna
Bettles
Anaktuvuk Pass
Wiseman
Tanana
Rampart
Minto
Fairbanks
Nenana
Cantwell
Healy
Delta Junction
Dot Lake
Eagle
Dawson
Northway Junction
Beaver Creek
Destruction Bay
Stewart Crossing
Pelly Crossing
Faro
Carmacks
Whitehorse
Carcross
Teslin
Ross River
Mayo
Central
Circle
Birch Creek
Fort Yukon
Venetie
Arctic Village
Old Crow
Hooper
Bay
Chevak
Anvik
Kotlik
Alakanuk
Galena
Nulato
Allakaket
Beaver
Stevens
Village
Livengood
Manley Hot
Springs
North Pole
Two Rivers
Big Delta
Tok
Boundary
Burwash Landing
Mountain
Village
Tanacross
Fortymile
Ohogamiut
22 Environmental and Hydrologic Overview of the Yukon River Basin, Alaska and Canada
Geology
Water-quality characteristics of surface water and ground
water are strongly affected by surficial and bedrock geology. The
geology of the Yukon River Basin is complex and the interpreta-
tion of the geology is based on the concept that the Yukon River
Basin is a mosaic of geologic terranes (Silberling and others, 1994;
Gordey and Makepeace, 1999). A terrane is a body of rock of
regional extent that is bounded by faults, and whose geologic his-
tory is different from that of adjacent terranes. The terranes in the
Yukon River Basin represent blocks of the Earth’s crust that have
moved large or small distances relative to each other. The pattern
of terranes in the Yukon River Basin reflects the interactions of
oceanic crustal plates with the North American plate; large-scale
lateral and rotational movements, rifting, and volcanic activity
result from these interactions.
Because of the size of the Yukon River Basin and the com-
plexity of its geology, the following description is limited to the
rock type. The rocks range in age from Precambrian to Holocene
and consist of both unconsolidated deposits and consolidated
rocks (fig. 10). Major deposits are described in the following sec-
tion (see figure 8 for locations of physiographic regions).
Cenozoic unconsolidated deposits are present in lowland
areas of the Yukon River Basin. The most prominent areas are the
upper Porcupine River, the Yukon Flats, the Tanana-Kuskokwim
Lowland, the Nowitna Lowland, the Tozitna-Melozitna Lowland,
the Innoko Lowlands, and the Yukon Delta. The deposits are con-
sidered thick accumulations and consist primarily of alluvium but
also include glacial deposits and locally include eolian and beach
deposits. In the Yukon Delta area, deltaic and marine deposits of
Quaternary age are included in this map category.
Cenozoic sedimentary rocks are found in the foothills of
the Alaska Range and near Eagle. These rocks are composed pri-
marily of sandstone, siltstone, and shale, but also contain coal,
mudstone, and conglomerate.
Cenozoic volcanic rocks ranging in composition from rhy-
olite to basalt are found in the foothills of the Wrangell–St. Elias
Mountains, in the lower part of the Yukon River near Holy Cross,
and in scattered locations in the Koyukuk River Basin.
Cenozoic intrusive rocks ranging in composition from
granite to quartz are found in the southeastern part of the Yukon
River Basin near the base of the Wrangell–St. Elias Mountains and
the Coast Mountains.
Mesozoic sedimentary rocks are found mainly in the south-
eastern part of the Yukon River Basin, the upper Porcupine River
Basin, the Indian River Upland, and the Nulato Hills. These rocks
are mostly shale, siltstone, and sandstone, but locally include lime-
stone and large deposits of coal.
Mesozoic volcanic rocks crop out in scattered areas of the
Yukon River Basin. Most of these rocks are found in the western
part of the basin near the Yukon Flats and Koyukuk Flats. Compo-
sition of the rocks ranges from andesite to basalt.

Geology 23
GEOLOGY
Figure 10. Geology of the Yukon River Basin (modified from Silbering and others, 1994; Gordey and Makepeace, 1999).
0
0
100
100
200
200
300 KILOMETERS
300 MILES
Glaciers
Water
Cenozoic unconsolidated
Cenozoic sedimentary
Cenozoic volcanic
Cenozoic intrusive
Mesozoic sedimentary
Mesozoic volcanic
Mesozoic intrusive
Paleozoic sedimentary
Paleozoic metamorphic
Paleozoic volcanic
Paleozoic intrusive
Precambrian
24 Environmental and Hydrologic Overview of the Yukon River Basin, Alaska and Canada
Mesozoic intrusive rocks are present primarily in the south-
ern part of the Yukon River Basin in British Columbia, the Yukon-
Tanana Upland, and the Kokrine-Hodzana Highlands. These rocks
are mostly in upland and mountainous areas and range in compo-
sition from granite to gabbro.
Paleozoic sedimentary rocks are present throughout the
Yukon River Basin. These rocks are found in the eastern part of the
basin in the Selwyn Mountains, along the northern flanks of the
Brooks Range, in the eastern part of the Porcupine River Basin,
and in the Innoko Lowlands. Composition of the rocks is mostly
limestone, shale, siltstone, and sandstone, but can include beds of
conglomerate, dolomite, and chert.
Paleozoic metamorphic rocks are prominent in the Yukon-
Tanana Upland. These rocks are primarily gneiss, schist, phyllite,
and quartzite, but locally include argillite, marble, and several
kinds of metasedimentary rocks.
Paleozoic volcanic rocks are scattered throughout the
Yukon River Basin in small isolated areas near the Alaska/Canada
border. Larger areas are found in the southeastern part of the basin.
These volcanic rocks consist of sandstone, basalt, rhyolite, and
chert.
Paleozoic intrusive rocks are found near the Porcupine
River near the Alaska/Canada border. These rocks of various kinds
are faulted against lower Paleozoic and Precambrian metamorphic
rocks.
Precambrian rocks are found primarily in the eastern and
central part of the Yukon River Basin. Rocks consist of phyllite,
slate, and siltstone.

Land Cover 25
Land Cover
Land cover influences a number of hydrologic factors, such
as snow accumulation, soil moisture depletion, surface runoff,
infiltration, and erosion. These factors, in turn, can affect the water
quality of a particular stream or river. For example, certain types
of vegetation can prevent erosion, thus reducing the quantity of
sediment that enters a stream. Also, the composition of certain
types of vegetation will in turn affect the chemistry of the water
quality.
Land cover also has a direct influence on the permafrost
because of the thermal properties that determine the quantity of
heat entering and leaving the underlying ground in which the per-
mafrost exists. Vegetation exerts an indirect influence on perma-
frost by affecting climatic and other terrain features, which in turn
have a direct influence on the permafrost. These direct and indirect
influences vary with time and space.
A land classification system developed by the Alaska
Geospatial Data Clearinghouse (1998), describes eight types of
land cover, six of which compose about 90 percent of the Yukon
River Basin (table 3; fig. 11): needleleaf forest, tall and low shrub-
lands, broadleaf forest, lichens, barren, and wet herbaceous. The
other two, dwarf shrublands and dry herbaceous, compose about 7
percent of the basin. The remaining land cover is mainly ice, snow,
and water. Specific descriptions of these land covers are taken
from Talbot and Markon (1988).
Needleleaf forest (53.5 percent)—These areas are com-
posed of two subclasses, closed needleleaf forest and open needle-
leaf forest. Closed needleleaf forests are dominated by white
spruce on well-drained sites and along drainages, or black spruce
on lowland sites. The tree canopy ranges from 60 to 100 percent.
Open needleleaf forests are similar to the closed needleleaf forest
except that the tree canopy ranges from 25 to 59 percent.
Table 3. Types and areas of land cover in the
Yukon River Basin
[Data from Alaska Geospatial Data Clearinghouse, 1998]
Type of land cover
(fig. 11)
Area
Square miles Percent
Needleleaf forest 176,970 53.5
Tall and low shrublands 29,004 8.8
Broadleaf forest 28,627 8.6
Lichens 20,923 6.3
Barren 20,452 6.2
Wet herbaceous 19,960 6.0
Dwarf shrublands 12,875 3.9
Dry herbaceous 10,517 3.2
Ice and snow 9,211 2.8
Water 1,498 <1
Other 765 <1
Total 331,000 100

26 Environmental and Hydrologic Overview of the Yukon River Basin, Alaska and Canada
0
0
100
100
200
200
300 KILOMETERS
300 MILES
Needleleaf Forest
Tall & Low Shrublands
Broadleaf Forest
Lichens
Barren
Wet Herbaceous
Dwarf Shrublands
Dry Herbaceous
Ice/Snow
Rivers, streams & lakes
Figure 11. Land cover classes of the Yukon River Basin (from Alaska Geospatial Data Clearinghouse, 1998).
LAND COVER
Land Cover 27
Tall and low shrubland (8.8 percent)—These areas are
composed of two subclasses, closed and open. Closed tall and low
shrubland occurs primarily on upper hillslopes; mid-mountain
slopes; or along rivers, streams, and small wet or waterlogged
basins. It may also be found on mid- to higher altitude slopes. The
shrub canopy is 75 percent or greater with heights ranging from 8
to 59 in. Alders and willows are the more common species present.
Open tall and low shrubland is similar to the closed tall and low
shrubland except that the shrub cover is generally less than 75 per-
cent. Stands of open alder or small clumps of willow may be found
on a variety of mountains and altitudes, on upper slopes of rounded
hills, and on steep mid-slopes of hills.
Broadleaf forest (8.6 percent)—Similar to needleleaf for-
ests and to tall and low shrubland, the two subclasses of broadleaf
forest are closed and open. Closed broadleaf forests have tree can-
opies ranging from 60 to 100 percent. The primary tree species are
white birch found on both hillsides and alluvial sites, and balsam
found only on alluvial sites. Open broadleaf forests have tree can-
opies ranging from 25 to 59 percent and are composed of the same
tree species as the closed broadleaf forests.
Lichens (6.3 percent)—These areas are common in the
Yukon River Basin, some of which cover extensive areas, and
most of which are associated with a number of low and dwarf
shrubs.
Barren (6.2 percent)—These areas consist primarily of
sand, gravel, rocks, and boulders of various sizes often associated
with active flood plains, hill summits, and mountain tops. Vascular
plant cover is normally less than 5 percent. However, varying
amounts of lichens may be present.
Wet herbaceous (6.0 percent)—These areas are similar to
grasslands but are generally found in areas containing soils that are
moist to saturated throughout the season. They are found primarily
in low basins, tidal areas, and tundra areas where water has been
impounded.
Dwarf Shrublands (3.9 percent)—These areas generally
have few plants greater than 8 in. high and are dominated by dwarf
birch. Lichens may also be present in mountainous and lowland
areas.
Dry Herbaceous (3.2 percent)—These areas are dominated
by sedges, normally with greater than 60 percent cover. Most areas
have other grass or grass-like plants as well as scattered shrubs.
Mosses and lichens may also be present in varying amounts.

28 Environmental and Hydrologic Overview of the Yukon River Basin, Alaska and Canada
Soils
The formation of soils depends primarily on five factors:
type of parent material, climate, relief or topography, living organ-
isms, and time (Singer and Munns, 1987). The type of soil depends
on which factor is the most dominant. In the Yukon River Basin,
type of material, climate, and relief have been the most dominant
factors in the development of soils. Soil type can affect water qual-
ity as precipitation infiltrates the soil, reacts with the minerals that
are present, and then discharges into a stream. Soil type and distri-
bution are also factors that affect the amount of soil erosion.
In the soil taxonomy of the U.S. Department of Agriculture
(1975), soils are grouped at six levels or categories. The two
broadest categories are the order, followed by the more narrowly
defined category, the suborder. Of a possible 12 soil orders, 5 soil
orders are found in the Yukon River Basin: Entisols, Gelisols,
Inceptisols, Mollisols, and Spodosols (fig. 12). Gelisols are a
recently developed new classification for permafrost soils (Joe
Moore, National Resources Conservation Service, 1999). In addi-
tion, one other area, rough mountainous lands, is not classified
as an order because it is largely unvegetated (Rieger and others,
1979).
Entisols—These are recently formed soils with little soil
horizon development and are found in areas of glacial outwash or
alluvium. Suborders and soils of Entisols found in the Yukon River
Basin are:
• Orthents Suborder
Lithic Cryorthents—Soils with texture finer than loamy
fine sand. There is no stratification of the soil and bedrock
is less than 20 in. from the top of the surface.
Typic Cryorthents—Soils that are thicker than 20 in. over
bedrock and have a mean annual temperature above freez-
ing. They have a wide range in texture and their colors are
dominantly gray. The parent material is loess blown from
the braided beds of rivers that have a heavy silt load.
Pergelic Cryorthents—Soils with mean annual tempera-
tures below freezing and with no bedrock within 20 in. The
soil is gravelly and has rapid internal drainage. The perma-
frost is commonly many feet deep.
Pergelic Ruptic-Histic Cryorthents—Soils that have been
subject to frost-stirring processes to the extent that much of
the surface is barren or covered only with lichens or a few
tundra plants. Commonly, these soils have polygonal sur-
face patterns and thick organic mats.
• Fluvents Suborder
Typic Cryofluvents—Soils with alternating layers of sand
and silt loam. Many are underlain by a thick deposit of
water and sand. Color is typically gray.
Gelisols—These are soils that have permafrost within about
40 in. of the soil surface and (or) have gelic materials within about
40 in. of the soil surface and have permafrost within about 80 in.
Gelic materials are mineral or organic soil materials that have evi-
dence of frost churning in the active layer (seasonal thaw layer)
and (or) in the upper part of the permafrost. Suborders and soils
are:

Soils 29
Entisols (Regosols)
Gelisols (Cryosols)
Inceptisols (Brunisols)
Inceptisols/Gelisols
Mollisols
Spodosols (Podzols)
SOILS
Figure 12. Soils of the Yukon River Basin.
Rough Mountainous Land
0
0
100
100
200
200
300 KILOMETERS
300 MILES

30 Environmental and Hydrologic Overview of the Yukon River Basin, Alaska and Canada
• Histels Suborder
Pergelic Cryofibrists—Organic soils that have mean
annual soil temperatures below freezing. The permafrost
table is commonly less than 30 in. deep in these soils. The
soils are composed of peat and the thickness of the peat
ranges from 16 in. to more than 10 ft.
Histic Pergelic Cryaquepts—These soils have thick accu-
mulations of organic matter on the soil surface, commonly
in the form of a mat of slightly or partly decomposed
mosses, sedges, and associated plants. Because the mat is
effective insulation against summer heat, the permafrost
table in these soils is normally very shallow. The upper part
of the soils that thaws each summer and refreezes during
the winter, known as the active layer, is almost constantly
saturated during the thaw period.
Pergelic Cryochrepts—Soils with mean annual tempera-
tures below freezing, and a deep permafrost table. These
soils are gravelly.
Pergelic Cryaquepts—Soils that have many characteristics
in common with the Histic Pergelic Cryaquepts, but they
normally have somewhat longer periods during which the
soil is not completely saturated. They are commonly found
on alluvial plains, glacial moraines, or outcrops of coarse-
grained rocks.
Inceptisols—These are recently formed soils but, in contrast
to Entisols, have a greater degree of soil horizon development than
the Entisols. At the present time, some Inceptisols (Andic Cryo-
chrepts, Typic Cryochrepts) have some characteristics of Gelisols
and are classified as “Inceptisols/Gelisols.” Predominant subor-
ders and soils are:
• Ochrepts Suborder
Aquic Cryochrepts—Poorly drained, weakly developed
non-permafrost soils. Commonly, the restricted drainage is
only during spring breakup, when seasonal frost perches
meltwater near the soil surface.
Typic Cryochrepts—Soils that are nonacid—that is, they
have the capacity to hold mineral elements. Most of these
soils have silt loam or loam texture although some are grav-
elly.
• Aquepts Suborder
Pergelic Cryaquepts—Soils that have permafrost at some
depth, but do not have thick peaty accumulations on the
surface.
Typic Cryaquepts—Gray or olive-gray soils with a high
water table during most or all of the summer. They have a
wide variety of texture, but are never made up completely
of sand or gravelly sand and are not stratified.
• Umbrepts Suborder
Pergelic Cryumbrepts—Soils that have mean annual tem-
peratures below freezing. These soils occur in locations
with good surface drainage, in areas above treeline.
Typic Cryumbrepts— Well-drained soil with brown hori-
zons and mean annual temperatures above freezing. These
soils will support low shrubby vegetation.
Mollisols—These are primarily thick, dark, and soft mineral
soils. In the Yukon River Basin, they occur principally in material
derived from limestone or other basic rock, such as basalt. Subor-
ders of Mollisols that are present are the Borolls. The predominant
soil is Typic Cryoborolls which is a brownish colored, well-
drained soil formed in nonacid material. The only area where this
soil is found in the Yukon River Basin is just north of the Yukon
Flats.

Soils 31
Spodosols—These soils have light-colored surface hori-
zons, and organic and aluminum-rich subsurface horizons. Subor-
ders of Spodosols that are present are the Orthods. The
predominant soil is Typic Cryorthods, which have moderate accu-
mulations of organic carbon in the horizon and no permafrost.
Aluminum and iron are also present in the soil.
The Canadian soil classification system is similar, though
not identical to the U.S. soil classification system. In the Canadian
system, an order is followed by the more narrowly defined cate-
gory, the great group (Agriculture Canada, 1976). Of a possible
nine orders, four are present in the Canadian part of the Yukon
River Basin (similar U.S. classification in parenthesis):
Regosols (Entisols)—These soils either have no horizon
development or have soil horizon development insufficient to be
classified in any of the other orders.
Cryosols (Gelisols)—These mineral or organic soils have
perennially frozen material within 3 ft of the surface in some part
of the soil body. The mean annual soil temperature is less than
32 °F. Their maximum development occurs in organic and poorly
drained, fine textured materials. Three great groups are associated
with this order and are all found in the Yukon River Basin.
Turbic Cryosols—Generally composed of mineral soils
that display marked frost action such as frost heaving, and
generally occurring on patterned ground.
Static Cryosols—Mineral soils without noticeable frost
action.
Organo Cryosols—Organic soils.
Brunisols (Inceptisols)—These soils have horizons that are
sufficiently developed to be excluded from the Regosolic order but
are not sufficiently developed to be classified in other orders. Two
great groups are found in the Yukon River Basin: Dystric
Brunisols, which are soils with horizons less than 2 in. thick con-
sisting of organic matter and minerals, and Eutric Brunisols,
which are soils similar to Dystric Brunisols but not as acidic.
Podzols (Spodosols)—These soils have surface horizons
consisting of organic matter, iron, and aluminum. One of the great
groups, Humo-Ferric Podzolic, is found in the Yukon River Basin.
The upper 4 in. of this soil contains between 0.5 and 5 percent
organic carbon and 0.6 percent or more extractable aluminum and
iron.
View of the Interior Bottomlands ecoregion, which is com-
posed of flat to nearly flat bottomlands along large rivers of
the Yukon River Basin. These bottomlands are dotted with
thaw and oxbow lakes.
32 Environmental and Hydrologic Overview of the Yukon River Basin, Alaska and Canada
Permafrost
Permafrost is defined exclusively on the basis of tempera-
ture, not on the presence of ice. A mass of material is considered
to be permafrost if it has a temperature continually at or below 32
°F for 2 or more years (Ferrians, 1965). Permafrost is present to a
large extent in the Yukon River Basin (fig. 13). Ferrians (1965) and
Brown and others (1997), designated six regions of permafrost in
the Yukon River Basin (fig. 13): (1) generally underlain by contin-
uous permafrost—16 percent, (2) generally underlain by discon-
tinuous permafrost—40 percent, (3) generally underlain by
moderately thick to thin permafrost (50 to 600 ft)—24 percent, (4)
underlain by discontinuous permafrost—6 percent, (5) generally
underlain by numerous isolated masses of permafrost—5 percent,
and (6) sporadic masses of permafrost—9 percent. Because ther-
mal data for permafrost regions in Alaska and Canada are limited,
some of the regions are combined into one.
Permafrost has a very low permeability and commonly acts
as a barrier to infiltration and as a confining layer to aquifers.
Because it is a barrier to infiltration, permafrost increases the like-
lihood of flash floods in streams draining permafrost areas. This
tendency for rapid runoff is partly offset by the common presence
of an organic mat, which can retard runoff briefly. Once the
organic mat is saturated, however, floods occur very quickly.
Even in the zone of continuous permafrost, ground water can
find paths through "taliks," or unfrozen zones in the permafrost.
Taliks commonly occur under large lakes, under large rivers, and
in areas where warm summer streamflow infiltrates into coarse
alluvium. Taliks can also advect large amounts of heat into an
aquifer.
If permafrost melts, the upper layers of soil become drier and
well aerated. Even if permafrost remains as temperatures increase,
the shallow soils that thaw and freeze each year (the active layer)
thaw more deeply and develop a thicker unsaturated zone. Soil
microbes increasingly oxidize the organic carbon sequestered in
the soils. This increased respiration releases carbon, in the form of
dissolved carbon, into a stream and the atmosphere. Changes in
dissolved organic carbon (DOC) could affect stream aquatic com-
munities at all trophic levels that rely on DOC as a food source.
The melting of the permafrost may increase recharge of aqui-
fers, thus increasing base flow in streams. By increasing summer
recharge, melting of permafrost will also decrease summer peak
flows. Wetlands, which occupy about 30 percent of the Yukon
River Basin (fig. 14), could be affected and in turn affect water-
fowl habitat in the Yukon Flats and Yukon Delta areas. Wetlands
are lands transitional between terrestrial and deepwater habitats
where the water table usually is at or near the land surface, or the
land is covered by shallow water (Cowardin and others, 1979).
Another natural factor that can affect permafrost is fire.
Wildfires disturb thousands of acres of land in the Yukon River
Basin each year (fig. 15). Foote (1976) has estimated the natural
fire cycle range from 70 to 130 years. After a fire, the change in
surface conditions results in soil warming and increased active
depths. The soil may become well drained and may no longer have
a perched water table. Thus, the hydrology changes and areas that
were once wetlands become completely drained.

Permafrost 33
Newtok
Saint Marys
Pilot Station
Russian Mission
Holy Cross
Grayling
Shageluk
Kaltag
Koyukuk
Ruby
Huslia
Hughes
Alatna
Bettles
Anaktuvuk Pass
Wiseman
Tanana
Rampart
Minto
Fairbanks
Nenana
Cantwell
Healy
Delta Junction
Dot Lake
Eagle
Dawson
Northway Junction
Beaver Creek
Destruction Bay
Stewart Crossing
Pelly Crossing
Faro
Carmacks
Whitehorse
Carcross
Teslin
Ross River
Mayo
Central
Circle
Birch Creek
Fort Yukon
Venetie
Arctic Village
Old Crow
Hooper
Bay
Chevak
Anvik
Kotlik
Alakanuk
Galena
Nulato
Allakaket
Beaver
Stevens
Village
Livengood
Manley Hot
Springs
North Pole
Two Rivers
Big Delta
Tok
Boundary
Burwash Landing
Figure 13. Permafrost regions of the Yukon River Basin (modified from Ferrians and others, 1965, and Brown and others, 1997).
0
0 100
100
200
200
300 KILOMETERS
300 MILES
Generally underlain by continuous permafrost
Generally underlain by discontinuous permafrost
Generally underlain by moderately thick to thin permafrost
Underlain by discontinuous permafrost
Generally underlain by numerous isolated masses of permafrost
Sporadic masses of permafrost
PERMAFROST REGIONS
Ohogamiut
Mountain
Village
Tanacross
Fortymile

34 Environmental and Hydrologic Overview of the Yukon River Basin, Alaska and Canada
0
0
100
100
200
200
300 KILOMETERS
300 MILES
Wetlands
Lakes, rivers and streams
WETLANDS
Figure 14. Wetland areas of the Yukon River Basin (modified from Fretwell and others, 1996).

Permafrost 35
Figure 15. Areas of forest fires in the Yukon River Basin (from T. Hammond, Bureau of Land Management, 1999, written comm., and Indian and Northern
Affairs Canada, 1999).
0
0100
100
200
200
300 KILOMETERS
300 MILES
1950-1959
1960-1969
1970-1979
1980-1989
1990-1998
FOREST FIRES

36 Environmental and Hydrologic Overview of the Yukon River Basin, Alaska and Canada
Ecoregions
Ecoregions are areas with common ecological settings that
have relatively homogeneous features such as natural vegetation,
geology, mineral availability from soils, physiography, and land
use and land cover (Omernik, 1995). The Yukon River Basin has
been classified into 20 ecoregions (Gallant and others, 1995; Eco-
logical Stratification Working Group, 1995) (table 4; fig. 16). The
Interior Forested Lowlands and Uplands ecoregion and the Inte-
rior Highlands ecoregion are the most dominant ecoregions in the
basin. Descriptions of the ecoregions follow and are taken from
Gallant and others and the Ecological Stratification Working
Group.
Alaska Range—The mountains of south-central Alaska, the
Alaska Range, are very high and steep. This ecoregion is covered
by rocky slopes, icefields, and glaciers. Much of the area is barren
of vegetation. The Alaska Range has a continental climate, but
because of the extreme height of many of the ridges and peaks,
annual precipitation at higher altitudes is similar to that measured
for some ecoregions having maritime climate.
Climate is influenced by the mountains. Weather data for the
region indicate that winter daily low temperatures average about -
12 °F and daily high temperatures about 27 °F at lower altitudes.
Summer daily low temperatures average about 36 °F and daily
high temperatures about 64 °F. Mean annual precipitation in low-
lands is approximately 15 in. and snowfall ranges from 59 to 120
in. Average annual precipitation for the mountain peaks is esti-
mated at 80 in. and snowfall is estimated at 400 in.
The terrain of the ecoregion consists of steep, rugged moun-
tain ridges separated by broad valleys. Altitudes are 2,000 ft in the
lower valleys and commonly rise to greater than 13,000 ft on
mountain peaks. Slope gradients, which are almost always greater
Table 4. Areas of ecoregions in the Yukon River Basin
Ecoregion
(fig. 16)
Area
Square miles Percent
Alaska Range 12,234 3.7
Boreal Mountains and Plateaus 5,931 1.8
Brooks Range 21,128 6.4
Eagle Plains 6,640 2.0
Interior Bottomlands 32,079 9.7
Interior Forested Lowlands & Uplands 70,117 21.2
Interior Highlands 55,957 16.9
Mackenzie Mountains 5,718 1.7
Ogilvie Mountains 12,917 3.9
Old Crow Flats 2,318 0.7
Pelly Mountains 8,240 2.5
Ruby Ranges 5,529 1.7
Selwyn Mountains 9,204 2.8
Subarctic Coastal Plains 11,503 3.5
Wrangell Mountains 9,653 2.9
Yukon Flats 12,897 3.9
Yukon Plateau Central 10,412 3.2
Yukon Plateau North 21,753 6.6
Yukon Southern Lakes 12,807 3.9
Yukon Stikine Highlands 3,251 1.0
Other 318 <1
Total 330,606 100

Ecoregions 37
Figure 16. Ecoregions of the Yukon River Basin (modified from Gallant and others, 1995 and Ecological Stratification Working Group for Canada, 1995).
Alaska Range
Boreal Mountains and Plateaus
Brooks Range
Eagle Plains
Interior Bottomlands
Interior Forested Lowlands & Uplands
Interior Highlands
Mackenzie Mountains
Ogilvie Mountains
Old Crow Flats
Pelly Mountains
Ruby Ranges
Selwyn Mountains
Subarctic Coastal Plains
Wrangell Mountains
Yukon Flats
Yukon Plateau Central
Yukon Plateau North
Yukon Southern Lakes
Yukon Stikine Highlands
Other
ECOREGIONS
0
0
100
100
200
200
300 KILOMETERS
300 MILES
38 Environmental and Hydrologic Overview of the Yukon River Basin, Alaska and Canada
than 5 degrees on hillslopes, exceed 25 degrees on some moun-
tains. The part of the ecoregion contained in the Yukon River
Basin is part of a broad syncline having Cretaceous rocks in the
center and Paleozoic and Precambrian rocks on the flanks. An
extensive system of valley glaciers still exist. Permafrost is dis-
continuous in this ecoregion; however, its full extent is unknown.
Streams are swift and braided, and most headwaters are in glaciers.
Much of the ecoregion consists of rocky slopes, icefields,
and glaciers. Where soil development has occurred, principal soils
are Lithic Cryorthents, Pergelic Cryaquepts, Pergelic Ruptic-His-
tic Cryorthents, Typic Cryaquepts, Pergelic Cryumbrepts, and
Typic Cryumbrepts. Most soils are stony and shallow over bed-
rock, or bouldery colluvial, or glacial deposits. Soils on lower
slopes and in valleys are typically poorly drained, and have a shal-
low permafrost table. Most of the region is barren of vegetation.
Dwarf scrub communities are most common where vegetation
does occur, growing on well-drained, windswept sites. More pro-
tected slopes provide moist to mesic sites that support low or tall
scrub communities. Open needleleaf forests and woodlands occur
on well-drained sites in some valleys and on lower hillslopes.
Boreal Mountains and Plateaus—This ecoregion covers
most of northwestern British Columbia and a small area in the
extreme southwestern part of the Yukon Territory. The ecoregion
is composed of a complex of rugged mountains, high plateaus, and
lowlands. Temperature and precipitation vary with altitude. The
climate tends to be more moderate in the western half of the ecore-
gion and becomes more continental towards the eastern part. The
typical mean annual temperature for the area is approximately 28
°F with a summer mean of 50 °F and a winter mean of 5 °F. The
mean annual precipitation ranges from 16 to 28 in.
The vegetation is a complex mosaic, ranging from alpine
vegetation and bare bedrock at higher mountain altitudes to alpine
fir with some white spruce and deciduous shrubs dominating sub-
alpine forests at middle altitudes in the southern Cassiar and north-
ern Omineca Mountains. Closed canopied forests of lodgepole
pine, and white and black spruce dominate the boreal forests of the
Stikine and Yukon Plateaus. The most common soils are Humo-
Ferric Podzolic soils on upland sites in subalpine regions, and
Gray Luvisolic with Dystric Brunisolic soils in the boreal forest
regions. Permafrost with low ice content occurs sporadically in the
northern part of the ecoregion and is confined to isolated patches
in the southwest.
Brooks Range—The Brooks Range ecoregion consists of
several groups of rugged deeply dissected mountains carved from
uplifted sedimentary rock. Altitudes of the mountain peaks range
from 2,600 to 7,900 ft. An arctic climate regime and unstable hill-
slopes maintain a sparse cover of dwarf scrub vegetation through-
out the mountains. The ecoregion is influenced by arctic climate.
A weather station located at Anaktuvuk Pass is at an altitude of
2,500 ft. Winter temperatures average a daily minimum of -22 °F
and a daily maximum of -8 °F, whereas summer temperatures
average a daily minimum of 37 °F and a daily maximum of 61 °F.
Mean annual precipitation at Anaktuvuk Pass is 11 in. and annual
snowfall is 63 in.
Continuous thick permafrost underlies the ecoregion. The
principal soils of the Brooks Range are Pergelic Cryaquepts,
Pergelic Cryumbrepts, and Lithic Cryorthents. Hillslope soils
were formed from local colluvium, whereas most valley soils gen-
erally developed from glacial till. Soils throughout this ecoregion
typically have poor drainage because of the shallow depth to per-
mafrost. Because of highly erodible hillslope sediments, shallow
soils, high winds, and harsh climate in this ecoregion, vegetation
cover is sparse and generally limited to valleys and lower hills-
lopes. Drier sites support dwarf scrub communities.
Ecoregions 39
Eagle Plains—This ecoregion is almost an entirely unglaci-
ated rolling plateau; it includes the Eagle Plain, Bell Basin, and
part of the Porcupine Plateau. The mean annual temperature for
the area is 20 °F with a summer mean of 50 °F and a winter mean
of -10 °F. Mean annual precipitation ranges from 16 to 18 in. The
vegetative cover of this ecoregion is typical subarctic forest. Open,
very stunted stands of black spruce and tamarack with secondary
stands of white spruce and ground cover of dwarf birch, willow,
heath shrubs, cottongrass, lichen, and moss are predominant.
On the southern part of the ecoregion, long, even-topped
ridges along the Porcupine Plateau have broad, gently rounded
summits typical of unglaciated terrain. Relief is low; altitude
ranges from 1,000 to 2,000 ft and the highest peak is 3,000 ft. The
plain is underlain by Cretaceous and older sandstone and shale. A
discontinuous veneer of eolian material covers much of the more
stable upper slopes in the region. Permafrost is continuous. High
ice content permafrost in the form of ice wedges is common in
basin areas. Turbic Cryosols on loamy, inclined, and dissected col-
luvial material are most common. Regosols on gravelly alluvial
material and Dystric Brunisols on sandy colluvium occur on non-
permafrost sites. Characteristic wetlands covering 25 to 50 percent
of the land area consist of peat plateau bogs, palsa bogs, and ribbed
and horizontal fens.
Interior Bottomlands—This ecoregion is composed of flat
to nearly flat bottomlands along large rivers of interior Alaska.
The bottomlands are dotted with thaw and oxbow lakes. Soils are
poorly drained and shallow, commonly over permafrost. Predom-
inant vegetation communities include forests dominated by spruce
and hardwood species, tall scrub thickets, and wetlands. The
ecoregion is characterized by a continental climate. The bottom-
lands in the west receive more annual precipitation than those in
the east. Annual precipitation ranges from 11 to 16 in., and annual
snowfall ranges from 37 to 80 in. Average daily minimum temper-
atures in winter range from -27° F to -15 °F. Average daily maxi-
mum winter temperatures range from -8 °F to 1 °F. Summer
temperatures have lows of about 45 °F and highs of about 72 °F.
The terrain of the ecoregion is typified by flat to nearly flat
bottomlands, with some inclusions of local hills. Most areas in the
bottomlands have a slope gradient of less than 1 degree. Altitudes
range from 1,400 ft in the west to 2,000 ft in the east. Fluvial and
eolian deposits of mixed origin cover most of the region, but out-
wash gravel and morainal deposits are in some areas. Meandering
streams and side sloughs are prevalent and oxbow lakes and thaw
lakes are numerous.
Principal soils are Histic Pergelic Cryaquepts, Pergelic
Cryaquepts, Aquic Cryochrepts, Typic Cryochrepts, and Typic
Cryofluvents. On flat areas away from the main river channels,
soils are shallow over permafrost, poorly drained, and nearly
always wet. On the slightly higher levees, soils are well drained
and permafrost is deep or absent. Soils with permafrost are very
susceptible to alteration upon disturbance of the organic mat.
Needleleaf, broadleaf, and mixed forest stands occur on a variety
of sites in the Interior Bottomlands ecoregion. Tall scrub commu-
nities form thickets on flood plains. The wettest sites support a
variety of wetland communities, such as low scrub bogs, wet
graminoid herbaceous meadows, and wet forb herbaceous
marshes and meadows.
Interior Forested Lowlands and Uplands—This ecore-
gion has a continental climate, with short warm summers, and long
very cold winters. Because this ecoregion is so large, temperature
and precipitation vary widely from west to east. Total annual rain-
fall and snowfall generally increase with altitude. Temperature,
while affected by altitude, is also influenced by distance from the
ocean; maximum summer temperatures increase from west to east,
40 Environmental and Hydrologic Overview of the Yukon River Basin, Alaska and Canada
and minimum winter temperatures decrease in the same pattern.
Mean annual precipitation over most of the region ranges from 10
to 22 in. with contributions from snowfall ranging from 49 to 81
in. Most precipitation occurs during summer, mainly as a result of
convective storms. Average minimum winter temperatures range
from 0 °F in the west to -31 °F in the east; average maximum win-
ter temperatures range from 12 °F in the west to -8 °F in the east.
Summer temperatures, ranging from 46 to 72 °F with daily fluctu-
ations of 15 to 20 °F, have less regional variation than winter tem-
peratures.
The terrain of the ecoregion consists of rolling lowlands, dis-
sected plateaus, and rounded low to high hills. Most of the region
lies between altitudes ranging from sea level to 1,600 ft, but some
hills rise more than 2,300 ft. Slope gradients are generally from 0
to 5 degrees. The predominant geologic formations are derived
from Mesozoic and Paleozoic sedimentary rocks, but extensive
areas of volcanic deposits also occur. The region is surficially
mantled by undifferentiated alluvium and slope deposits. Streams
originating from within this ecoregion tend to be short, whereas
larger and longer streams originate from adjacent glaciated moun-
tainous regions. Although thaw lakes and oxbow lakes occur
throughout the ecoregion, lakes are not a predominant landscape
feature. The western part of the ecoregion is underlain by thin to
moderately thick permafrost, and the eastern part has a discontin-
uous distribution of permafrost.
Dominant soils are Histic Pergelic Cryaquepts, Pergelic
Cryaquepts, Aquic Cryochrepts, Pergelic Cryochrepts, Typic
Cryochrepts, Typic Cryorthents, and Pergelic Cryumbrepts. The
interrelationships among permafrost, surface water, fire, hillslope
aspect, and soil characteristics result in a finely textured, complex
pattern of vegetation across the ecoregion. Soil temperatures may
differ greatly from air temperature, so patterns in vegetation may
not correspond with expected site conditions. Needleleaf, broad-
leaf, and mixed forests occur over a variety of site conditions. Tall
shrub communities grow in areas of newly exposed alluvium, such
as flood plains, streambanks, drainageways, and lake margins, on
burned or otherwise disturbed areas, and near timberline. Low
scrub communities occur in moist areas and on north-facing
slopes. The wettest sites support tall scrub swamps, low scrub
bogs, or scrub-graminoid communities. Recently burned areas dis-
play a succession of recovery stages that include mesic forb herba-
ceous communities, mesic graminoid herbaceous communities,
scrub communities, and broadleaf, needleleaf, and mixed forests.
Interior Highlands—This ecoregion is composed of
rounded, low mountains, often surmounted by rugged peaks.
Although no long-term weather data are available, certain gener-
alizations can be made regarding temperature and precipitation.
First, an orographic effect on precipitation causes the highlands to
receive more precipitation than the surrounding, lower altitude
areas. Second, summer temperatures probably decrease with alti-
tude.
Altitudes range from 1,600 ft in the valleys to more than
4,900 ft on the peaks. Slope gradients commonly range from 5 to
15 degrees. The mountains have much more exposed bedrock than
the surrounding hills of the Interior Forested Lowlands and
Uplands ecoregion. Geologic formations consist of Paleozoic and
Precambrian metamorphic rocks, felsic volcanic rocks, and intru-
sive rocks. The northern part of the ecoregion is underlain by con-
tinuous permafrost.
Dominant soils are Histic Pergelic Cryaquepts, Typic Cryo-
chrepts, Pergelic Cryumbrepts, Lithic Cryorthents, and Typic Cry-
orthods. Most soils are shallow, formed in very stony or gravelly
material weathered from local rock. The permafrost table is shal-
low and soils are poorly drained; however, they are generally too
Ecoregions 41
shallow over bedrock for ground ice to form. Soils with permafrost
are very susceptible to alteration upon disturbance of the organic
mat because of the relatively warm (more than 29 °F) permafrost
temperature. Organic mat disturbance, such as from wildfires, can
result in warmer soil temperatures, lowered permafrost tables, and
significant changes in soil physical properties and hydrology. The
highest altitudes are barren of vegetation. Dwarf scrub communi-
ties, dominated by species of mountain avens, ericads, and willow,
are widespread in sites exposed to wind. Lower altitudes are gen-
erally more protected from wind and have a denser vegetation
cover that can include open needleleaf forests and woodlands.
Areas of poor soil drainage support mesic graminoid herbaceous
communities.
Mackenzie Mountains—This extremely rugged heteroge-
neous ecoregion spans the Yukon Territory/Northwest Territories
border from Alaska to the Mackenzie Valley. It includes the Ogil-
vie and Wernecke Mountains in its westernmost section, the Back-
bone Ranges in its interior, and the Canyon Ranges to the east. The
eastern ranges of the Mackenzie Mountains that lie in the rain
shadow of the higher Selwyn Mountains to the west are also
included. The ecoregion shows evidence of localized alpine and
valley glaciation. The mean annual temperature for the area is
approximately 23 °F with a summer mean of 48 °F and a winter
mean of -2 °F. Mean annual precipitation is highly variable with
the highest amounts, greater than 24 in., occurring in the south-
western part of the ecoregion. Moving westward towards Alaska
and the southern Ogilvies, precipitation decreases to approxi-
mately 16 in.
The region is characterized by alpine tundra at higher alti-
tudes and subalpine open woodland vegetation at lower altitudes.
Alpine vegetation consists of lichens, mountain avens, intermedi-
ate to dwarf heath shrubs, sedge, and cottongrass in wetter sites.
Barren talus slopes are common. Subalpine vegetation consists of
discontinuous open stands of stunted white spruce and occasional
alpine fir in a matrix of willow and dwarf birch. Permafrost is con-
tinuous and of low ice content in most of the Yukon part of the
ecoregion. Turbic Cryosols with some Dystric Brunisols and
Regosols occur on steeply sloping colluvium.
Ogilvie Mountains—The Ogilvie Mountains ecoregion,
located along the eastern edge of the Yukon River Basin, consists
of flat-topped hills eroded from a former plain and broad pediment
slopes built up from mountains that are much subdued from their
former stature. Karst topography is common, and mesic graminoid
herbaceous communities and tall scrub communities are wide-
spread throughout the region.
The ecoregion has a continental climate. No perennial
weather stations are located in this region and thus precipitation
and temperature characteristics are interpolated from outside the
region. These interpolations indicate that annual precipitation is
about 20 in. in the hills to about 26 in. in the higher mountains.
Annual snowfall ranges from 51 to 81 in. across the region. Daily
winter temperatures range from lows of -26 °F to highs of -8 °F,
and daily summer temperatures range from 46 °F to 72 °F.
The terrain of the region consists of predominantly flat-
topped hills eroded from a former plain. Pediment slopes, extend-
ing across broad valleys to the foothills of the current, subdued
mountains, are characteristics of the plateaus. Erosional scarps in
sedimentary rock occur in many localities. Weathered limestone is
exposed at higher altitudes, and talus and rubble mantle the lower
mountainsides. Altitudes range from 2,900 ft to more than 4,200 ft
and slope gradients are generally less than 5 degrees. The region is
composed of metamorphic and sedimentary rocks, primarily dolo-
mite, phyllite, argillite, limestone, shale, chert, sandstone, and
42 Environmental and Hydrologic Overview of the Yukon River Basin, Alaska and Canada
conglomerate. Karst topography is common and most of the
region is underlain by permafrost.
Principal soils of the Ogilvie Mountains ecoregion are Histic
Pergelic Cryaquepts, Typic Cryochrepts, and Pergelic Cryorth-
ents. Soils were formed in gravelly or stony material weathered
from local rock. Soils in valleys were formed from deep, loamy,
alluvial sediments from the surrounding uplands. Vegetation is
dominated by mesic graminoid herbaceous communities and tus-
sock-forming sedges. Needleleaf, broadleaf, and mixed forest
communities occupy lower hillslopes and valleys. Tall scrub com-
munities occur extensively at lower altitudes and can extend above
the timberline.
Old Crow Flats—Old Crow Flats is the largest wetland
complex in the Yukon Territory. Located on the Old Crow River
system north of the Arctic Circle, the Flats contain more than
2,000 ponds and marshes ranging in size from 100 ft
2
to 18 mi
2
.
The area is an important breeding and molting ground for 500,000
water birds. Waterfowl, muskrats, and other wildlife of the Flats
are of great importance to the Native residents.
The ecoregion is unglaciated and incorporates the area of
wetlands and lakes that occupy a glaciolacustrine plain that makes
up the lowest part of the Old Crow River Basin. This level, low-
relief ecoregion, locally referred to as “The Flats” lies at about
1,000 ft. The climate is strongly continental. Mean monthly air
temperature ranges are as extreme as anywhere in North America.
Short warm summers contrast with long very cold winters. The
mean annual temperature for the area is approximately 14 °F with
a summer mean of 46 °F and a winter mean of -17 °F. Mean annual
precipitation ranges from 8 to 10 in.
Wetlands, which cover most of the ecoregion, are made up of
polygonal peat plateau bogs with basin fens and locally occurring
shore fens. Organic Cryosols are the most common wetland soils.
Better drained parts of the land support open, very stunted stands
of black spruce and tamarack with minor stands of white spruce
and ground cover of dwarf birch, willow, cottongrass, lichen, and
moss. Static Cryosols on sandy alluvial material and Turbic Cryo-
sols on loamy, ice-rich lacustrine material dominate the mineral
soils of the ecoregion. Permafrost is continuous with a high ice
content in the form of ice wedges and massive ice bodies.
Pelly Mountains—This ecoregion encompasses the Pelly
and northern Cassiar Mountains spanning the British Colum-
bia/Yukon Territory border. The mean annual temperature for the
area is approximately 37 °F with a summer mean of 51 °F and a
winter mean of -1 °F. Mean annual precipitation is 20 to 39 in.
varying with altitude. Boreal forests of white spruce, black spruce,
lodgepole pine, and aspen cover the lower altitude valley bottoms.
Much of the ecoregion lies above the treeline and is characterized
by alpine tundra communities of lichens, dwarf heath shrubs,
birch, and willows. Grasses, sedges, cottongrass, and some mosses
occupy wet sites. Open-growing black and white spruce, and
alpine fir are prevalent in the subalpine region.
The Pelly and Cassiar Mountains, composed of crystalline
Mesozoic and Paleozoic strata, are of moderately high relief, rang-
ing from about 4,900 ft to the highest peak at 7,900 ft. Relief is
greater in the Pelly Mountains than in the Cassiar Mountains. Per-
mafrost is sporadically distributed. Dystric and Eutric Brunisols
are codominant in the ecoregion. Dystric Brunisols are associated
with coarse igneous rocks at higher altitudes. Plateau areas with
sandy loam morainal parent materials are associated with Eutric
Brunisols. Turbic Cryosolic soils are found in alpine areas and in
some poorly drained areas.
Ecoregions 43
Ruby Ranges—This ecoregion covers the Kluane
River–Kluane Plateau. The climate is characterized by short cool
summers and long cold winters. Winter temperature inversions are
common, giving milder temperatures at higher altitude. Maritime
air from the Gulf of Alaska periodically invades the ecoregion dur-
ing the winter to produce mild spells with near-thawing tempera-
tures. The mean annual temperature for the area is approximately
27 °F with a summer mean of 50 °F and a winter mean of 2 °F.
Mean annual precipitation ranges from 10 to 12 in.
Northern boreal forests occupy lower slopes and valley bot-
toms. Open white and black spruce occur in a matrix of dwarf wil-
low, birch, heath shrubs, and some lodgepole pine. Black spruce,
scrub willow, birch, and mosses are found on poorly drained sites.
Alpine fir and lodgepole pine occur in higher subalpine sections,
whereas the highest altitudes consist of sparsely vegetated alpine
communities of mountain avens, dwarf willow, birch, shrubs and
mosses. The terrain consists of rolling to undulating hills above
2,900 ft and the highest peak is 7,560 ft.
The most common soils in this ecoregion are Eutric
Brunisols on sandy loam morainal or colluvial materials. Regoso-
lic soils are associated with active deposition of gravelly fluviogla-
cial outwash materials on braided flood plains. Volcanic ash from
the 1,300-year-old White River eruption is up to 40 in. thick on
lower slopes. In these cases, the soils are classified as either Rego-
sols or Regosolic Turbic Cryosols, depending on the presence or
absence of permafrost. Permafrost is extensive and discontinuous
over most of the ecoregion decreasing to sporadic along the west-
ern side of the ecoregion.
Selwyn Mountains—This ecoregion is located in the Sel-
wyn and southern Mackenzie Mountains that span the Yukon Ter-
ritory/Northwest Territories border. For the most part, this is a
rugged mountain wilderness, a northern extension of the Rocky
Mountains. Climate conditions vary with altitude. The mean
annual temperature for major valley systems is approximately 24
°F with a summer mean of 49 °F and a winter mean of -3 °F. Mean
annual precipitation is highly variable ranging from 24 in. at lower
altitudes on the perimeter of the ecoregion up to 30 in. at high alti-
tudes.
The ecoregion is characterized by alpine tundra at higher
altitudes and by subalpine open vegetation at lower altitudes.
Alpine vegetation consists of crusoe lichens, mountain avens,
dwarf willow, and heath shrubs. Sedge and cottongrass are associ-
ated with wetter sites. Barren talus slopes are common. Subalpine
vegetation consists of discontinuous open stands of stunted white
spruce, and occasional alpine fir and lodgepole pine, in a matrix of
willow and dwarf birch. Sedge, cottongrass, and mosses occur in
wet sites. The Selwyn Mountains, which have been extensively
glaciated, are composed of Paleozoic and Precambrian strata
intruded by granite stocks. They are divided into several ranges by
broad, northwesterly trending valleys. Some ranges contain alpine
and valley glaciers. Permafrost is extensive but discontinuous in
the western part and continuous with low ice content in the eastern
part of the ecoregion. Dystric and Eutric Brunisols on alluvial, flu-
vioglacial, and morainal veneers and blankets are dominant in the
region. Static and Turbic Cryosols with Dystric Brunisols or Rego-
sols are developed on higher altitude, steeply sloping colluvium.
Subarctic Coastal Plains—This ecoregion includes the
Yukon River Delta area. Flat, lake-dotted coastal plains and river
deltas are characteristics of the region. Streams have very wide
and serpentine meanders. Soils are wet and the permafrost table is
shallow, providing conditions for wet graminoid herbaceous com-
munities, the predominant vegetation type.
Climate in this ecoregion is transitional between maritime
and continental influences. In general, the southern part of the
44 Environmental and Hydrologic Overview of the Yukon River Basin, Alaska and Canada
region has warmer temperatures and receives more precipitation
than the northern part. Average annual precipitation is about 20 in.
and annual snowfall is about 59 in. Temperatures in winter range
from average daily minimums of -13 °F to average daily maxi-
mums of 14 °F. Average daily temperatures in summer range from
a minimum of 43 °F to a maximum of 55 °F.
The terrain of this ecoregion consists primarily of flat poorly
drained coastal plains with shallow permafrost tables. Low hills of
basalt surmounted by cinder cones and broad shallow volcanic
craters occur in some locations, creating a range in regional alti-
tude from sea level to more than 400 ft. Slopes in the plains are
generally less than 1 degree. The region is predominantly covered
by older coastal deposits of interstratified alluvial and marine sed-
iments.
Predominant soils are Histic Pergelic Cryaquepts and
Pergelic Cryofibrists. Soils are shallow over permafrost and are
constantly wet. Soils have formed from stratified silty and sandy
alluvial deposits that, in many areas, have additionally incorpo-
rated deposits of volcanic ash and loess. Standing water is almost
always present in the ecoregion and wet graminoid herbaceous
communities, such as wet meadows and bogs, predominate in sat-
urated soils. Peat mounds, barren sand dunes, and volcanic soils
support dwarf scrub communities dominated by ericaceous spe-
cies.
Wrangell Mountains—The Wrangell Mountains ecoregion
consists of steep, rugged mountains of volcanic origin that are
extensively covered by ice fields and glaciers. Most slopes are bar-
ren of vegetation. Dwarf scrub tundra communities, consisting of
mats of low shrubs, grasses, and lichens, predominate where veg-
etation does occur.
Climate is primarily affected by continental influences. Win-
ter low temperatures average -29 °F, and winter highs average 16
°F. Mean summer low temperature is 37 °F, and mean summer
high is 72 °F. Average annual precipitation is about 16 in., and
annual snowfall is about 69 in. Higher altitudes may receive 80 in.
of precipitation annually, including 100 in. of snow.
The Wrangell Mountains ecoregion represents a large group
of shield and composite volcanoes of Cenozoic age. These volca-
nic formations lie over Paleozoic and Mesozoic sedimentary and
volcanic rocks. The terrain is steep and rugged; most slope gradi-
ents exceed 7 degrees and many surpass 15 degrees. Altitudes start
at 2,000 ft, most of the largest peaks are 13,000 ft or higher, and
several peaks exceed 16,000 ft. Extensive glaciation persists and
permafrost is discontinuous.
Much of the landscape consists of steep rocky slopes, ice-
fields, and glaciers. Soil development has resulted in thin, stony
soils that are shallow over bedrock or bouldery deposits. Most
soils have formed in very stony and gravelly colluvial material.
Soils in valleys and on footslopes have formed in glacial till, with
a thin mantle of volcanic ash or loess in some places. Principal
soils are Lithic Cryorthents, Typic Cryorthents, Pergelic Cryo-
chrepts, and Pergelic Cryumbrepts. Most slopes in the mountains
are barren of vegetation. Dwarf scrub communities dominate
where vegetation does occur, growing on well-drained, windy
sites. Tall scrub communities occur along drainages and on flood
plains. Broad ridges, valleys, and hilly moraines at lower altitudes
support needleleaf forests dominated by white spruce, or broadleaf
forests dominated by paper birch or aspen.
Yukon Flats—The Yukon Flats ecoregion is a relatively flat,
marshy basin floor in east-central Alaska that is patterned with
braided and meandering streams, numerous thaw and oxbow
lakes, and meander scars. In many ways, the ecoregion is similar
Ecoregions 45
to the Interior Bottomlands region except that the Yukon Flats
ecoregion differs in climatic characteristics. Forests dominated by
spruce and hardwood species, tall scrub communities, and wet
graminoid herbaceous communities are the predominant vegeta-
tion type.
The Yukon Flats ecoregion has a continental climate. The
mountains surrounding the ecoregion isolate it from the weather
systems affecting the neighboring regions. Consequently, summer
temperatures tend to be higher than at other places of comparable
latitude and winter temperatures tend to be colder. Average daily
temperatures in winter range from lows of about -29 °F to highs of
about -11 °F. Average daily temperatures in summer range from
lows of just about freezing to highs of about 72 °F. Annual precip-
itation is low, averaging 6.5 in. and average snowfall is 45 in.
(water content of about 4 in.). Local precipitation is not sufficient
to maintain water levels in many lakes. Levels are primarily main-
tained by the yearly flooding of the region by the Yukon River that
accompanies spring breakup of ice (Gallant and others, 1995).
The central part of the ecoregion is flat, whereas the edges of
the region range from 300 ft to more than 600 ft. Slope gradient is
generally less than 1 degree in the center and 1 to 2 degrees at the
edges. The region is mantled by Quaternary-age alluvial deposits.
The Yukon River drains the ecoregion, assisted by numerous
meandering and braided tributaries and side sloughs. Permafrost is
present in most areas, except beneath rivers and large thaw lakes.
Thaw lakes and oxbow lakes are abundant.
Principal soils are Histic Pergelic Cryaquepts, Pergelic
Cryaquepts, Aquic Cryochrepts, and Pergelic Cryochrepts. Most
soils were formed from silty alluvium and loess from the flood
plains of the Yukon River. On flat areas away from the main river
channels, soils are poorly drained, are commonly overlain by peat,
and have a shallow permafrost table. Soils on natural levees are
better drained and consist of silty and sandy sediments. Needle-
leaf, broadleaf, and mixed forests are widespread and occupy sites
representing an array of soil drainage characteristics. Tall scrub
thickets occur on alluvial deposits subject to periodic flooding.
Tall scrub swamps and wet graminoid herbaceous communities
occupy the wettest sites.
Yukon Plateau Central—This ecoregion extends north-
ward from Lake Laberge to the lower Stewart River in the central
Yukon. The Yukon Plateau Central ecoregion is composed of sev-
eral groups of rolling hills and plateaus separated by deeply cut,
broad valleys. The climate is cold and semiarid. The mean annual
temperature for the area is approximately 26 °F with a summer
mean of 54 °F and a winter mean of -2 °F. Mean annual precipita-
tion ranges from 10 in. in the southern areas near Carmacks to 16
in. at higher altitudes in the north and east.
White and black spruce form the most common forest types.
Black spruce is usually dominant in wetter areas. Lodgepole pine
commonly invades burnt-over areas and very dry sites. In some
places, alpine fir forms the treeline but is sparse and is usually
associated with white spruce and occasionally with paper birch.
Sedge tussocks and sphagnum are common in wetlands. Scrub
birch and willow occur in subalpine sections that extend up to the
treeline. A significant vegetative feature of this ecoregion is the
presence of extensive grasslands on all low-altitude, south-facing
slopes. The forests suffer frequently from recurring natural fires
such that series of ecological communities are most common.
Altitudes are above 3,300 ft, except for major river valleys,
which lie below 2,000 ft in the northwestern part. Several moun-
tains reach heights of 4,900 ft. Eutric Brunisols, which developed
on steeply sloping, ridged-to-hummocky, loamy morainal and
sandy fluvioglacial material, are dominant in the ecoregion. Much
of the ecoregion is covered by a veneer of recent volcanic ash 4-
46 Environmental and Hydrologic Overview of the Yukon River Basin, Alaska and Canada
12 in. thick. Permafrost is discontinuous to sporadic with high ice
content associated with fine-textured valley deposits. Turbic Cry-
osols are confined to wet depressions and beneath mature forests
on lower, north-facing slopes.
Yukon Plateau North—This ecoregion lies within the
Stewart, Macmillan, and Pelly Plateaus and the southern foothills
of the Selwyn Mountains. The terrain includes rolling uplands,
small mountain groups, and nearly level tablelands dissected by
deeply cut, generally broad, U-shaped valleys. The Tintina Trench,
a straight, steep-sided valley 3-12 mi wide, traverses the ecore-
gions from southeast to northwest. The mean annual temperature
for the area is approximately 25 °F with a summer mean of 51 °F
and a winter mean of -4 °F. Mean annual precipitation ranges from
12 in. in the major valleys up to 24 in. in the mountains to the
northeast.
Northern boreal forests exist at altitudes up to 4,900 ft. White
spruce in a matrix of dwarf willow, birch, heath shrubs, and occa-
sionally lodgepole pine, form extensive open forests, particularly
in the northwestern part of the ecoregion. Black spruce, scrub wil-
low, birch, and mosses are found on poorly drained sites. Alpine
fir and lodgepole pine occur in higher subalpine sections. Exten-
sive discontinuous permafrost with a medium ice content is wide-
spread, decreasing to sporadic discontinuous permafrost along the
southwestern edge of the region. Turbic Cryosolic and Eutric
Brunisolic soils predominate, and occasional pockets of Dystric
Brunisols occur on coarse-textured morainal and fluvioglacial
materials.
Yukon Southern Lakes—This ecoregion extends from
Lake Laberge south to the boundary with British Columbia. The
climate is cold and semiarid. In major valleys, the mean annual
temperature is about 28 °F with a summer mean of 50 °F and a
winter mean of 2 °F. Lying within the rain shadow of the St. Elias
Mountains, mean annual precipitation ranges from 9 to 12 in. in
the major valleys.
Boreal forests are composed of open white spruce and lodge-
pole pine intermixed with aspen. South-facing slopes at low alti-
tude are occupied by grassland communities. Subalpine altitudes
above 4,000 ft support open forest communities of alpine fir, white
spruce, and some lodgepole pine. Most of the terrain lies 2,000 to
4,900 ft in altitude, but a few peaks are higher than 5,900 ft.
Underlain by Mesozoic sedimentary strata and Paleozoic meta-
morphic slates and schists, the topography is characterized by dis-
sected plateaus and rolling hills. Eutric Brunisolic soils on sandy
loam and rolling morainal to steep colluvial material are dominant.
Low ice content permafrost occurs in a sporadic discontinuous
pattern. Cryosolic soils are scattered throughout the landscape on
some poorly drained areas and on north-facing slopes.
Yukon Stikine Highlands—This ecoregion covers a zone of
climate transition from coastal to interior conditions in northwest-
ern British Columbia and southern Yukon. The ecoregion falls
within the rain shadow of the Coast Mountains. Precipitation
decreases moving inland, and temperatures are moderated
throughout the year by the influence of maritime air masses. The
mean annual temperature for the area is approximately 30 °F with
a summer mean of 50 °F and a winter mean of 8 °F. Mean annual
precipitation ranges from 20 to 24 in. The ecoregion is composed
of a combination of three distinct vegetation zones: alpine tundra
dominated by low-growing heather, dwarf birch, willow, grass,
and lichen; subalpine forests of alpine fir, white spruce, and an
occasional Engelmann spruce; and closed boreal forests of black
and white spruce. Permafrost is discontinuous and sporadic with
generally low ice content. Soils range from Brunisolic and Rego-
solic with some Cryosolic soils in alpine regions to Dystric and
Eutric Brunisols in subalpine and boreal sections of the ecoregion.

Ecoregions 47
View of the Interior Forested Lowlands and Uplands
ecoregion, which composes 21 percent of the Yukon
River Basin. The terrain consists of rolling lowlands, dis-
sected plateaus, and rounded low to high hills. Climate
is characterized by short warm summers and long cold
winters.
View of the Interior Highlands ecoregion, which is the
second largest ecoregion of the Yukon River Basin.
Rounded mountains, often surmounted by rugged
peaks, are typical of the ecoregion. Vegetation commu-
nities consist of alpine tundra and open spruce stands.

48 Environmental and Hydrologic Overview of the Yukon River Basin, Alaska and Canada
HYDROLOGIC CHARACTERISTICS OF THE
YUKON RIVER BASIN
Surface Water
Streamflow quantity and variability have considerable influ-
ence on the quality of surface water. The quantity of water in a
stream or river influences its ability to support aquatic communi-
ties, to assimilate or dilute waste discharges, and to carry sus-
pended sediment and geochemical weathering products. Temporal
variability of streamflow may, in turn, cause temporal variability
of water quality. Thus, knowledge of streamflow is important to
understand the water-quality and ecological dynamics of a water-
shed.
The Yukon River is composed of many streams and rivers.
Utilizing the Alaska Hydrologic Unit Classification system (U.S.
Geological Survey, 1987) and a somewhat similar classification
system for Canada, the Yukon River Basin can be divided into 13
major basins (table 5; fig. 17). These basins represent the eight
major tributaries to the Yukon River and the major lowland areas
that drain directly into the Yukon River.
Table 5. Major drainage basins in the Yukon River Basin
Basin
(fig. 17)
Area
Comments
Square
miles
Percent
Yukon Headwaters
a
a
Basin contained active gaging station in 1999
13,000 4.0 Drains an extensive lake system in the headwaters of the basin. Glaciers are present above the lakes
Teslin River 13,100 4.1 East of the Yukon Headwaters subbasin. Most runoff is from snowmelt. Teslin Lake is near the outlet of the basin
Pelly River
a
18,600 5.8 Drains the most eastern part of the Yukon River Basin
Stewart River
a
19,800 6.2 North of the Pelly River watershed and drains the eastern part of the Yukon River Basin
White River
a
18,100 5.6 Most significant feature is presence of glaciers in the upper part of the basin. Drains part of the Wrangell–St. Elias Mountains
Upper Yukon
a
28,200 8.8 Primarily drains low-lying streams and rivers
Porcupine River 45,000 14.0 Drains the northeastern part of the Yukon River Basin. Most of the basin is underlain by continuous permafrost
Chandalar River 13,700 4.3 Drains the south side of the Brooks Range. Underlain by continuous permafrost
East Central Yukon
a
27,300 8.5 Drains low-lying streams. Main tributaries are the Porcupine and Chandalar Rivers
Tanana River
a
44,300 13.7 Primarily drains the north side of the Alaska Range. Glaciers are present in the basin
Koyukuk River 35,000 10.9 Drains part of the Brooks Range and is underlain by continuous permafrost
West Central Yukon 20,900 6.5 Drains low-lying streams along the main stem of the Yukon River. Main tributaries are the Tanana and Koyukuk Rivers
Lower Yukon 24,500 7.6 Drains low-lying streams. Main tributary is the Innoko River. Much of this area consists of wetlands
Total 321,500 100

Surface Water 49
Figure 17. Major drainage basins in the Yukon River Basin. (See table 5 for more information.)
Yukon Headwaters
Teslin River
Pelly River
Stewart River
White River
Upper Yukon
Porcupine River
Chandalar River
East Central Yukon
Tanana River
Koyukuk River
West Central Yukon
Lower Yukon
MAJOR DRAINAGE BASINS
0
0 100
100
200
200
300 KILOMETERS
300 MILES
Newtok
Saint Marys
Pilot Station
Russian Mission
Holy Cross
Grayling
Shageluk
Kaltag
Koyukuk
Ruby
Huslia
Hughes
Alatna
Bettles
Anaktuvuk Pass
Wiseman
Tanana
Rampart
Minto
Fairbanks
Nenana
Cantwell
Healy
Delta Junction
Dot Lake
Eagle
Dawson
Northway Junction
Beaver Creek
Destruction Bay
Stewart Crossing
Pelly Crossing
Faro
Carmacks
Whitehorse
Carcross
Teslin
Ross River
Mayo
Central
Circle
Birch Creek
Fort Yukon
Venetie
Arctic Village
Old Crow
Hooper
Bay
Chevak
Anvik
Kotlik
Alakanuk
Galena
Nulato
Allakaket
Beaver
Stevens
Village
Livengood
Manley Hot
Springs
North Pole
Two Rivers
Big Delta
Tok
Boundary
Burwash Landing
Ohogamiut
Mountain
Village
Tanacross
Fortymile

50 Environmental and Hydrologic Overview of the Yukon River Basin, Alaska and Canada
Snow and Ice
In the high mountain ranges that surround the Yukon River
Basin, most of the precipitation is in the form of snow. Approxi-
mately 1 percent of the Yukon River Basin consists of perennial
snowfields. When the quantity of annual snowfall exceeds average
annual snowmelt, the snow begins to change into ice or glaciers.
The transformation of snow to ice is a process that is commonly
long and complex (Paterson, 1994). Temperature is an important
factor because snow will develop into ice much more rapidly on
glaciers where periods of melting alternate with periods of freez-
ing (Paterson, 1994).
Approximately 3,500 mi
2
, or 1 percent of the Yukon River
Basin, is covered by glaciers. Glaciers are presently found in the
Alaska Range and Wrangell–St. Elias Mountains. These glaciers
are classified as temperate glaciers because they have a year-round
ice temperature close to 32 °F. The importance of these glaciers to
the basin hydrology cannot be emphasized enough. Glaciers store
an enormous quantity of water in the form of ice. This feature
alone makes any drainage basin containing glaciers both unique
and complex. The release of this water is highly dependent on the
energy supplied by solar radiation and air temperature (Meier,
1969). Hot summers will cause rapid melting and high runoff,
whereas a cool summer will have low runoff.
Streamflow
Generally, most stream-gaging stations in the Yukon River
Basin are located on rivers that drain areas larger than 1,000 mi
2
.
Sixty-eight stream-gaging stations operated by the USGS in
Alaska and the Water Survey of Canada in the Yukon Territory and
British Columbia have 10 or more years of record (fig. 18; table
6). Stream-gaging stations have been located on most of the main
tributaries to the Yukon River. In 1999, 26 stream-gaging stations
were active in the Yukon River Basin: 17 in Canada and 9 in
Alaska (fig. 18). Active stream-gaging stations were located on
seven of the 13 major basins (4 in Canada, 3 in Alaska).
Three basic patterns of runoff are exhibited throughout the
Yukon River Basin: lake runoff, snowmelt runoff, and glacier run-
off. Generally, beginning in October and ending in late April to
mid-May, runoff is minimal and streamflow gradually decreases.
Most runoff occurs from May to September; however, the timing
of runoff in the rivers is different, depending on the particular
basin characteristics.
Discharge hydrographs of three rivers in the headwaters of
the Yukon River Basin (fig. 19) represent these types of runoff pat-
terns. Lake or “combined” runoff: The Atlin River drains a large
lake system in the headwaters of the Yukon River Basin. During
the runoff season, the lakes fill from snowmelt, rainfall, and ice
melt. Once filled, the lakes begin to empty with the highest dis-
charges occurring in August and September. Snowmelt runoff:
The Swift River drains an undisturbed area having no glaciers
present. Most of the runoff occurs in June from snowmelt. Addi-
tional runoff may occur in late summer from rainstorms. Glacier
runoff: The Fantail River is a glacier-fed river. Runoff begins in
June primarily from snowmelt (such as the Swift River), but is sus-
tained throughout most of the summer from glacier icemelt.
Discharge hydrographs for the headwaters of the Yukon
River and its major tributaries (fig. 20) exhibit the three basic pat-
terns of runoff. The Yukon River above Frank Creek (headwaters)
and the Teslin River near Teslin exhibit the lake-runoff pattern.
The Pelly and Stewart Rivers exhibit the snowmelt-runoff pattern.
Although the Porcupine, Chandalar, and Koyukuk Rivers also
exhibit the snowmelt pattern, the baseflows of these rivers
approach zero flow during the winter. This low-flow characteristic
is likely due to the presence of continuous permafrost in the head-
waters of the Yukon River Basin which acts as a barrier to ground
water inflow. Finally, the White and Tanana Rivers exhibit the gla-
cier-runoff pattern of sustained flow through most of the summer.

Surface Water 51
43
65
41
40
38
39
42
62
50-54
37
36
48
49
55
56
35
33
34
29
28
30
23
22
24
19
20
21
18
17
12
11
9
10
8
16
15
13
14
1
2
3
4
6
7
5
26
32
31
25
47
46
45
61
59
60
58
57
67
63
64
66
68
44
27
Discontinued Station
Active Station
STREAMFLOW-GAGING STATIONS (10 OR MORE YEARS OF RECORD)
Figure 18. Location of streamflow-gaging stations with 10 or more years of record in the Yukon River Basin. (See table 6 for station names.)
0
0 100
100
200
200
300 KILOMETERS
300 MILES

52 Environmental and Hydrologic Overview of the Yukon River Basin, Alaska and Canada
Map
No.
(fig.
18)
USGS
station
No.
Name
Drainage
area
(square
miles)
Period of record
1 15304520 Lubbock River near Atlin, BC 683 1960-93
2 15304600 Atlin River near Atlin, BC 2,630 1950-
3 15304650 Wann River near Atlin, BC 104 1958-94
4 15304700 Fantail River at outlet of Fantail Lake
near Atlin, BC
277 1957-94
5 15304750 Tutshi River at outlet of Tutshi Lake
near Atlin, BC
320 1958-
6 15304800 Lindeman River near Bennett, BC 92.7 1955-94
7 15304850 Wheaton River near Carcross, YT 338 1958-
8 15304950 Maclintock River near Whitehorse, YT 656 1956-94
9 15305000 Yukon River at Whitehorse, YT 7,490 1944-
10 15305030 Takhini River at Kusawa Lake at
Whitehorse, YT
1,570 1953-86
11 15305050 Takhini River near Whitehorse, YT 2,700 1949-
12 15305100 Yukon River above Frank Creek, YT 11,900 1955-94
13 15305150 Swift River near Swift River, BC 1,280 1958-
14 15305200 Gladys River at outlet of Gladys Lake
near Atlin, BC
737 1958-93
15 15305250 Teslin River near Teslin, YT 11,700 1948-94
16 15305260 Teslin River near Whitehorse, YT 14,100 1956-73
17 15305300 Big Salmon River near Carmacks, YT 2,610 1955-95
18 15305350 Yukon River at Carmacks, YT 31,600 1965-95
19 15305360 Big Creek near mouth near Minto, YT 676 1976-
20 15305390 Ross River at Ross River, YT 2,800 1962-
21 15305400 Pelly River at Ross River, YT 7,100 1955-74
22 15305406 Pelly River at Faro, YT 8,530 1973-
23 15305412 South MacMillan River at Canol Road
near Ross River, YT
385 1975-95
24 15305420 Pelly River at Pelly Crossing, YT 18,900 1953-
25 15305450 Yukon River above White River near
Dawson, YT
57,900 1957-
26 15305500 Kluane River at outlet of Kluane
Lake, YT
1,910 1953-95
27 15305540 White River at Alaska Highway near
Koidern, YT
2,410 1975-
28 15305582 Stewart River above Fraser Falls near
Mayo, YT
11,810 1980-
29 15305590 Stewart River at Mayo, YT 12,200 1949-64
30 15305620 Stewart River at Stewart Crossing, YT 13,500 1961-73
31 15305650 Stewart River at mouth, YT 19,700 1964-
32 15305670 Yukon River at Stewart, YT 96,900 1957-65
33 15305695 North Klondike River near mouth near
Dawson, YT
425 1975-
34 15305698 Klondike River above Bonanza Creek
near Dawson, YT
3,010 1966-
35 15305700 Yukon River at Dawson, YT 102,000 1945-80
36 15348000 Fortymile River near Steele Creek, AK 5,880 1911-12, 1964,
1976-82
37 15356000 Yukon River at Eagle, AK 113,500 1911-12, 1950-
38 15388950 Porcupine River at Old Crow, YT 21,400 1962-89
39 15388960 Porcupine River near International
Boundary, YT
23,100 1988-
Map
No.
(fig.
18)
USGS
station
No.
Name
Drainage
area
(square
miles)
Period of record
Table 6. Streamflow-gaging stations in the Yukon River Basin with 10 or more years of record

Surface Water 53
40 15389000 Porcupine River near Fort Yukon, AK 29,500 1965-79
41 15389500 Chandalar River near Venetie, AK 9,330 1964-73
42 15439800 Boulder Creek near Central, AK 31.3 1966-82, 1984-86
43 15453500 Yukon River near Stevens Village, AK 196,300 1976-
44 15468000 Yukon River at Rampart, AK 199,400 1956-67
45 15470000 Chisana River at Northway
Junction, AK
3,280 1950-71
46 15476000 Tanana River near Tanacross, AK 8,550 1953-90
47 15476300 Berry Creek near Dot Lake, AK 65.1 1971-81
48 15478000 Tanana River at Big Delta, AK 13,500 1949-57
49 15484000 Salcha River near Salchaket, AK 2,170 1909-10, 1949-
50 15485500 Tanana River at Fairbanks, AK (a) 1973-
51 15493000 Chena River near Two Rivers, AK 941 1967-
52 15493500 Chena River near North Pole, AK 1,440 1972-80
53 15511000 Little Chena River near Fairbanks, AK 372 1967-
54 15514000 Chena River at Fairbanks, AK 1,980 1947-
Map
No.
(fig.
18)
USGS
station
No.
Name
Drainage
area
(square
miles)
Period of record
55 15514500 Wood River near Fairbanks, AK 855 1969-78
56 15515500 Tanana River at Nenana, AK 25,600 1962-
57 15515800 Seattle Creek near Cantwell, AK 36.2 1966-75
58 15516000 Nenana River near Windy, AK 710 1951-56, 1959-81
59 15518000 Nenana River near Healy, AK 1,910 1951-79
60 15518080 Lignite Creek above mouth near
Healy, AK
48.1 1986-
61 15518350 Teklanika River near Lignite, AK 490 1965-74
62 15535000 Caribou Creek near Chatanika, AK 9.2 1970-86
63 15564600 Melozitna River near Ruby, AK 2,693 1962-73
64 15564800 Yukon River at Ruby, AK 259,000 1957-78
65 15564875 Middle Fork Koyukuk River near
Wiseman, AK
1,200 1971-80, 1984-87
66 15564900 Koyukuk River at Hughes, AK 18,700 1961-82
67 15565200 Yukon River near Kaltag, AK 296,000 1957-66
68 15565447 Yukon River at Pilot Station, AK 321,000 1976-96
Map
No.
(fig.
18)
USGS
station
No.
Name
Drainage
area
(square
miles)
Period of record
a
Undefined: part of the river flows through Salchaket Slough and is not gaged.
Table 6. Streamflow-gaging stations in the Yukon River Basin with 10 or more years of record--Continued

54 Environmental and Hydrologic Overview of the Yukon River Basin, Alaska and Canada
0
15,000
5,000
10,000
0
20,000
10,000
0
15,000
5000
10,000
Figure 19. Flow statistics of three rivers near the headwaters of the Yukon River. (See figure 18 for site location.)
MINIMUM
MEAN
MAXIMUM
JFMAMJJASOND
ATLIN RIVER NEAR ATLIN, BC (1950-96) (Map No. 2)
JFMAMJJASOND
SWIFT RIVER NEAR SWIFT RIVER, BC (1958-1996) (Map No.13)
JFMAMJJASOND
FANTAIL RIVER AT OUTLET OF FANTAIL LAKE NEAR ATLIN, BC (1957-94) (Map No. 4)
MINIMUM
MEAN
MAXIMUM
MINIMUM
MEAN
MAXIMUM
AVERAGE DISCHARGE,
IN CUBIC FEET PER SECOND
AVERAGE DISCHARGE,
IN CUBIC FEET PER SECOND
(Lake or "combined" runoff)
(Snowmelt runoff)
(Glacier runoff)

Surface Water 55
EXPLANATION
MINIMUM
MEAN
MAXIMUM
0
80,000
20,000
40,000
60,000
0
30,000
10,000
20,000
AVERAGE DISCHARGE, IN CUBIC FEET PER SECOND
0
200,000
100,000
JFMAMJ J ASOND
YUKON RIVER ABOVE FRANK CREEK
NEAR CARMACKS, YT (1955-94)
(No. 12)
JFMAMJ J ASOND
TESLIN RIVER NEAR TESLIN, YT (1948-94) (No. 15)
JFMAMJ J ASOND
PELLY RIVER AT PELLY CROSSING, YT (1953-96) (No. 24)
Figure 20. Flow statistics of nine major rivers of the Yukon River Basin.
(See figure 18 for site location.)
JFMAMJ J ASOND
0
300,000
100,000
200,000
JFMAMJ J ASOND
0
300,000
100,000
200,000
STEWART RIVER AT MOUTH, YT (1964-96) (No. 31)
PORCUPINE RIVER NEAR
FORT YUKON, AK (1965-79)
(No. 40)
JFMAMJ J ASOND
0
80,000
20,000
40,000
60,000
CHANDALAR RIVER NEAR VENETIE, AK (1964-73)
(No. 41)
AVERAGE DISCHARGE, IN CUBIC FEET PER SECOND
JFMAMJ J ASOND
0
100,000
50,000
JFMAMJ J ASOND
0
300,000
100,000
200,000
TANANA RIVER AT NENANA, AK (1962-98)
(No. 56)
KOYUKUK RIVER AT HUGHES, AK (1961-82) (No. 66)
JFMAMJ J ASOND
0
60,000
20,000
40,000
WHITE RIVER AT ALASKA HIGHWAY
NEAR KOIDERN, YT (1975-96)
(No. 27)
(Lake)
(Lake)
(Snowmelt)
(Snowmelt)
(Snowmelt)
(Snowmelt)
(Snowmelt)
(Glacier)
(Glacier)

56 Environmental and Hydrologic Overview of the Yukon River Basin, Alaska and Canada
The discharge hydrographs of several stream-gaging stations
located along the main stem of the Yukon River (fig. 21) indicate
the contributions of the various rivers to the Yukon River. Most of
the increase in flow of the Yukon River between Carmacks and
Dawson is primarily from input from the White River and the
Stewart River. Between Eagle and Stevens Village, flow increases
from input from the Porcupine and Chandalar Rivers. The Yukon
River at Ruby includes input from the Tanana River, and the
Yukon River at Kaltag includes the inflow from the Koyukuk
River. Between Kaltag and Pilot Station, some of the flow of the
Yukon River goes into storage during June. Most of the area
between Kaltag and Pilot Station is low-lying wetlands.
The average discharge for the Yukon River at Pilot Station is
227,000 ft
3
/s, based on the period of record, 1976-96. Using the
discharge records for the main tributaries of the Yukon, the relative
contribution of discharge for each of the major drainage basins
was computed (table 7; fig. 22). The percentage of flow from the
two glacier basins, the Tanana and White, was higher than the per-
centage of their respective drainage areas (fig. 22). Conversely, the
percentage of flow from the Porcupine and Chandalar Rivers (non-
glacier basins) was less than the percentage of their drainage areas.
The waters of the Yukon River enter the Bering Sea and
move northward to the Arctic Ocean. Of the 10 largest inputs into
the Arctic Ocean, the Yukon River ranks fifth behind the Yenisei,
Ob, and Lena Rivers of Russia, and the Mackenzie River of Can-
ada, and contributes 8 percent of the total discharge to the Arctic
Ocean (fig. 23) (Aagaard and Carmack, 1989). Thus, the Yukon
River is a major contributor of water and solutes to the Arctic
Ocean and the Bering Sea ecosystems. Changes in the Yukon
River—either in flow or water quality—could influence these eco-
systems.
Table 7. Flow contributions of major drainage basins
to the Yukon River Basin
Basin
Flow
(cubic feet per
second)
Percentage of
Yukon River flow at
Pilot Station
Yukon Headwaters 11,500 5.1
Teslin River 11,800 5.2
Pelly River 14,000 6.2
Stewart River 16,400 7.2
White River 21,000 9.2
Upper Yukon 9,700 4.3
Porcupine River 22,000 9.7
Chandalar River 7,400 3.2
East Central Yukon 14,800 6.5
Tanana River 44,600 19.6
Koyukuk River 27,200 12.0
West Central Yukon 15,600 6.9
Lower Yukon 11,100 4.9
Total 227,000 100

Surface Water 57
0
800,000
100,000
200,000
300,000
400,000
500,000
600,000
700,000
AVERAGE DISCHARGE, IN CUBIC FEET PER SECOND
JFMAMJ J ASOND
Figure 21. Average discharge of the Yukon River at eight locations (see figure 18 for locations).
EXPLANATION
Yukon River at Carmacks (No. 18)
Yukon River above White River (No. 25)
Yukon River at Dawson (No. 35)
Yukon River at Eagle (No. 37)
Yukon River near Stevens Village (No. 43)
Yukon River at Ruby (No. 64)
Yukon River near Kaltag (No. 67)
Yukon River at Pilot Station (No. 68)

58 Environmental and Hydrologic Overview of the Yukon River Basin, Alaska and Canada
Headwaters Teslin Pelly Stewart White Upper Porcupine Chandalar ECentral Tanana Koyukuk WCentral Lower
MAJOR DRAINAGE BASIN
25
5
10
15
20
PERCENT
EXPLANATION
Percent Area
Percent Flow
0
Figure 22. Percent contributions of area and flow of the major drainage basins of the Yukon River
Basin.

Surface Water 59
60 Environmental and Hydrologic Overview of the Yukon River Basin, Alaska and Canada
Floods
Floods, as extreme hydrologic events, can affect water qual-
ity. The largest loads of many constituents from nonpoint sources
occur during flooding. Floodwaters may scour gravels and deposit
fine-grained sediment, damaging spawning beds for some fish
species. Floods also wash young juvenile fish out of the river.
In the Yukon River Basin, annual high flows for most of the
major rivers occur during the summer rainy season. However, on
the main stem of the Yukon, flooding commonly occurs from ice
jams in the spring. Although levees have been built at Dawson to
prevent flooding from ice jams, villages located along the lower
part of the Yukon River are still subject to flooding each spring.
The history of flooding in the Yukon River Basin is virtually
unknown before the establishment of a network of streamflow-
gaging stations in the late 1940’s and early 1950’s. A few identi-
fied historical floods in the upper Porcupine and Yukon Rivers
during the Pleistocene era were caused by the sudden release of
water from glacial lakes in the Yukon Territory (Thorson and
Dixon, 1983). In addition, a flood history of the Chena River at
Fairbanks began with a major flood in 1905. Since 1949, three
major floods have occurred in the Yukon River Basin: in 1964,
1967, and 1994. These floods covered large areas of the basin and
caused considerable property damage.
Flood of June and July 1964—Large snowpacks located in
the Yukon River Basin caused several streams to reach peak dis-
charges of record. The floods were caused by rapid snowmelt from
these large snowpacks and, in some places, by rain on water-satu-
rated snow. Flooding occurred mainly in sparsely populated areas
of the upper Yukon (in Alaska) and the Koyukuk River Basin. In
many small streams, peak discharges were minor; in others, if the
conditions of snow cover were right, peak discharges were the
largest of record. The dates of the peak discharges ranged from
early June to early July, depending on the air temperature, the
aspect and altitude of the contributing basins, and the dates of sub-
stantial rainfall.
Flood of August 12-18, 1967—Beginning on August 8,
1967, a series of widespread general rains occurred in the middle
and lower Tanana River Basin near Fairbanks. Locally, storm rain-
fall totaled 10 in., which is nearly the average annual precipitation
for the area. Floods of the Salcha River and the Chena River at
Fairbanks were extremely large, and the maximum discharge of
the Salcha River was almost twice that of a flood peak that has a
100-year recurrence interval (fig. 24). About 95 percent of Fair-
banks was under water (Childers and others, 1972). Nenana,
which is downstream from Fairbanks on the Tanana River, also
was inundated. This flood caused about $85 million in damage.
Flood of August 1994—Beginning on August 15, 1994,
severe storms began in western Alaska and moved eastward.
Flooding occurred in the Koyukuk River Basin when more than 5
in. of rain fell in the upper part of the basin (Meyer, 1995). A sec-
ond storm on August 24-27, with an additional 5 in. of rain, also
occurred in the upper part of the Koyukuk Basin. This storm
caused major flooding at Wiseman, washed out the Dalton High-
way in three places, and forced the evacuation of three villages
located along the Koyukuk River: Allakaket, Alatna, and Hughes.
These villages were declared disaster areas and approximately $70
million was needed to relocate Allakaket and Alatna to higher
ground. The peak discharge of the Koyukuk River was estimated
to have a recurrence interval of 100 years.
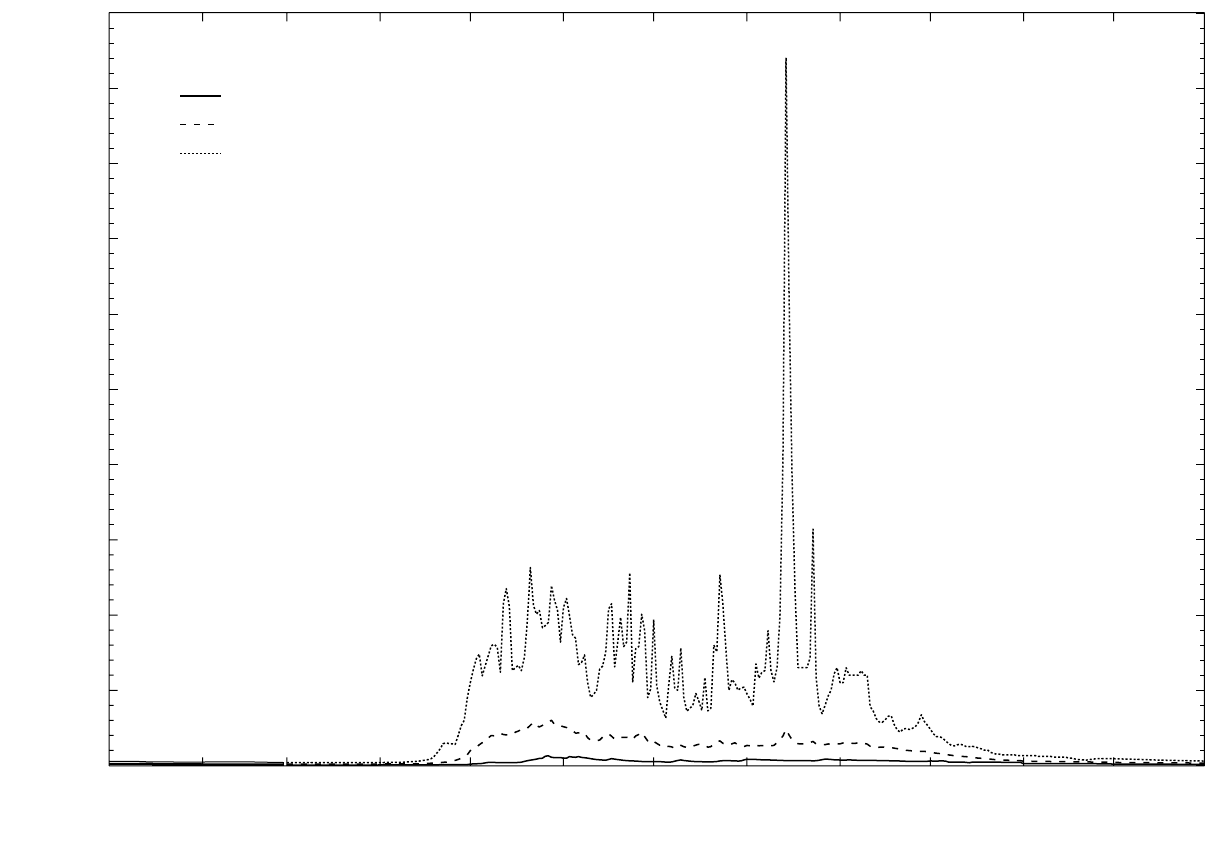
Surface Water 61
1967 Flood
MINIMUM DISCHARGE
MEAN DISCHARGE
MAXIMUM DISCHARGE
JFMAMJ J ASOND
0
100,000
10,000
20,000
30,000
40,000
50,000
60,000
70,000
80,000
90,000
DISCHARGE IN CUBIC FEET PER SECOND
Figure 24. Flow statistics of the Salcha River near Salchaket, Alaska (1949-98).
62 Environmental and Hydrologic Overview of the Yukon River Basin, Alaska and Canada
Droughts
Like floods, droughts are also extreme hydrologic events
that affect water quality. Droughts or deficit streamflows in the
Yukon River Basin primarily affect anadromous fish, which may
not have sufficient streamflow to migrate upstream to spawn, or
affect the eggs after spawning, which may not survive if they are
exposed as stream levels decline. During low flows, water temper-
atures of streams tend to increase and concentrations of dissolved
oxygen tend to decrease. Long periods of deficit rainfall com-
monly lead to declines in ground-water levels, which, in turn,
decrease baseflow of streams, decrease available supply from
small-yield wells, and lower water levels in lakes.
In the Yukon River Basin, annual low flow occurs during the
winter when there is no surface runoff and inflow is primarily from
ground water. During the runoff season, discharge is higher than in
the winter period even if snowfall and rainfall are below average.
In addition, glacier-fed streams add icemelt as input to a stream.
Thus, assigning a time period as a drought is somewhat subjective.
An approach used by Lamke (1991), which analyzes the departure
of the annual discharge from the long-term mean, provides a good
indication of the trend of streamflow. By analyzing the streamflow
at eight long-term gaging stations (fig. 25), four droughts or peri-
ods of deficit flow were identified in the Yukon River Basin since
1949.
Drought of 1950-57—Most of the upper Yukon River Basin
and the upper Tanana River Basin were affected during this period.
The drought was less severe farther west along the Alaska Range.
On the main stem of the Yukon River, deficit flows began in June
1950 at Eagle (fig. 25A). The cumulative deficit in the almost 7
years of drought was equivalent to about 1 year of average flow.
Drought of 1969-70—This period of low flow affected pri-
marily the Alaska part of the Yukon River Basin. The largest def-
icit flow for the period of record occurred on the Koyukuk River
at Hughes (fig. 25B). Deficit flow was also evident on the Tanana
River (fig. 25C) and the lower part of the Yukon River at Ruby
(fig. 25D).
Drought of 1973-80—This period is considered to be the
most severe low flow period in terms of deficit flow and length.
Similar to the 1969-70 period, only the Alaska part of the Yukon
River Basin was affected (the records from Whitehorse to Eagle
(fig. 25E, F, A) do not indicate any trend). The Koyukuk and
Tanana Rivers (fig. 25B, C) and the lower part of the Yukon River
were most affected.
Drought of 1996 to present—In the winter of 1995-96,
snowfall was significantly less than normal in large parts of the
Yukon River Basin. Relatively large deficit flows occurred along
the Yukon River above the White River, at Eagle, near Stevens Vil-
lage, and at Pilot Station (fig. 25F, A, G, H) and on the Tanana
River (fig. 25C). For three stations where flow data are available
(the Yukon River at Eagle and near Stevens Village, and the
Tanana River at Nenana, figs. 25A, G, C) deficit flows again
occurred in 1998, which may signal another period of low flow.

Surface Water 63
Figure 25. Departure from average discharge for several long-term streamflow-gaging stations in the Yukon River Basin (refer to figure 18
for locations).
G
D
Yukon River near Stevens Village
Yukon River at Ruby
Koyukuk River at Hughes
Yukon River at Pilot Station
1940
-40,000
40,000
-20,000
0
20,000
1940
-10,000
10,000
-5,000
0
5,000
20001960 1980
YEAR
1940 20001960 1980
YEAR
-40,000
80,000
-20,000
0
20,000
40,000
60,000
1940
-60,000
40,000
-40,000
-20,000
0
20,000
20001960 1980
YEAR
20001960 1980
YEAR
B
H
1940
-4000
4000
-2000
0
2000
DEPARTURE FROM MEAN, IN CUBIC FEET PER SECOND
-40,000
40,000
-20,000
20,000
10,000
Yukon River at Whitehorse Yukon River above White River
Yukon River at Eagle
E
F
A
C
1940
-15,000
20,000
-10,000
-5000
0
5000
10,000
15,000
20001960 1980
YEAR
20001960 1980
YEAR
1940 20001960 1980
YEAR
1940 20001960 1980
YEAR
-10,000
-5000
5000
0
0
Tanana River at Nenana

64 Environmental and Hydrologic Overview of the Yukon River Basin, Alaska and Canada
Sediment
Sediment is an important water-quality constituent. Particle
size determines to a large extent whether a stream carries the sed-
iment as suspended load or as bedload. Elevated suspended-sedi-
ment concentrations can adversely affect aquatic life by clogging
gills, covering fish spawning sites, or by altering habitat of benthic
organisms (U.S. Environmental Protection Agency, 1977). Metals
and organic contaminants also commonly adsorb on suspended
sediment (U.S. Environmental Protection Agency, 1977).
Collection of suspended-sediment samples in the Canadian
part of the Yukon River Basin began in 1970 by Environment Can-
ada as part of a basic monitoring program (Russ Gregory, Environ-
ment Canada, written commun., 1998). Samples have been
collected during various years at six sites (table 8) that represent
the major basins in the Canadian part of the Yukon. In most years,
three suspended-sediment samples were collected at these sites
during the open-water season. Currently, sediment samples are
collected at four sites each year.
Map
No.
(fig.
18)
USGS
Station
No.
Name
Period
of
record
Canada
9 15305000 Yukon River at Whitehorse, YT 1970-77
24 15305420 Pelly River at Pelly Crossing, YT 1970-
25 15305450 Yukon River above White River near Dawson, YT 1977-
27 15305540 White River at Alaska Highway near Koidern, YT 1975-
31 15305650 Stewart River at mouth, YT 1968-
35 15305700 Yukon River at Dawson, YT 1971-79
Alaska
37 15356000 Yukon River at Eagle, AK 1954-79
40 15389000 Porcupine River near Fort Yukon, AK 1967-75
41 15389500 Chandalar River near Venetie, AK 1967-75
44 15468000 Yukon River at Rampart, AK 1954-67
45 15470000 Chisana River at Northway Junction, AK 1953-67
46 15476000 Tanana River near Tanacross, AK 1953-75
48 15478000 Tanana River at Big Delta, AK 1971
Map
No.
(fig.
18)
USGS
Station
No.
Name
Period
of
record
Alaska--Continued
49 15484000 Salcha River near Salchaket, AK 1967-76
50 15485500 Tanana River at Fairbanks, AK 1975-82
51 15493000 Chena River near Two Rivers, AK 1968-71
52 15493500 Chena River near North Pole, AK 1972-75
54 15514000 Chena River at Fairbanks, AK 1954-75
55 15514500 Wood River near Fairbanks, AK 1968-73
56 15515500 Tanana River at Nenana, AK 1966-96
59 15518000 Nenana River near Healy, AK 1953-68
63 15564600 Melozitna River near Ruby, AK 1967-72
64 15564800 Yukon River at Ruby, AK 1968-73
65 15564875 Middle Fork Koyukuk River near Wiseman, AK 1971-73
66 15564900 Koyukuk River at Hughes, AK 1966-72
68 15565447 Yukon River at Pilot Station, AK 1975-96
Table 8. Suspended-sediment stations in the Yukon River Basin
Sediment 65
Collection of suspended-sediment data in the Yukon River
Basin in Alaska began in 1953 (table 8). For the next decade, most
of the sediment data-collection effort focused on two rivers, the
Tanana River near Tanacross and the Nenana River near Healy. At
these two sites, daily suspended-sediment samples were collected
during the 4 to 5 months of the runoff season, May to September.
In 1962, daily suspended-sediment sample collection also began at
two more stations, Yukon River at Eagle and Chena River at Fair-
banks. For the next 5 years, daily sediment samples were collected
through most of the runoff seasons at all four stations. Sampling
was discontinued at three of the stations at the end of the 1966
water year. At the remaining station, Chena River at Fairbanks,
daily sampling continued until 1971. Since 1971, no daily sus-
pended-sediment sampling programs have been undertaken.
In 1967, the focus of sediment sampling in the Alaskan part
of the Yukon basin shifted from daily samplings at a few selected
stations to sporadic samplings at a larger number of stations (table
8). This program consisted of collecting three to five sediment
samples (ideally, one per month) through the runoff season at
about 12 stations in the Alaskan part of the Yukon River Basin.
This program lasted only a few years and essentially ended by the
end of 1975.
The most recent phase of sediment data collection, from the
late 1970’s until 1996, has centered on two stations supported by
the USGS National Stream Quality Accounting Network
(NASQAN) program, the Tanana River at Nenana and the Yukon
River at Pilot Station. Although only a few samples were collected
each year, the length and consistency of these sampling efforts
give added value to the sediment data. Also, from 1977-82, bed-
load data were collected along a reach of the Tanana River near
Fairbanks
Records of all the suspended-sediment measurements are
available in USGS publications (U.S. Geological Survey 1954-62,
1971, 1976, 1972-75, 1976-96). Data are also stored in electronic
format in the USGS National Water Information System (NWIS).
Bedload data for the Tanana River are available in reports by Bur-
rows (1980), Burrows and others (1979, 1981), Burrows and Har-
rold (1983), Emmett and others (1978), and Harrold and Burrows
(1983). Data from the Canadian Yukon are published in the series
“Sediment Data: Canadian Rivers,” issued by the Water Survey of
Canada and are also available in electronic format from the world-
wide web (http://www.ec.gc.ca/water/index.htm).
Sources of Sediment
Sediment in streams and rivers is the result of natural ero-
sion, a process that can be accelerated by land cover disturbance
such as mining. In the Yukon River Basin, the sources of and sub-
sequent erosion of sediment are due primarily to natural factors.
However, distinctions can be made depending on whether a partic-
ular river is non-glacier fed or glacier fed.
Non-glacier-fed tributaries of the Yukon River have beds
composed of sand, gravel, and cobbles. The coarser material is
found in the upper reaches of these rivers and the finer material in
the lower reaches. Banks consist of poorly sorted cobbles and
gravel in the steep upper reaches, but change to sand and gravel in
the lower reaches. River channels are braided in the upper reaches,
but become less pronounced as the river becomes less steep and
sediment is deposited in the lower reaches. Bed material is gradu-
ally sorted and rounded progressively downstream and consists of
gravel and cobbles in the thalweg and gravel and sand on the bars.
66 Environmental and Hydrologic Overview of the Yukon River Basin, Alaska and Canada
Glacier-fed rivers in the Yukon River Basin have vast quan-
tities of unconsolidated material downstream from the glacier ter-
mini. These rivers have wide flood plains cut with braided
channels. Boulders, cobbles, gravel, sand, and large quantities of
fine silt make up the streambank and bed, and provide a ready
source of sediment. Streambanks are barren with little vegetation
and have large boulders rounded from the previous advances of the
glacier. Steep reaches create high stream velocity, which transports
gravel and cobble-size material downstream as bedload, and sand
and silt in suspension. Braiding is pronounced and extends far
downstream because of high sediment loads.
As in non-glacier-fed streams, material is sorted downriver
in the main channels of glacier-fed rivers as the slope of the river
decreases. When flows are low enough for bars to be visible, most
bars are covered with silt and fine sand, deposited on recession
from higher flows. The fine sediment in suspension from the gla-
cier basins may be transported even at low flows, but the within-
channel deposits augment the sediment load at higher flows.
Except where constrained by bedrock walls, broad alluvial plains
left from the last glacial retreat characterize the valleys down-
stream from the montane regions. In the Yukon River Basin, these
areas are large wetlands that are cut by numerous old channels and
sloughs, and covered with tussocks, brush, willows, aspen, birch,
and spruce trees.
In areas of the Yukon River Basin where permafrost is dis-
continuous, riverbanks may be perennially frozen at depth and
overlain with a seasonally frozen layer of organic material and
vegetation. This condition creates an additional source of sediment
in the summer when the permafrost is thermally eroded by flowing
water. The result is undercut banks, overhanging vegetation, and
finally failure of the upper bank, causing trees, brush, and sedi-
ment to fall into the river.
Suspended-Sediment Concentrations
Suspended-sediment concentration data are available for
most of the major tributaries to the Yukon River and for several
sites along the Yukon River itself. These data were summarized
graphically by the use of boxplots (fig. 26). Although only a lim-
ited number of samples have been collected at some sites, general
observations can still be made.
Most of the measured suspended-sediment concentrations
for the main stem of the Yukon River were less than 1,000 mg/L.
The two major glacier-fed rivers, the White and the Tanana, had
the highest concentrations. Concentrations at the Yukon River at
Whitehorse, the farthest upstream site, were all less than 50 mg/L.
Going downstream, the median sediment concentrations in the
Yukon River at Dawson and at Eagle were higher, reflecting the
input of the White River. From Eagle to Rampart, no major
changes in median concentration seemed apparent until Ruby. At
this site, the median concentration was higher, reflecting the input
from the Tanana River. From Ruby to Pilot Station, the median
concentration decreased slightly.
A number of analyses show that virtually all sediment parti-
cles carried in suspension in the Yukon River and its main tributar-
ies are finer than 0.5 mm. Within the suspended sand fraction
itself, 90 percent is finer than 0.25 mm—that is, between 0.062
and 0.25 mm in nominal diameter. For some sites, a number of
complete particle-size analyses indicate that grain size consists
predominantly of silt and clay (table 9).

Sediment 67
Whitehorse Pelly Above
White
White Stewart Dawson Eagle Porcupine Chandalar Rampart Tanana Ruby Hughes Pilot
1
10,000
2
5
10
20
50
100
200
500
1000
2000
5000
SUSPENDED-SEDIMENT CONCENTRATION, IN MILLIGRAMS PER LITER
(10)
(44)
(12)
(48)
(28)
(14)
(31)
(14)
(15)
(8)
(104)
(22)
(25)
(74)
Figure 26. Boxplots of suspended-sediment concentrations at 14 sites in the Yukon River Basin.
Number of observations
75th percentile
Median
25th percentile
Outlier data value less than or equal to 3 and more than
1.5 times the interquartile range outside the quartile
Data value less than or equal to 1.5 times the
interquartile range outside the quartile
Pilot Station name designation
(74)
EXPLANATION

68 Environmental and Hydrologic Overview of the Yukon River Basin, Alaska and Canada
Relation Between Suspended-Sediment Concentration and
Water Discharge
Suspended-sediment concentrations in the Yukon River and
most of its tributaries generally increase with increasing water dis-
charge, although a high correlation does not always exist (fig. 27).
Much of the scatter of points is related to the well-known “clock-
wise-looped” relation (Meade and others, 1990, p. 257), in which
sediment concentrations measured while a river is rising are usu-
ally higher than those measured at the same water discharges as
the river is falling. The clockwise-looped relation is usually
explained as showing a depletion effect: fine-grained sediment,
which is stored on the bed or along the banks of river channels dur-
ing low-water periods, is in plentiful supply as the river begins to
rise, but the stored material is soon resuspended, and it eventually
becomes depleted as (or before) the river reaches its maximum
discharge. Additionally, the particle-size distribution of the sus-
pended sediment may influence the correlation with water dis-
charge (fig. 28). For example, concentrations of suspended sand
are less correlated with water discharge than concentrations of sus-
pended silt and clay.
In rivers that directly drain the montane regions of the Yukon
River Basin, the concentrations and discharges of sediment are
coupled closely with water discharge. For example, at the Tanana
River near Tanacross (fig. 29A), each pulse of increased water dis-
charge is accompanied by an increase in sediment concentrations.
The closeness of this correlation suggests either that the sources of
water and sediment are identical (melting glaciers, perhaps) or that
large quantities of excess sediment are stored in the system wait-
ing to be mobilized by each pulse of water discharge.
Farther from the montane sources, the correlations between
daily water discharges and sediment concentrations become
weaker. The Yukon River at Eagle (fig. 29B), demonstrates a
poorer relation with water discharge than that shown for the
Tanana River near Tanacross. Sediment concentrations are gener-
ally highest between mid-July and mid-August, a month or more
after the greatest discharge of water. At this location on the Yukon
main stem, the most likely source of large concentrations of sus-
pended sediment is the White River and its tributaries that drain
the Wrangell–St. Elias Mountains.
Table 9. Mean grain-size composition of suspended sediment for
stations in the Yukon River Basin
Map
No.
(fig.
18)
USGS
Station
No.
Name
No. of
sam-
ples
Percentage
Clay Silt Sand
24 15305420 Pelly River at Pelly Crossing, YT 30 18 48 34
25 15305450 Yukon River above White River
near Dawson, YT
9355114
27 15305540 White River at Alaska Highway
near Koidern, YT
141284626
31 15305590 Stewart River at mouth, YT 19 21 57 22
37 15355600 Yukon River at Eagle, AK 8 34 50 16
44 15468000 Yukon River at Rampart, AK 7 26 50 24
68 15565447 Yukon River at Pilot Station, AK 5 26 53 21

Sediment 69
100 100,0001000 10,000
1
10,000
10
100
1000
100 100,0001000 10,000
WATER DISCHARGE, IN CUBIC FEET PER SECOND
1
10,000
10
100
1000
Chena River at Fairbanks
Figure 27. Water discharge and suspended-sediment concentrations for Chena River at
Fairbanks, Alaska, and Nenana River near Healy, Alaska, for 1964-66 runoff seasons.
Nenana River near Healy
SUSPENDED-SEDIMENT CONCENTRATION, IN MILLIGRAMS PER LITER

70 Environmental and Hydrologic Overview of the Yukon River Basin, Alaska and Canada
1000 100,00010,000
10
10,000
20
50
100
200
500
1000
2000
5000
SUSPENDED-SEDIMENT CONCENTRATION, IN MILLIGRAMS PER LITER
1000 100,00010,000
TANANA RIVER NEAR TANACROSS, 1954
1000 100,00010,000
EXPLANATION
Clay
10
10,000
20
50
100
200
500
1000
2000
5000
EXPLANATION
Silt
10
10,000
20
50
100
200
500
1000
2000
5000
EXPLANATION
Sand
10,000 100,00020,000 50,000
10
10,000
20
50
100
200
500
1000
2000
5000
10,000 100,00020,000 50,000 10,000 100,00020,000 50,000
10
10,000
20
50
100
200
500
1000
2000
5000
10
10,000
20
50
100
200
500
1000
2000
5000
EXPLANATION
Clay
INSTANTANEOUS DISCHARGE, IN CUBIC FEET PER SECOND
EXPLANATION
Silt
EXPLANATION
Sand
Figure 28. Instantaneous discharge and suspended-sediment concentrations for different particle sizes for Tanana River near
Tanacross, Alaska, and Tanana River at Fairbanks, Alaska.
TANANA RIVER AT FAIRBANKS, 1975, 1977-78

Sediment 71
Discharge
Suspended sediment
0
40,000
10,000
20,000
30,000
0
300,000
100,000
200,000
WATER DISCHARGE, IN CUBIC FEET PER SECOND
0
5,000
0
1,000
2,000
3,000
4,000
SUSPENDED-SEDIMENT CONCENTRATION, IN MILIGRAMS PER LITER
May June July Aug Sept
0
5,000
0
1,000
2,000
3,000
4,000
Discharge
Suspended sediment
B. Yukon River at Eagle
May June July Aug Sept
Figure 29. Average daily water discharge and suspended-sediment
concentration for Tanana River near Tanacross, Alaska, and Yukon
River at Eagle, Alaska, during 1963 runoff season.
A. Tanana River near Tanacross

72 Environmental and Hydrologic Overview of the Yukon River Basin, Alaska and Canada
Suspended-Sediment Discharge
The most striking characteristic of sediment discharge in the
Yukon River Basin is its seasonality. More than 95 percent of all
the sediment discharged during an average year is moved during
the months of May through September (fig. 30). In some
instances, more than half of the suspended-sediment load may be
transported in 10 percent of the year during high flows (Burrows
and others, 1981) As conveyors of sediment, the rivers are virtu-
ally dormant during the other seven months, October through
April. In its annual cycle of warm-season flow and cold-season
freeze-up, the entire river system shuts down and goes into stor-
age mode in autumn, to be reactivated and remobilized in late
spring or early summer. Although some degree of seasonality is
typical of most large rivers elsewhere, in temperate and even trop-
ical regions, it is especially pronounced in the arctic and subarctic
rivers.
Chena River at Fairbanks
(1964-66)
Nenana River near Healy
(1964-66)
Tanana River near Tanacross
(1954, 1964-66)
0
50
10
20
30
40
0
50
10
20
30
40
PERCENT OF ANNUAL
SUSPENDED-SEDIMENT DISCHARGE
0
50
10
20
30
40
Jan Feb Mar Apr May Jun Jul Aug Sep Oct Nov Dec
Jan Feb Mar Apr May Jun Jul Aug Sep Oct Nov Dec
Jan Feb Mar Apr May Jun Jul Aug Sep Oct Nov Dec
Figure 30. Seasonal distributions of suspended-sediment
discharge for three rivers in the Tanana River Basin.
PERCENT OF ANNUAL
SUSPENDED-SEDIMENT DISCHARGE

Sediment 73
Differences in sediment discharge
from the rivers in the Yukon River Basin
depend on the type of watershed. A quantita-
tive comparison of montane (glacier) versus
lowland (non-glacier) sediment loads is pro-
vided by the extensive records collected in
the Nenana River near Healy and the Chena
River at Fairbanks. Especially useful are the
year-long records of daily sediment dis-
charge measured (and partially estimated) at
both stations during three consecutive water
years, 1964-66 (U.S. Geological Survey,
1970-71a). Although the daily values for the
seven coldest months (October to April)
were mostly estimated, the estimation proce-
dures entailed only a small error overall
because cold-weather discharge constitutes
such a small proportion of the totals for the
year.
Contrasts in water discharge and sedi-
ment load shown by the two records are
striking (fig. 31). Although the drainage
areas above the two gaging stations differ by
only 4 percent, the water discharge from the
montane area (Nenana River) was 2.5 times
greater than that from the lowland area
(Chena River). Furthermore, sediment load
from the Nenana River Basin was 30 times
the sediment load from the Chena River
Basin. Reasons for the greater water dis-
charges from montane areas are most likely
the greater precipitation that falls at higher
altitudes, and the partial but significant cov-
erage of the drainage area by glaciers that
contribute a steady flow of meltwater during
0
14,000
2000
4000
6000
8000
10,000
12,000
AVERAGE MONTHLY DISCHARGE,
IN CUBIC FEET PER SECOND
EXPLANATION
Nenana River
(1,910 square miles)
Chena River
(1,980 square miles)
Jan Feb Mar Apr May Jun Jul Aug Sep Oct Nov Dec
0
1,500,000
500,000
1,000,000
MONTHLY SUSPENDED-SEDIMENT LOAD,
IN TONS
EXPLANATION
Nenana River
(1,910 square miles)
Chena River
(1,980 square miles)
Jan Feb Mar Apr May Jun Jul Aug Sep Oct Nov Dec
MONTH
Figure 31. Differences in water discharge and suspended-sediment load during
water years 1964-66 for Nenana River near Healy, Alaska and Chena River at
Fairbanks, Alaska.

74 Environmental and Hydrologic Overview of the Yukon River Basin, Alaska and Canada
warmer months. Reasons for the greater sediment discharges are
the more intensive tectonism in the montane areas, producing such
features as over-steepened slopes on fractured bedrock, and more
coverage by glaciers, whose basal grindings greatly increase the
rates of mechanical erosion.
The particle-size distribution of the sediment load varies dur-
ing the runoff season. Sand may compose half or more of the sed-
iment in suspension in some river reaches during the early and
later months of the runoff season when overall concentrations are
lower (fig. 32). However, it composes only one-third to one-quar-
ter (considerably less, at times) of the sediment in suspension in
mid-season when total suspended concentrations are usually high-
est.
Using the available suspended-sediment data, annual sedi-
ment loads were determined for most of the major drainage basins
of the Yukon River. A method described by Colby (1956) was used
to compute the annual suspended-sediment loads for these rivers.
This method requires defining a relation between instantaneous
sediment discharge and water discharge and applying this relation
to daily discharge. Also, it was assumed that the sediment data rep-
resent today’s conditions, and that no interim changes in climate,
land use, and other factors have significantly altered sediment
0
300,000
100,000
200,000
SUSPENDED-SEDIMENT DISCHARGE,
IN TONS PER DAY
3-25 6-1 6-16 7-1 7-7 7-13 7-19 7-25 8-1 8-11 8-21 9-1 9-16
MONTH AND DAY
Figure 32. Changing proportions of suspended-sediment discharge during
1954 runoff season in Tanana River near Tanacross, Alaska.
EXPLANATION
Silt and Clay
Sand

Sediment 75
yields during the last several decades. The sediment loads are con-
sidered to be subject to large errors since they are based mostly on
limited data. However, they provide some insight on the sus-
pended-sediment characteristics of the Yukon River Basin.
Approximately 60 million tons of suspended sediment are
transported annually by the Yukon River at Pilot Station near its
mouth (table 10; fig. 33). The overwhelming importance of source
areas in the Alaska Range drained by tributaries of the Tanana
River, and of the Wrangell–St. Elias Mountains drained by the
White River and its tributaries is clearly shown. All other tributar-
ies flowing from the Brooks Range and the more lowland areas of
the Yukon Basin contribute fairly minor quantities of sediment.
Thus, the Yukon River functions mainly as a conveyance system
that gathers sediment from the high mountain ranges and trans-
ports it hundreds, even thousands, of miles to the Bering Sea.
Storage of Sediment
At Ruby, about 450 mi upstream from Pilot Station, the
Yukon River transports about 66 million tons of suspended sedi-
ment per year, about 6 million tons more than at Pilot Station (table
10). The Koyukuk River adds 2 million tons to the Yukon below
Ruby (table 10). Some of the sediment load is probably deposited
on the flood plains and delta plains that lie along the Yukon
between Ruby and Pilot Station. Deposition of sediment is
expected because part of the water discharge of the Yukon River
goes into storage during the runoff season.
A similar calculation can be made for the approximately
200-mile-long reach of the Yukon between Rampart and Ruby.
The river transports about 33 million tons of sediment past Ram-
part during an average year. About 68 mi below Rampart, the
Tanana River adds another 38 million tons, bringing the total to 71
million tons annually. Comparing this total to the 66 million tons
measured at Ruby suggests that a quantity of about 5 million tons
of sediment is being deposited out of the channel each year, most
likely in the flood plain that fringes the south side of the Yukon River
below its confluence with the Tanana River.
The segment of the Yukon River between Eagle and Rampart is
also a significant reach for sediment storage. Average annual sedi-
ment loads at Eagle and Rampart are virtually identical at 33 million
tons despite two intervening tributaries, the Porcupine and Chandalar
Rivers, that annually contribute another 9 million tons of sediment
between the two main stem stations. In addition, the drainage area of
the Yukon increases about 75 percent. The Eagle-Rampart reach
includes Yukon Flats, an enormous tectonically controlled lowland,
that can easily accept and store sediment.
Table 10. Estimated annual suspended-sediment loads for
selected sites in the Yukon River Basin
Map
No.
(fig.
18)
USGS
Station No.
Name
Annual load
(tons)
9 15305000 Yukon River at Whitehorse, YT 62,000
24 15305420 Pelly River at Pelly Crossing, YT 1,200,000
25 15305450 Yukon River above White River near Dawson, YT 3,500,000
27 15305540 White River at Alaska Highway near Koidern, YT 16,000,000
31 15305590 Stewart River at the mouth, YT 1,000,000
35 15305700 Yukon River at Dawson, YT 33,000,000
37 15356000 Yukon River at Eagle, AK 33,000,000
40 15389000 Porcupine River at Fort Yukon, AK 8,000,000
41 15389500 Chandalar River near Venetie, AK 1,000,000
44 15468000 Yukon River at Rampart, AK 33,000,000
56 15515500 Tanana River at Nenana, AK 38,000,000
64 15564800 Yukon River at Ruby, AK 66,000,000
66 15564900 Koyukuk River at Hughes, AK 2,000,000
68 15565447 Yukon River at Pilot Station, AK 60,000,000

76 Environmental and Hydrologic Overview of the Yukon River Basin, Alaska and Canada
In summary, the Yukon River system is depositing and stor-
ing an average annual net quantity of about 20 million tons of sed-
iment between the principal montane sources and the sea, most
likely on fringing flood plains and in braided reaches of the river.
This net quantity represents a minimum because riverbank erosion
is not included in the sediment budget. If bank erosion is, in fact,
a significant contributor of sediment to the Yukon River, as it is in
other large rivers (Dunne and others, 1998, for example), then a
balanced budget would require even greater quantities of sediment
to be leaving the river channel and being stored in the flood plains
and meander bars.
70
10
20
30
40
50
60
ANNUAL SUSPENDED-SEDIMENT LOAD, IN MILLIONS OF TONS
EXPLANATION
Yukon River station
Major tributary to Yukon River
0
Whitehorse Pelly Above
White
White Stewart Dawson Eagle Porcupine Chandalar Rampart Tanana Ruby Koyukuk Pilot
STATION
Figure 33. Annual suspended-sediment loads for 14 sites located in the Yukon River Basin.

Sediment 77
Although the sediment load numbers are approximate and
subject to large errors (they are based mostly on limited data), it is
evident that a large proportion of the total sediment being trans-
ported out of the principal (mostly montane) source areas is not
reaching the sea within the same year, decade, or even century. At
least one-quarter, perhaps one-third, of the sediment is being
deposited along the way, mostly as overbank sediment on the
extensive flood plains that fringe large reaches of the Yukon River.
Implications of this factor are enormous for the sequestration of
organic carbon, contaminants, and other materials that are
absorbed onto, or otherwise associated with, alluvial sediments.
Bedload
The only known area in the Yukon River Basin where bed-
load transport has been measured intensively is the Tanana River
at Fairbanks. This site represents one of the few large rivers in the
world where bedload has been measured directly by sampling
rather than computed by standard formulas. At this site, bedload is
equivalent to one or two percent of suspended load (fig. 34). This
proportion is well within the error of suspended-load measurement
and therefore is not usually included in any accounting of total
sediment transport. Although bedload movement is important in
the formation and stability of river channels, it is not a significant
part of the overall sediment load.
100
1,000,000
1000
10,000
100,000
SUSPENDED-SEDIMENT AND BEDLOAD DISCHARGE,
IN TONS PER DAY
EXPLANATION
Suspended-Sediment
Bedload
1000 100,0002000 5000 10,000 20,000 50,000
WATER DISCHARGE, IN CUBIC FEET PER SECOND
Figure 34. Suspended-sediment and bedload discharges measured in the Tanana River
at Fairbanks, Alaska, 1977-82 (data from Burrows, 1981; Burrows and Harrold, 1983).
78 Environmental and Hydrologic Overview of the Yukon River Basin, Alaska and Canada
Water Quality
The water quality of the Yukon River Basin is important for
many reasons. Residents who live along the main stem of the
Yukon or its tributaries use the surface water for drinking. Salmon
and other fish species require adequate water quality for their sur-
vival as does the abundant wildlife present in the basin.
Water-quality samples have been collected at more than 400
sites in the Yukon River Basin (fig. 35). In the Canadian part of the
Yukon, Environment Canada began collecting water-quality data
in 1980. Water chemistry samples were generally analyzed for
nutrients and major ions. Some samples were analyzed for organic
carbon and trace elements. Common field properties (water tem-
perature, specific conductance, pH, and dissolved oxygen) were
usually collected at the time of sampling. Currently, Environment
Canada is not collecting water-quality samples in the Yukon River
Basin.
In the Alaska part of the Yukon River Basin, water-quality
sampling began in the 1950’s. Many of the sites were sampled only
once and some of the samples were collected by other Federal
agencies or residents of a village who provided the results to the
USGS. Before and during the construction of the trans-Alaska oil
pipeline in the 1970’s, water-quality samples were collected at
many sites along the route of the pipeline (fig. 35). In the mid to
late 1970’s, when the USGS implemented the NASQAN program,
three sites were established in the Yukon River Basin: the Yukon
River at Eagle, the Tanana River at Nenana, and the Yukon River
at Pilot Station. The site at Eagle was operated from 1978-79,
whereas the sites at Pilot Station and Nenana were operated from
1976-96. Currently, no water-quality samples are collected rou-
tinely by the USGS in the Yukon River Basin.
To gain a basic understanding of the water-quality character-
istics of streams in the Yukon River Basin, the existing water-qual-
ity data were analyzed. Before the interpretive analysis of the data
began, efforts were made to assess the quality and type of the data.
The water-quality data were not obtained using the same collec-
tion techniques at all sites. Laboratory analytical methods have
improved in recent years, resulting in lower detection limits for
some analytes. In addition, the distribution of sites is uneven and
site density is greater in the eastern and southern part of the Yukon
River Basin than in the northern and western parts (fig. 35). The
set of chemical determinations was not uniform for all sites, the
period of record differs for each site, and the data are not always
distributed over the entire hydrologic cycle. Although somewhat
subjective, only sites that had 10 or more samples were used in the
analysis (fig. 36; table 11). Despite these limitations, the data pro-
vide an interesting description of both the main stem of the Yukon
River and some its major tributaries.
Similar to the suspended-sediment data, records of all water-
quality measurements are available in USGS publications (U.S.
Geological Survey 1954-62, 1971, 1976, 1972-75, 1976-97). Data
are also stored in electronic format in the USGS National Water
Information System (NWIS). Water-quality data from the Cana-
dian Yukon are available in electronic format from the world wide
web (http://www.ec.gc.ca/water/index.htm).

Water Quality 79
WATER QUALITY SITES (AT LEAST 1 SAMPLE)
Figure 35. Location of water-quality sampling stations where one or more samples have been collected in the Yukon River Basin.
TRANS-ALASKA PIPELINE
0
0 100
100
200
200
300 KILOMETERS
300 MILES

80 Environmental and Hydrologic Overview of the Yukon River Basin, Alaska and Canada
Figure 36. Location of water-quality sampling stations where 10 or more samples have been collected in the Yukon River Basin (see table 11 for station names).
Alaska Range
Boreal Mountains and Plateaus
Brooks Range
Eagle Plains
Interior Bottomlands
Interior Forested Lowlands & Uplands
Interior Highlands
Mackenzie Mountains
Ogilvie Mountains
Old Crow Flats
Pelly Mountains
Ruby Ranges
Selwyn Mountains
Subarctic Coastal Plains
Wrangell Mountains
Yukon Flats
Yukon Plateau Central
Yukon Plateau North
Yukon Southern Lakes
Yukon Stikine Highlands
70
69
67
68
66
64-65
27
26
63
24
25
23
22
62
48-51
46-47
54
53
56-61
21
20
52
39,40,44,45
35-38
55
32
29
28
33
34
31
30
41
43
42
18
19
16
15
17
8
9-11
6
7
4-5
3
2
1
13
12
14
WATER QUALITY SITES (10 SAMPLES OR MORE) AND ECOREGIONS
Other
0
0 100
100
200
200
300 KILOMETERS
300 MILES

Water Quality 81
Table 11. Water-quality stations in the Yukon River Basin with 10 or more years of record
[--, watershed drains more than two ecoregions]
Map No.
(fig. 36)
USGS
station No. or
latitude/longitude
Station name
Primary ecoregions drained
by watershed
1 15304850 Wheaton River near Carcross, YT Yukon Stikine Highlands
2 6016421350156 Wheaton River at Annie Lake Road, YT Yukon Stikine Highlands
3 6025001345300 Watson River at Annie Lake Road, YT Yukon Southern Lakes
4 15305000 Yukon River at Whitehorse, YT --
5 6036231345646 Wolf Creek at Alaska Highway near Whitehorse, YT Yukon Southern Lakes
6 15305050 Takhini River near Whitehorse, YT Yukon Southern Lakes
7 6050301351103 Takhini River at Klondike Highway, YT Yukon Southern Lakes
8 15305100 Yukon River above Frank Creek, YT --
9 6106151351730 Fox Creek at Klondike Highway, YT Yukon Southern Lakes
10 6104001351300 Deep Creek at Klondike Highway, YT Yukon Southern Lakes
11 6058451351030 Horse Creek at Klondike Highway, YT Yukon Southern Lakes
12 15305150 Swift River near Swift River, BC Boreal Mountains and Plateaus
13 15305250 Teslin River near Teslin, YT Boreal Mountains and Plateaus
14 5958181311439 Partridge Creek at mile 734 Alaska Highway, YT Boreal Mountains and Plateaus/Pelly Mountains
15 15305350 Yukon River at Carmacks, YT --
16 15305420 Pelly River at Pelly Crossing, YT Yukon Plateau North/ Selwyn Mountains
17 6211111331108 Blind Creek at Faro, YT Yukon Plateau North/Pelly Mountains
18 6339281355530 Mayo River at Power Dam, YT Yukon Plateau North/Pelly Mountains
19 15305620 Stewart River at Stewart Crossing, YT Yukon Plateau North/ Selwyn Mountains/Mackenzie
Mountains
20 15305698 Klondike River above Bonanza Creek near Dawson, YT Yukon Plateau North/Mackenzie Mountains
21 15348000 Fortymile River near Steele Creek, AK Interior Highlands
22 15356000 Yukon River at Eagle, AK --
23 15388950 Porcupine River at Old Crow, YT Eagle Plains/Old Crow Flats/Oglivie Mountains

82 Environmental and Hydrologic Overview of the Yukon River Basin, Alaska and Canada
24 15389500 Chandalar River near Venetie, AK Brooks Range
25 15439800 Boulder Creek near Central, AK Interior Highlands
26 15457800 Hess Creek near Livengood, AK Interior Forest Lowlands and Uplands
27 15468000 Yukon River at Rampart, AK --
28 15470000 Chisana River at Northway Junction, AK Wrangell Mountains/Interior Bottomlands
29 15472000 Tanana River near Tok Junction, AK Wrangell Mountains/Interior Bottomlands
30 15473500 Little Tok River near Tok Junction, AK Alaska Range
31 15473900 Tok River on Slana Tok Highway near Tok Junction, AK Alaska Range
32 15474000 Tok River near Tok Junction, AK Alaska Range/ Interior Forest Lowlands and Uplands
33 15476000 Tanana River near Tanacross, AK Wrangell Mountains/ Interior Bottomlands
34 15476100 Robertson River near Tanacross, AK Alaska Range
35 15476300 Berry Creek near Dot Lake, AK Alaska Range
36 15476500 Johnson River near Dot Lake, AK Alaska Range
37 15476600 Little Gerstle River near Big Delta, AK Alaska Range
38 15476700 Gerstle River near Big Delta, AK Alaska Range
39 15477500 Clearwater Creek near Delta Junction, AK Interior Bottomlands
40 15478000 Tanana River at Big Delta, AK --
41 15478100 Delta River at Black Rapids, AK Alaska Range
42 6312441453813 Phelan Creek at Richardson Highway near Paxson, AK Alaska Range
43 6324121454355 Castner Creek near Black Rapids, AK Alaska Range
44 6401251454325 Jarvis Creek near Delta Junction, AK Alaska Range/Interior Bottomlands
45 6407351455000 Delta River near Big Delta, AK Alaska Range/Interior Bottomlands
46 15484000 Salcha River near Salchaket, AK Interior Highlands
47 6429101463900 Salcha River 8 mile above gage near Salchaket, AK Interior Highlands
Table 11. Water-quality stations in the Yukon River Basin with 10 or more years of record--Continued
[--, watershed drains more than two ecoregions]
Map No.
(fig. 36)
USGS
station No. or
latitude/longitude
Station name
Primary ecoregions drained
by watershed

Water Quality 83
48 15493500 Chena River near North Pole, AK Interior Highlands
49 15511000 Little Chena River near Fairbanks, AK Interior Highlands/Interior Forest Lowlands and Uplands
50 15514000 Chena River at Fairbanks, AK Interior Highlands/Interior Forest Lowlands and Uplands
51 6450001473430 Chena River at Fort Wainwright, AK Interior Highlands/Interior Forest Lowlands and Uplands
52 15479500 Shaw Creek near Delta Junction, AK Interior Highlands/Interior Bottomlands
53 15514500 Wood River near Fairbanks, AK Alaska Range
54 15515500 Tanana River at Nenana, AK Alaska Range
55 15515800 Seattle Creek near Cantwell, AK Alaska Range
56 15518000 Nenana River near Healy, AK Alaska Range
57 15518040 Nenana River at Healy, AK Alaska Range
58 15518350 Teklanika River near Lignite, AK Alaska Range
59 6351061485322 Healy Creek below Moody Creek near Healy, AK Alaska Range
60 6351291485659 Nenana River at Power Plant Intake near Healy, AK Alaska Range
61 6351321485658 Nenana River 300 feet below Power Plant Intake near Healy, AK Alaska Range
62 15535000 Caribou Creek near Chatanika, AK Interior Highlands
63 15564877 Wiseman Creek at Wiseman, AK Brooks Range
64 15564600 Melozitna River near Ruby, AK Interior Forest Lowlands and Uplands
65 15564800 Yukon River at Ruby, AK --
66 15564900 Koyukuk River at Hughes, AK Brooks Range/Interior Forest Lowlands and Uplands
67 6239301601120 Yukon River at Anvik, AK --
68 15565300 Innoko River at Shageluk, AK Interior Bottomlands
69 15565447 Yukon River at Pilot Station, AK --
70 6205051634345 Yukon River at Mountain Village, AK --
Table 11. Water-quality stations in the Yukon River Basin with 10 or more years of record--Continued
[--, watershed drains more than two ecoregions]
Map No.
(fig. 36)
USGS
station No. or
latitude/longitude
Station name
Primary ecoregions drained
by watershed
84 Environmental and Hydrologic Overview of the Yukon River Basin, Alaska and Canada
Yukon River Main Stem
Ten or more water-quality samples have been collected at 70
sites in the Yukon River Basin (fig. 36; table 11). Twenty-one sites
are located in Canada and 49 in Alaska. Eight sites are located
along the main stem of the Yukon River between Whitehorse,
Yukon Territory, and Mountain Village, Alaska. Eleven sites are
located along rivers that discharge directly into the Yukon River,
although these sites are not necessarily located at the mouth. The
Yukon River at Pilot Station has been the longest continuously
monitored site on the main stem of the Yukon River.
The water of the main stem of the Yukon River has relatively
low specific conductance ranging from about 60 to 257 µS/cm
(table 12). The conductance increases downstream between
Whitehorse, Yukon Territory and Rampart, Alaska, and decreases
slightly from Rampart to Mountain Village. Conductance
increases of about 50 percent between Carmacks, Yukon Territory
and Eagle, Alaska, are most likely due to the input of dissolved
solutes from three major tributaries between Carmacks and Eagle:
the Pelly, White, and Stewart Rivers.
Specific conductance can also be used as a general measure
of the dissolved ion concentration and the same pattern is reflected
in both the major ion concentrations and the dissolved solids con-
centrations. Calcium and magnesium are the primary cations
(table 12) with calcium accounting for about 70 percent of the cat-
ionic charge. Bicarbonate (calculated from alkalinity) and sulfate
are the dominant anions, with bicarbonate accounting for about 80
percent of the anionic charge.
Nutrient concentrations in the Yukon River are generally low
(less than 0.5 mg/L) throughout the river (table 12). Dissolved
nitrate generally increases downstream with the highest concentra-
tions measured at Pilot Station. Concentrations for total phospho-
rus were also relatively low (less than 0.5 mg/L). The highest
concentrations and greatest variability for total phosphorus were
measured at Eagle.
Total organic carbon concentrations (TOC) increase along
the course of the lower Yukon, nearly doubling from a median con-
centration of 2.3 mg/L at Yukon River at Carmacks to 4.2 mg/L at
Eagle and doubling again between Eagle and Pilot Station (table
12). Dissolved organic carbon (DOC) data are available only for
the Yukon River at Pilot Station. DOC concentrations are slightly
lower than TOC concentrations at Pilot Station and have a median
concentration of 6.4 mg/L.
Total iron concentrations increase downstream in the Yukon
River, from a median of 46 µg/L at Whitehorse to 5,900 µg/L at
Pilot Station (table 12). The increase is greatest between Carmacks
and Eagle where the median concentration increases by an order
of magnitude from 280 to 2,200 µg/L. Dissolved iron data are
available only for the Yukon River at Pilot Station where the con-
centration is an order-of-magnitude less than that for total iron
(table 12), indicating that the most iron is transported on the sedi-
ment.
Total manganese concentrations in the Yukon River decrease
about fourfold between Whitehorse and Frank Creek (table 12).
From this point, the concentration increases downstream. As with
iron, the dissolved manganese concentration is about an order-of-
magnitude less than the total concentration, indicating that most of
the manganese is transported either in the mineral or in the oxide
form (table 12) with sediment.
Additional trace elements that show some trends are total
barium, total strontium, total arsenic, and total aluminum. Values
of total barium and total strontium nearly double between Car-
macks and Eagle (table 12). Total arsenic gradually increases
downstream from a median concentrations of 0.4 µg/L at White-
horse to 3 µg/L at Pilot Station. Total aluminum concentrations at
Carmacks are three times higher than those at Whitehorse.

Water Quality 85
Map
No.
(fig.
36)
Yukon River
station name
Number
of
analyses
Mean
Percentile values
calculated from the data
25 50 75
Specific conductance, microsiemens per centimeter at 25 degrees Celsius
4 At Whitehorse, YT 1155 79 60 88 94
8 Above Frank Creek, YT 21 100 96 100 103
15 At Carmacks, YT 1208 144 125 140 153
22 At Eagle, AK (Canadian) 202 214 188 213 235
22 At Eagle, AK (USGS) 81 213 187 204 231
27 At Rampart, AK 120 230 207 234 257
65 At Ruby, AK 106 216 189 217 236
69 At Pilot Station, AK 111 209 173 202 220
70 At Mountain Village, AK 18 198 108 198 203
Dissolved solids, residue on evaporation at 180 degrees Celsius, milligrams per liter
4 At Whitehorse, YT 144 78 58 67 87
8 Above Frank Creek, YT 17 62 60 60 60
15 At Carmacks, YT 553 104 84 96 113
22 At Eagle, AK (Canadian) 144 153 133 151 170
22 At Eagle, AK (USGS) 69 130 113 143 143
27 At Rampart, AK 118 136 123 138 153
65 At Ruby, AK 107 126 108 127 138
69 At Pilot Station, AK 105 123 102 119 130
70 At Mountain Village, AK 17 113 104 112 118
pH, standard units
4 At Whitehorse, YT 1160 7.6 7.3 7.7 7.9
8 Above Frank Creek, YT 17 7.8 7.8 7.9 7.9
15 At Carmacks, YT 113 7.9 7.6 7.9 8.1
22 At Eagle, AK (Canadian) 46 7.9 7.8 8.0 8.1
22 At Eagle, AK (USGS) 75 7.6 7.3 7.6 7.9
27 At Rampart, AK 115 7.5 7.4 7.6 7.8
65 At Ruby, AK 103 7.7 7.6 7.7 8.0
69 At Pilot Station, AK 106 7.5 7.3 7.6 7.8
70 At Mountain Village, AK 17 7.1 6.8 6.9 7.2
Water temperature, degrees Celsius
4 At Whitehorse, YT 1080 12.5 2.1 14 21.6
8 Above Frank Creek, YT 18 6.2 1 3 12
15 At Carmacks, YT 1055 12.5 4 13 21.3
22 At Eagle, AK (Canadian) 292 11.9 1 13.8 21.1
22 At Eagle, AK (USGS) 49 9.6 6.5 11.5 14
27 At Rampart, AK 25 6.9 0 6.0 12.0
65 At Ruby, AK 39 7.8 0.5 7.0 13.0
69 At Pilot Station, AK 91 9.1 0 10.5 14.5
70 At Mountain Village, AK -- -- -- -- --
Map
No.
(fig.
36)
Yukon River
station name
Number
of
analyses
Mean
Percentile values
calculated from the data
25 50 75
Table 12. Summary statistics for selected properties and constituents of surface-water samples from stations along the Yukon River
[--, no data]

86 Environmental and Hydrologic Overview of the Yukon River Basin, Alaska and Canada
Dissolved-oxygen concentration, milligrams per liter
4 At Whitehorse, YT -- -- -- -- --
8 Above Frank Creek, YT -- -- -- -- --
15 At Carmacks, YT -- -- -- -- --
22 At Eagle, AK (Canadian) -- -- -- -- --
22 At Eagle, AK (USGS) -- -- -- -- --
27 At Rampart, AK -- -- -- -- --
65 At Ruby, AK -- -- -- -- --
69 At Pilot Station, AK 68 8.1 7.7 9.1 10.1
70 At Mountain Village, AK -- -- -- -- --
Calcium concentration, milligrams per liter
4 At Whitehorse, YT 459 13.8 13.3 13.9 14.3
8 Above Frank Creek, YT -- -- -- -- --
15 At Carmacks, YT 412 19.7 18.1 19.6 21.1
22 At Eagle, AK (Canadian) 106 31 28 30 33
22 At Eagle, AK (USGS) 69 31 26 28 34
27 At Rampart, AK 118 31 28 32 35
65 At Ruby, AK 107 32 27 32 36
69 At Pilot Station, AK 109 31 25 29 32
70 At Mountain Village, AK 17 28 25 28 30
Map
No.
(fig.
36)
Yukon River
station name
Number
of
analyses
Mean
Percentile values
calculated from the data
25 50 75
Magnesium concentration, milligrams per liter
4 At Whitehorse, YT 100 2.4 2.3 2.4 2.5
8 Above Frank Creek, YT -- -- -- -- --
15 At Carmacks, YT 79 4.3 3.6 4 4.4
22 At Eagle, AK (Canadian) 106 7.8 7 8.2 9.3
22 At Eagle, AK (USGS) 69 8.0 6.5 7.4 8.4
27 At Rampart, AK 118 8.8 7.5 8.4 10
65 At Ruby, AK 108 6.2 5.1 6.3 7.3
69 At Pilot Station, AK 109 6.7 5.0 6.4 7.6
70 At Mountain Village, AK 17 5.5 5.1 5.4 5.7
Sodium concentration, milligrams per liter
4 At Whitehorse, YT 460 1.1 1 1.1 1.1
8 Above Frank Creek, YT -- -- -- -- --
15 At Carmacks, YT 412 1.6 1.4 1.6 1.7
22 At Eagle, AK (Canadian) 110 2.6 2.3 2.5 2.7
22 At Eagle, AK (USGS) 53 2.6 2.2 2.4 2.8
27 At Rampart, AK 118 3.3 2.6 3.2 3.9
65 At Ruby, AK 108 2.6 2.1 2.7 3.1
69 At Pilot Station, AK 109 2.5 2.0 2.5 3.0
70 At Mountain Village, AK 18 3.3 2.3 3.0 3.6
Map
No.
(fig.
36)
Yukon River
station name
Number
of
analyses
Mean
Percentile values
calculated from the data
25 50 75
Table 12. Summary statistics for selected properties and constituents of surface-water samples from stations along the Yukon River--Continued
[--, no data]

Water Quality 87
Potassium concentration, milligrams per liter
4 At Whitehorse, YT 460 0.6 0.6 0.6 0.7
8 Above Frank Creek, YT -- -- -- -- --
15 At Carmacks, YT 412 0.8 0.6 0.7 0.8
22 At Eagle, AK (Canadian) 108 1.3 0.97 1.1 1.3
22 At Eagle, AK (USGS) 52 1.4 0.95 1.2 1.7
27 At Rampart, AK 118 1.1 1.0 1.1 1.3
65 At Ruby, AK 108 1.2 1.1 1.2 1.4
69 At Pilot Station, AK 109 1.3 1.0 1.2 1.4
70 At Mountain Village, AK 18 1.0 0.7 0.95 1.3
Total alkalinity, as CaCO
3
, milligrams per liter
4 At Whitehorse, YT 633 40 37 41 42
8 Above Frank Creek, YT 18 43 41 42 43
15 At Carmacks, YT 648 62 57 62 66
22 At Eagle, AK (Canadian) 197 93 79 88 102
22 At Eagle, AK (USGS) 73 89 75 82 99
27 At Rampart, AK 108 88 79 89 96
65 At Ruby, AK 116 91 77 91 101
69 At Pilot Station, AK 87 83 64 76 84
70 At Mountain Village, AK 18 76 66 76 83
Map
No.
(fig.
36)
Yukon River
station name
Number
of
analyses
Mean
Percentile values
calculated from the data
25 50 75
Sulfate concentration, milligrams per liter
4 At Whitehorse, YT 634 5.8 5.4 5.7 6.1
8 Above Frank Creek, YT 18 5.6 5.6 5.9 6.2
15 At Carmacks, YT 648 8.1 7 8 9.1
22 At Eagle, AK (Canadian) 197 25 22 25 28
22 At Eagle, AK (USGS) 70 26 21 24 29
27 At Rampart, AK 118 29 25 29 34
65 At Ruby, AK 116 20 17 21 23
69 At Pilot Station, AK 107 22 19 22 26
70 At Mountain Village, AK 18 20 18 22 24
Chloride concentration, milligrams per liter
4 At Whitehorse, YT 634 0.3 0.2 0.2 0.3
8 Above Frank Creek, YT 18 0.3 0.3 0.3 0.3
15 At Carmacks, YT 648 0.5 0.3 0.3 0.5
22 At Eagle, AK (Canadian) 197 0.9 0.6 0.7 0.9
22 At Eagle, AK (USGS) 69 1.1 0.5 0.8 1.1
27 At Rampart, AK 101 1.2 0.8 1.0 1.4
65 At Ruby, AK -- -- -- -- --
69 At Pilot Station, AK 110 1.1 0.9 1.0 1.2
70 At Mountain Village, AK 18 1.2 1.0 1.0 1.5
Map
No.
(fig.
36)
Yukon River
station name
Number
of
analyses
Mean
Percentile values
calculated from the data
25 50 75
Table 12. Summary statistics for selected properties and constituents of surface-water samples from stations along the Yukon River--Continued
[--, no data]

88 Environmental and Hydrologic Overview of the Yukon River Basin, Alaska and Canada
Dissolved silica concentration, milligrams per liter
4 At Whitehorse, YT 160 1.5 1.4 1.4 1.6
8 Above Frank Creek, YT 18 1.7 1.6 1.7 1.8
15 At Carmacks, YT 215 2.8 2.6 2.8 3.04
22 At Eagle, AK (Canadian) 197 3.6 3.3 3.6 4.0
22 At Eagle, AK (USGS) 69 7.3 6.2 7.2 8.1
27 At Rampart, AK 118 6.6 5.8 6.5 7.6
65 At Ruby, AK 108 7.1 6.1 7.1 8.1
69 At Pilot Station, AK 109 7.5 5.9 6.9 8.1
70 At Mountain Village, AK 17 7.4 6.8 7.0 7.5
Dissolved nitrate plus nitrite concentration, as nitrogen, milligrams per liter
4 At Whitehorse, YT 2074 0.08 0.006 0.017 0.031
8 Above Frank Creek, YT 47 0.019 0.006 0.022 0.031
15 At Carmacks, YT 2070 0.06 0.024 0.05 0.07
22 At Eagle, AK (Canadian) 661 0.21 0.046 0.093 0.17
22 At Eagle, AK (USGS) -- -- -- -- --
27 At Rampart, AK -- -- -- -- --
65 At Ruby, AK -- -- -- -- --
69 At Pilot Station, AK 62 0.15 0.10 0.10 0.20
70 At Mountain Village, AK -- -- -- -- --
Map
No.
(fig.
36)
Yukon River
station name
Number
of
analyses
Mean
Percentile values
calculated from the data
25 50 75
Total phosphorus concentration, as phosphorus, milligrams per liter
4 At Whitehorse, YT 1991 0.008 0.004 0.005 0.009
8 Above Frank Creek, YT 50 0.019 0.003 0.004 0.006
15 At Carmacks, YT 1984 0.03 0.008 0.014 0.032
22 At Eagle, AK (Canadian) 596 0.28 0.013 0.092 0.412
22 At Eagle, AK (USGS) -- -- -- -- --
27 At Rampart, AK -- -- -- -- --
65 At Ruby, AK -- -- -- -- --
69 At Pilot Station, AK 84 0.02 0.01 0.02 0.02
70 At Mountain Village, AK -- -- -- -- --
Total organic carbon, as carbon, milligrams per liter
4 At Whitehorse, YT 515 1.9 1.0 1.4 2.2
8 Above Frank Creek, YT 17 1.7 0.8 1.0 1.8
15 At Carmacks, YT 531 3.0 1.5 2.3 3.6
22 At Eagle, AK (Canadian) 154 5.4 2.3 4.2 6.9
22 At Eagle, AK (USGS) -- -- -- -- --
27 At Rampart, AK -- -- -- -- --
65 At Ruby, AK -- -- -- -- --
69 At Pilot Station, AK 15 10.5 6.7 8.4 14
70 At Mountain Village, AK -- -- -- -- --
Map
No.
(fig.
36)
Yukon River
station name
Number
of
analyses
Mean
Percentile values
calculated from the data
25 50 75
Table 12. Summary statistics for selected properties and constituents of surface-water samples from stations along the Yukon River--Continued
[--, no data]

Water Quality 89
Total iron concentration, as iron, micrograms per liter
4 At Whitehorse, YT 428 102 25 46 100
8 Above Frank Creek, YT 17 54 28 42 48
15 At Carmacks, YT 449 646 116 280 712
22 At Eagle, AK (Canadian) 141 6812 100 2200 9620
22 At Eagle, AK (USGS) -- -- -- -- --
27 At Rampart, AK -- -- -- -- --
65 At Ruby, AK -- -- -- -- --
69 At Pilot Station, AK 27 7620 1600 5900 11000
70 At Mountain Village, AK -- -- -- -- --
Total manganese, as manganese, micrograms per liter
4 At Whitehorse, YT 428 6.5 2 4 9.2
8 Above Frank Creek, YT 17 2.1 1.2 1.7 2.7
15 At Carmacks, YT 449 19 5 10 22
22 At Eagle, AK (Canadian) 141 155 5 69 240
22 At Eagle, AK (USGS) -- -- -- -- --
27 At Rampart, AK -- -- -- -- --
65 At Ruby, AK -- -- -- -- --
69 At Pilot Station, AK 27 206 120 160 280
70 At Mountain Village, AK -- -- -- -- --
Map
No.
(fig.
36)
Yukon River
station name
Number
of
analyses
Mean
Percentile values
calculated from the data
25 50 75
Dissolved iron, as iron, micrograms per liter
4 At Whitehorse, YT -- -- -- -- --
8 Above Frank Creek, YT -- -- -- -- --
15 At Carmacks, YT -- -- -- -- --
22 At Eagle, AK (Canadian) -- -- -- -- --
22 At Eagle, AK (USGS) -- -- -- -- --
27 At Rampart, AK -- -- -- -- --
65 At Ruby, AK -- -- -- -- --
69 At Pilot Station, AK 76 238 90 195 310
70 At Mountain Village, AK -- -- -- -- --
Dissolved manganese, as manganese, micrograms per liter
4 At Whitehorse, YT -- -- -- -- --
8 Above Frank Creek, YT -- -- -- -- --
15 At Carmacks, YT -- -- -- -- --
22 At Eagle, AK (Canadian) -- -- -- -- --
22 At Eagle, AK (USGS) -- -- -- -- --
27 At Rampart, AK -- -- -- -- --
65 At Ruby, AK -- -- -- -- --
69 At Pilot Station, AK 76 46 10 16.5 71
70 At Mountain Village, AK -- -- -- -- --
Map
No.
(fig.
36)
Yukon River
station name
Number
of
analyses
Mean
Percentile values
calculated from the data
25 50 75
Table 12. Summary statistics for selected properties and constituents of surface-water samples from stations along the Yukon River--Continued
[--, no data]

90 Environmental and Hydrologic Overview of the Yukon River Basin, Alaska and Canada
Total barium, as barium, micrograms per liter
4 At Whitehorse, YT 175 27 26 27 28
8 Above Frank Creek, YT 17 26 24 26 26
15 At Carmacks, YT 238 38 33 35 38
22 At Eagle, AK (Canadian) 80 104 57 86 133
22 At Eagle, AK (USGS) -- -- -- -- --
27 At Rampart, AK -- -- -- -- --
65 At Ruby, AK -- -- -- -- --
69 At Pilot Station, AK -- -- -- -- --
70 At Mountain Village, AK -- -- -- -- --
Total strontium, as strontium, micrograms per liter
4 At Whitehorse, YT 175 74 73 74 77
8 Above Frank Creek, YT 17 79 76 79 81
15 At Carmacks, YT 238 95 87 96 103
22 At Eagle, AK (Canadian) 141 168 152 167 194
22 At Eagle, AK (USGS) -- -- -- -- --
27 At Rampart, AK -- -- -- -- --
65 At Ruby, AK -- -- -- -- --
69 At Pilot Station, AK -- -- -- -- --
70 At Mountain Village, AK -- -- -- -- --
Map
No.
(fig.
36)
Yukon River
station name
Number
of
analyses
Mean
Percentile values
calculated from the data
25 50 75
Total arsenic, as arsenic, micrograms per liter
4 At Whitehorse, YT 374 0.4 0.4 0.4 0.5
8 Above Frank Creek, YT 17 0.3 0.3 0.3 0.3
15 At Carmacks, YT 398 0.4 0.4 0.5 0.6
22 At Eagle, AK (Canadian) 144 2.6 0.4 1.2 3.6
22 At Eagle, AK (USGS) -- -- -- -- --
27 At Rampart, AK -- -- -- -- --
65 At Ruby, AK -- -- -- -- --
69 At Pilot Station, AK 27 4 2 3 6
70 At Mountain Village, AK -- -- -- -- --
Total aluminum, as aluminum, micrograms per liter
4 At Whitehorse, YT 175 67 12 22 37
8 Above Frank Creek, YT 17 51 26 39 48
15 At Carmacks, YT 238 408 69 178 480
22 At Eagle, AK (Canadian) 80 4458 70 199 6910
22 At Eagle, AK (USGS) -- -- -- -- --
27 At Rampart, AK -- -- -- -- --
65 At Ruby, AK -- -- -- -- --
69 At Pilot Station, AK -- -- -- -- --
70 At Mountain Village, AK -- -- -- -- --
Map
No.
(fig.
36)
Yukon River
station name
Number
of
analyses
Mean
Percentile values
calculated from the data
25 50 75
Table 12. Summary statistics for selected properties and constituents of surface-water samples from stations along the Yukon River--Continued
[--, no data]

Water Quality 91
Map
No.
(fig.
36)
Stream-gaging station
No. of
ana-
lyses
Mean
Percentile values
calculated from
the data
25 50 75
Specific conductance, microsiemens per centimeter at 25 degrees Celsius
13 Teslin River near Teslin, YT 124 127 123 129 136
16 Pelly River at Pelly Crossing, YT 46 274 237 288 361
19 Stewart River at Stewart Crossing, YT 59 306 277 322 370
20 Klondike River above Bonanza Creek
near Dawson, YT
86 253 201 245 295
21 Fortymile River near Steele Creek, AK 13 145 119 149 166
23 Porcupine River at Old Crow, YT 89 262 191 276 373
24 Chandalar River near Venetie, AK 28 221 189 225 252
54 Tanana River at Nenana, AK 213 243 211 235 284
64 Melozitna River near Ruby, AK 28 86 54 72 127
66 Koyukuk River at Hughes, AK 43 213 171 215 258
68 Innoko River at Shageluk, AK 16 101 80 97 139
Calcium concentration, milligrams per liter
13 Teslin River near Teslin, YT 86 18 17 18 18
16 Pelly River at Pelly Crossing, YT 46 38 32 41 46
19 Stewart River at Stewart Crossing, YT 59 43 38 44 53
20 Klondike River above Bonanza Creek
near Dawson, YT
85 35 29 34 41
21 Fortymile River near Steele Creek, AK 11 20 16 21 22
23 Porcupine River at Old Crow, YT 89 40 27 41 58
24 Chandalar River near Venetie, AK 16 39 33 37 50
54 Tanana River at Nenana, AK 151 35 29 34 43
64 Melozitna River near Ruby, AK 18 10 6.4 8.7 16
66 Koyukuk River at Hughes, AK 23 29 24 27 35
68 Innoko River at Shageluk, AK 16 13 9.8 13 17
Map
No.
(fig.
36)
Stream-gaging station
No. of
ana-
lyses
Mean
Percentile values
calculated from
the data
25 50 75
The chemistry of the Yukon River reflects the chemical
inputs from its major tributaries. The waters of the tributaries to
the Yukon are predominantly calcium magnesium bicarbonate
waters with specific conductance ranging from 54 to 373 µS/cm
(table 13). Of the 11 tributaries with water-quality data, 6 sites
have data for constituents other than the major ions. These limited
data show that nitrate concentrations are highest in the Tanana and
Porcupine Rivers (table 13). The Tanana River also has the highest
total-phosphorus concentrations with a median concentration of
0.17 mg/L phosphorous. Median TOC concentrations range from
1.2 mg/L for the Stewart and Klondike Rivers to 5.5 mg/L for the
Porcupine River (table 13). Concentrations of both total iron and
total manganese, with median concentrations of 7,000 and 200
µg/L respectively (table 13), are highest in the Tanana River, per-
haps reflecting the presence of glaciers.
Table 13. Summary statistics for selected properties and constituents of surface-water samples from tributaries of the Yukon River
[--, no data]

92 Environmental and Hydrologic Overview of the Yukon River Basin, Alaska and Canada
Magnesium concentration, milligrams per liter
13 Teslin River near Teslin, YT 63 4.6 4.6 4.8 4.9
16 Pelly River at Pelly Crossing, YT 46 12 10 12 15
19 Stewart River at Stewart Crossing, YT 59 13 12 15 16
20 Klondike River above Bonanza Creek
near Dawson, YT
85 11 7.9 9.9 13
21 Fortymile River near Steele Creek, AK 11 5.8 4.8 5.5 6.7
23 Porcupine River at Old Crow, YT 89 8.6 6.3 9.3 11
24 Chandalar River near Venetie, AK 16 5.8 4.8 6.2 7.1
54 Tanana River at Nenana, AK 151 7.4 6.0 7.2 9.0
64 Melozitna River near Ruby, AK 18 3.4 2.2 2.6 4.9
66 Koyukuk River at Hughes, AK 23 7.7 6.2 7.4 9.0
68 Innoko River at Shageluk, AK 16 3.5 2.6 3.7 4.3
Total alkalinity, as CaCO
3
, milligrams per liter
13 Teslin River near Teslin, YT 119 59 55 58 59
16 Pelly River at Pelly Crossing, YT 46 99 79 104 117
19 Stewart River at Stewart Crossing, YT 59 100 81 98 129
20 Klondike River above Bonanza Creek
near Dawson, YT
85 82 66 79 95
21 Fortymile River near Steele Creek, AK 13 50 43 52 56
23 Porcupine River at Old Crow, YT 89 98 51 82 156
24 Chandalar River near Venetie, AK 16 107 90 105 128
54 Tanana River at Nenana, AK 139 96 81 92 118
64 Melozitna River near Ruby, AK 19 36 21 29 57
66 Koyukuk River at Hughes, AK 24 86 57 78 79
68 Innoko River at Shageluk, AK 15 41 31 41 55
Map
No.
(fig.
36)
Stream-gaging station
No. of
ana-
lyses
Mean
Percentile values
calculated from
the data
25 50 75
Sulfate concentration, milligrams per liter
13 Teslin River near Teslin, YT 33 6.2 5.6 6.0 6.5
16 Pelly River at Pelly Crossing, YT 46 41 34 46 50
19 Stewart River at Stewart Crossing, YT 59 58 50 63 68
20 Klondike River above Bonanza Creek
near Dawson, YT
85 47 37 46 53
21 Fortymile River near Steele Creek, AK 11 24 17 21 32
23 Porcupine River at Old Crow, YT 89 32 27 34 39
24 Chandalar River near Venetie, AK 16 16 15 16 20
54 Tanana River at Nenana, AK 155 29 26 30 32
64 Melozitna River near Ruby, AK 18 7.8 3.9 6.5 10
66 Koyukuk River at Hughes, AK 23 26 19 25 29
68 Innoko River at Shageluk, AK 15 7.4 5.2 7.0 10
Dissolved nitrate plus nitrate concentration, as nitrogen, milligrams per liter
13 Teslin River near Teslin, YT 427 0.012 0.017 0.041 0.059
16 Pelly River at Pelly Crossing, YT 77 0.038 0.012 0.028 0.096
19 Stewart River at Stewart Crossing, YT 91 0.086 0.04 0.07 0.12
20 Klondike River above Bonanza Creek
near Dawson, YT
84 0.109 0.017 0.05 0.17
21 Fortymile River near Steele Creek, AK -- -- -- -- --
23 Porcupine River at Old Crow, YT 109 0.100 0.02 0.07 0.21
24 Chandalar River near Venetie, AK -- -- -- -- --
54 Tanana River at Nenana, AK 39 0.18 0.11 0.15 0.2
64 Melozitna River near Ruby, AK -- -- -- -- --
66 Koyukuk River at Hughes, AK -- -- -- -- --
68 Innoko River at Shageluk, AK -- -- -- -- --
Map
No.
(fig.
36)
Stream-gaging station
No. of
ana-
lyses
Mean
Percentile values
calculated from
the data
25 50 75
Table 13. Summary statistics for selected properties and constituents of surface-water samples from tributaries of the Yukon River--Continued
[--, no data]

Water Quality 93
Total phosphorus concentration, as phosphorus, milligrams per liter
13 Teslin River near Teslin, YT 420 0.013 0.006 0.008 0.013
16 Pelly River at Pelly Crossing, YT 100 0.114 0.009 0.022 0.050
19 Stewart River at Stewart Crossing, YT 115 0.111 0.005 0.020 0.076
20 Klondike River above Bonanza Creek
near Dawson, YT
151 0.034 0.003 0.005 0.015
21 Fortymile River near Steele Creek, AK -- -- -- -- --
23 Porcupine River at Old Crow, YT 166 0.017 0.002 0.007 0.018
24 Chandalar River near Venetie, AK -- -- -- -- --
54 Tanana River at Nenana, AK 80 0.240 0.12 0.17 0.2
64 Melozitna River near Ruby, AK -- -- -- -- --
66 Koyukuk River at Hughes, AK -- -- -- -- --
68 Innoko River at Shageluk, AK -- -- -- -- --
Total organic carbon, as carbon, milligrams per liter
13 Teslin River near Teslin, YT 15 4.68 3.3 4.1 4.7
16 Pelly River at Pelly Crossing, YT 44 4.5 1.7 3.2 4.9
19 Stewart River at Stewart Crossing, YT 59 2.1 0.5 1.2 2
20 Klondike River above Bonanza Creek
near Dawson, YT
84 3.3 0.5 1.2 2.3
21 Fortymile River near Steele Creek, AK -- -- -- -- --
23 Porcupine River at Old Crow, YT 85 6.3 0.5 5.5 10.9
24 Chandalar River near Venetie, AK -- -- -- -- --
54 Tanana River at Nenana, AK 14 5.8 2.8 5.3 7.5
64 Melozitna River near Ruby, AK -- -- -- -- --
66 Koyukuk River at Hughes, AK -- -- -- -- --
68 Innoko River at Shageluk, AK -- -- -- -- --
Map
No.
(fig.
36)
Stream-gaging station
No. of
ana-
lyses
Mean
Percentile values
calculated from
the data
25 50 75
Total iron concentration, as iron, micrograms per liter
13 Teslin River near Teslin, YT 109 101 35 57 106
16 Pelly River at Pelly Crossing, YT 46 2047 187 420 966
19 Stewart River at Stewart Crossing, YT 59 1860 103 538 13200
20 Klondike River above Bonanza Creek
near Dawson, YT
97 538 22 68 140
21 Fortymile River near Steele Creek, AK -- -- -- -- --
23 Porcupine River at Old Crow, YT 86 567 44 148 744
24 Chandalar River near Venetie, AK -- -- -- -- --
54 Tanana River at Nenana, AK 19 13613 810 7000 20000
64 Melozitna River near Ruby, AK -- -- -- -- --
66 Koyukuk River at Hughes, AK -- -- -- -- --
68 Innoko River at Shageluk, AK -- -- ---- ---- --
Total manganese, as manganese, micrograms per liter
13 Teslin River near Teslin, YT 86 5.0 3.7 9.0 18
16 Pelly River at Pelly Crossing, YT 109 72 12 21 37
19 Stewart River at Stewart Crossing, YT 59 60 16 26 39
20 Klondike River above Bonanza Creek
near Dawson, YT
97 24 7.7 9.4 14
21 Fortymile River near Steele Creek, AK -- -- -- -- --
23 Porcupine River at Old Crow, YT 86 14 3.7 9.0 19
24 Chandalar River near Venetie, AK -- -- -- -- --
54 Tanana River at Nenana, AK 19 362 130 200 350
64 Melozitna River near Ruby, AK -- -- -- -- --
66 Koyukuk River at Hughes, AK -- -- -- -- --
68 Innoko River at Shageluk, AK -- -- -- -- -
Map
No.
(fig.
36)
Stream-gaging station
No. of
ana-
lyses
Mean
Percentile values
calculated from
the data
25 50 75
Table 13. Summary statistics for selected properties and constituents of surface-water samples from tributaries of the Yukon River--Continued
[--, no data]

94 Environmental and Hydrologic Overview of the Yukon River Basin, Alaska and Canada
Temporal Variations in Water Quality
The rivers of the Yukon Basin are generally ice covered from
mid-to-late October to mid-to-late May. During this period of low
flow, glacial and surface runoff is minimal to non-existent and
baseflow predominates. Comparing the water-quality data col-
lected during periods of ice cover with the water-quality data col-
lected during open-water periods indicated a slight basinwide
increase in median specific conductance under ice compared to
that in the open water (fig. 37). Specific conductance increases
down the Yukon River from Whitehorse to Pilot Station during
both the open-water and ice-covered periods (fig. 37).
Substantial differences are found between the two seasons at
the Yukon River at Pilot Station (table 14). Concentrations of cal-
cium, magnesium, silica, and bicarbonate are almost twice as high
during ice cover than during open water (probably due to ion
exclusion under freezing conditions). However, sulfate concentra-
tions do not increase significantly. Dissolved oxygen decreases
significantly between the two seasons with a median open-water
and under-ice dissolved oxygen concentrations of 9.3 and 2.7
mg/L, respectively. The median DOC concentration also decreases
under ice from 7.5 to 4.3 mg/L. The trace elements total iron, dis-
solved iron, and total arsenic decreased under ice conditions, but
concentrations of the trace elements dissolved manganese and dis-
solved strontium increased under ice (table 14).
View of the water-worked basin of the Yukon Flats ecoregion,
which is covered by numerous thaw and oxbow lakes. Annual
precipitation is insufficient to maintain many lakes, which are
replenished by yearly flooding of the Yukon River (center,
flowing from east to west).

Water Quality 95
(117) (85)
0
500
100
200
300
400
EXPLANATION
25th percentile
Median
75th percentile
interquartile range outside the quartile
Data value less than or equal to 1.5 times the
interquartile range outside the quartile
and more than 1.5 times the
Outlier data value less than or equal to 3
interquartile range outside the quartile
Outlier data value more than 3 times the
(117) Number of observations
Eagle
(318) (306)
0
500
100
200
300
400
(315) (328)
0
500
100
200
300
400
(14)(114)
open
ice
0
500
100
200
300
400
(17)(103)
0
500
100
200
300
400
Whitehorse
Carmacks
Rampart
(56)(318)
0
500
100
200
300
400
Ruby
Pilot
SPECIFIC CONDUCTANCE,
IN MICROSIEMENS PER CENTIMETER AT 25 DEGREES CELSIUS
Figure 37. Boxplots of specific conductance from samples taken during open water and under ice cover on the Yukon River.
open ice
open ice
open ice
open
ice
open ice

96 Environmental and Hydrologic Overview of the Yukon River Basin, Alaska and Canada
Property or
constituent
(unit)
Sea-
son
No.
sam-
ples
Mean Median
a
Q
1
b
Q
3
c
p
Suspended sediment
(mg/L)
Ice
19
5.8 5 4 7 0.0001
Open
48
309 279 201 386
Specific conductance
(µS/cm)
Ice
24
299 299 289 305 0.0001
Open
87
184 190.6 163.5 210
pH Ice
23
7.1 7.1 7.0 7.3 0.0001
Open
83
7.6 7.7 7.5 7.8
Dissolved oxygen
(mg/L)
Ice
17
3.4 2.7 2.4 3.6 0.0001
Open
51
9.6 9.3 8.7 10.3
Alkalinity
(mg/L as CaCO
3
)
Ice
17
139 140 134 144 0.0001
Open
70
70 73.5 61 82
Calcium
(mg/L as Ca)
Ice
23
45.4 46 45 47 0.0001
Open
86
26.9 27 24 30
Magnesium
(mg/L as Mg)
Ice
23
10.1 10 9.9 11 0.0001
Open
86
5.8 6.1 4.4 6.8
Sulfate
(mg/L as SO
4
)
Ice
22
21.8 21.2 20.5 24 0.3999
Open
85
23.1 23 18 27
Silica
(mg/L as SiO
2
)
Ice
23
12 12 12 13 0.0001
Open
86
6.3 6.7 5.6 7.1
Arsenic, total
(µg/L as As)
Ice
7
1.6 2 1 2 0.0011
Open
20
4.7 4 3 6
Iron, total
(µg/L as Fe)
Ice
7
1419 1500 1300 1500 0.0001
Open
20
9791 8332 4850 13000
Iron, dissolved
(µg/L as Fe)
Ice
19
201 90 60 230 0.0216
Open
57
250 220 140 310
Manganese, total
(µg/L as Mn)
Ice
7
138.6 130 120 150 0.1077
Open
20
230 200 130 325
Manganese, dissolved
(µg/L as Mn)
Ice
19
133 130 110 170 0.0001
Open
57
17.8 10 10 20
Strontium, dissolved
(µg/L as Sr)
Ice
13
189 190 190 190 0.0001
Open
37
106.8 110 89 120
Nitrate + nitrite,
dissolved (mg/L as N)
Ice
17
0.21 0.21 0.20 0.23 0.0001
Open
45
0.12 0.1 0.11 0.1
Phosphorus, total
(mg/L as P)
Ice
24
0.02 0.02 0.01 0.02 0.0001
Open
60
0.21 0.18 0.095 0.295
Dissolved organic
carbon (mg/L as C)
Ice
4
4.4 4.3 2.9 5.9 0.0511
Open
15
9.46 7.5 5.1 13
a
25
th
percentile
b
75
th
percentile
c
The attained significance level of the data
Property or
constituent
(unit)
Sea-
son
No.
sam-
ples
Mean Median
a
Q
1
b
Q
3
c
p
Table 14. Comparison of samples taken during open water and under ice cover, Yukon River at Pilot Station (map No. 69, fig. 36)
[mg/L, milligram per liter; µg/L, microgram per liter; µS/cm, microsiemens per centimeter at 25 degrees Celsius]
Water Quality 97
Spatial Variations in Water Quality
In the Yukon River Basin, most, if not all, of the chemical
composition of the water is influenced by natural features such as
geology, soils, and climate. One of the central concepts of ecore-
gions is to define areas that have these same natural features. As a
means of describing the water quality of the Yukon River Basin,
both spatially and in relation to the natural features, the existing
water-quality data were grouped and analyzed within the ecore-
gions of the Yukon River Basin. Although there is not sufficient
data for statistical analysis, some general observations can be
made.
The primary ecoregions composing the watershed area of the
rivers in the Yukon River Basin (fig. 16) where water-quality data
are available were determined (table 11). Drainage basins for 42
sites reside in only one ecoregion. Watershed areas for the remain-
ing 29 sites reside in two or more ecoregions. Water-quality data
for these 29 sites were not used in this analysis. Of the 42 sites hav-
ing drainage basins in only one ecoregion, 8 of the 20 ecoregions
of the Yukon River Basin are represented: Yukon Stikine High-
lands, Yukon Southern Lakes, Boreal Mountains and Plateaus,
Interior Highlands, Interior Bottomlands, Brooks Range, Alaska
Range, and Interior Forested Lowlands and Uplands. Nineteen
sites received drainage from the Alaska Range, seven from the
Yukon Southern Lakes, six from the Interior Highlands, and two
each from the other five ecoregions.
Calcium is the dominant cation in waters from all ecoregions
and bicarbonate is the dominant anion in all ecoregions except the
Boreal Mountains and Plateaus ecoregion, where sulfate is the
main anion (table 15). The major ion composition for eight ecore-
gions is consistent with the dissolution of carbonate minerals, such
as calcite and dolomite, with a greater contribution from sulfate-
containing minerals, such as gypsum, in the Boreal Mountains and
Plateaus ecoregion.
Nutrient concentrations were low in all ecoregions evaluated
for the Yukon River Basin. Dissolved nitrate concentrations are
higher in the Interior Bottomlands, Interior Highlands, and the
Alaska Range ecoregions than in the Yukon Stikine Highlands, the
Yukon Southern Lakes, and the Boreal Mountains and Plateaus
ecoregions of the upper basin (table 15). Total phosphate concen-
trations were lower in the Yukon Stikine Highlands relative to the
other ecoregions.
The TOC concentrations were higher in the Interior High-
lands and the Boreal Mountains and Plateaus ecoregions than in
the Yukon Stikine Highlands, the Yukon Southern Lakes, and
Alaska Range ecoregions. One possibility for the relatively high
concentrations of TOC is the fact that these two ecoregions are
dominated by organic soils. The only ecoregions with DOC data
available are the Interior Highlands and the Alaska Range. The
DOC concentrations are highest in the Interior Highlands ecore-
gion, most likely reflecting the presence of organic soils (table 15).
Iron is an essential trace element for both plant and animals,
and concentrations in water are strongly dependent on the pH and
oxidation intensity of the water. Total iron concentrations vary
widely between the ecoregions, with an inner quartile range rang-
ing from 14 to 126 µg/L for the Yukon Stikine Highlands to 420 to
11,000 µg/L for the Alaska Range (table 15). Because the waters
of the Yukon River Basin are generally well oxygenated and near
neutral, the total iron concentrations most likely reflect the iron
concentration transported as mineral material or as iron oxyhy-
droxide. Concentration data for both total and dissolved iron are
available only for the Brooks Range and the Alaska Range ecore-
gions. The dissolved concentrations for the two ecoregions are an
order-of-magnitude to several orders-of-magnitude lower than
their total iron concentrations (table 15).

98 Environmental and Hydrologic Overview of the Yukon River Basin, Alaska and Canada
Ecoregion
(fig. 36)
No. of
analyses
Mean
Percentile values
calculated from the data
25 50 75
Specific conductance, microsiemens per centimeter at 25 degrees Celsius
Yukon Stikine Highlands 139 105 72 108 140
Yukon Southern Lakes 641 195 108 185 288
Boreal Mountains and Plateaus 163 115 100 125 133
Interior Highlands 177 116 83 122 150
Interior Bottomlands 31 203 97 153 312
Brooks Range 37 245 194 233 291
Alaska Range 1044 241 200 234 282
Interior Forested Lowlands & Uplands 50 153 72 154 225
Dissolved solids, residue on evaporation at 180 degrees Celsius, milligrams per liter
Yukon Stikine Highlands 94 71 58 70 90
Yukon Southern Lakes 593 141 100 130 200
Boreal Mountains and Plateaus 53 84 70 90 94
Interior Highlands 114 71 52 75 91
Interior Bottomlands 25 106 51 79 179
Brooks Range 23 148 115 137 174
Alaska Range 966 148 121 142 173
Interior Forested Lowlands & Uplands 34 91 46 88 128
pH, standard units
Yukon Stikine Highlands 222 7.6 7.5 7.7 7.8
Yukon Southern Lakes 751 7.9 7.6 7.8 8.0
Boreal Mountains and Plateaus 174 7.6 7.2 7.8 8.0
Interior Highlands 137 7.2 7.0 7.3 7.5
Interior Bottomlands 29 7.2 7.0 7.3 7.6
Brooks Range 28 7.9 7.8 7.9 8.1
Alaska Range 994 7.6 7.4 7.6 7.8
Interior Forested Lowlands & Uplands 36 7.4 7.0 7.5 7.9
Water temperature, degrees Celsius
Yukon Stikine Highlands 159 5.9 0.2 3.9 10
Yukon Southern Lakes 394 6.0 0.5 6.0 10
Boreal Mountains and Plateaus 174 5.3 7.2 7.8 8.0
Interior Highlands 157 5.5 0 4.0 10
Interior Bottomlands 16 3.8 2 3.3 5.5
Brooks Range 34 6.8 1.5 6.3 10.5
Alaska Range 516 5.8 0.5 5.5 11
Interior Forested Lowlands & Uplands 37 6.7 1.5 8 10.8
Dissolved-oxygen concentration, milligrams per liter
Yukon Stikine Highlands -- -- -- -- --
Yukon Southern Lakes -- -- -- -- --
Boreal Mountains and Plateaus -- -- -- -- --
Interior Highlands 49 10.3 9.5 10.2 11.5
Interior Bottomlands -- -- -- -- --
Brooks Range 3 12.4 11 11.8 14.4
Alaska Range 138 11 9.1 11.2 12.4
Interior Forested Lowlands & Uplands -- -- -- -- --
Calcium concentration, milligrams per liter
Yukon Stikine Highlands 12 11.7 9.5 10.9 14.5
Yukon Southern Lakes 499 34.5 25.2 32.6 44.3
Boreal Mountains and Plateaus 115 16.6 15.8 17.6 18.3
Interior Highlands 117 15.2 11 16 20
Interior Bottomlands 26 24.7 12 19 43
Brooks Range 23 41 32 41 52
Alaska Range 968 33.9 28 33 40
Interior Forested Lowlands & Uplands 34 24 8.3 21 34
Ecoregion
(fig. 36)
No. of
analyses
Mean
Percentile values
calculated from the data
25 50 75
Table 15. Summary statistics for selected properties and constituents of surface-water samples by ecoregion
[--, no data]

Water Quality 99
Magnesium concentration, milligrams per liter
Yukon Stikine Highlands 12 1.1 0.9 1.0 1.4
Yukon Southern Lakes 499 8.9 5.8 7.9 11.9
Boreal Mountains and Plateaus 78 4.2 3.9 4.7 4.9
Interior Highlands 117 3.9 2.6 4.3 5.2
Interior Bottomlands 26 5.4 3.4 4.6 8.5
Brooks Range 23 7.5 5.1 6.7 8.1
Alaska Range 969 8.2 5.7 7.3 9.3
Interior Forested Lowlands & Uplands 34 4.4 2.5 4.7 6.7
Sodium concentration, milligrams per liter
Yukon Stikine Highlands 12 1.4 1.1 1.4 1.7
Yukon Southern Lakes -- -- -- -- --
Boreal Mountains and Plateaus 115 1.3 1.3 1.4 1.5
Interior Highlands 107 1.7 1.2 1.6 1.9
Interior Bottomlands 26 2.7 1.8 2.3 3.7
Brooks Range 23 1.0 0.7 0.8 1.2
Alaska Range 846 3.9 2.4 3.8 5.1
Interior Forested Lowlands & Uplands 34 1.8 0.8 1.3 2
Potassium concentration, milligrams per liter
Yukon Stikine Highlands 12 0.5 0.5 0.6 0.6
Yukon Southern Lakes 201 1.2 0.9 1 1.3
Boreal Mountains and Plateaus 115 0.5 0.5 0.6 0.6
Interior Highlands 107 0.9 0.7 0.9 1
Interior Bottomlands 26 1.3 0.8 1 2.1
Brooks Range 23 0.70 0.4 0.6 1
Alaska Range 846 1.7 1.3 1.7 2.1
Interior Forested Lowlands & Uplands 34 0.6 0.3 0.5 0.9
Ecoregion
(fig. 36)
No. of
analyses
Mean
Percentile values
calculated from the data
25 50 75
Total alkalinity, as CaCO
3
, milligrams per liter
Yukon Stikine Highlands 149 40 29 42 51
Yukon Southern Lakes 676 87 45 83 134
Boreal Mountains and Plateaus 163 53 51 58 61
Interior Highlands 136 41.5 30 43 55
Interior Bottomlands 28 79 40 65 120
Brooks Range 27 100 88 100 120
Alaska Range 981 88 67 87 110
Interior Forested Lowlands & Uplands 35 68 26 63 100
Sulfate concentration, milligrams per liter
Yukon Stikine Highlands 149 13 9 14 17
Yukon Southern Lakes 674 16 6 14 23
Boreal Mountains and Plateaus 163 5.7 51 58 61
Interior Highlands 117 15 7 15 19
Interior Bottomlands 25 18 6.6 12 32
Brooks Range 23 32 15 17 41
Alaska Range 983 36 23 31 42
Interior Forested Lowlands & Uplands 34 12 6 12 17
Chloride concentration, milligram per liter
Yukon Stikine Highlands 149 0.3 0.2 0.3 0.3
Yukon Southern Lakes 675 0.6 0.3 0.4 0.6
Boreal Mountains and Plateaus 163 0.3 0.2 0.3 0.3
Interior Highlands 117 0.8 0.4 0.8 1
Interior Bottomlands 26 0.6 0 0.3 1.2
Brooks Range 23 0.7 0.4 0.6 1
Alaska Range 979 1.9 1 1.6 2.5
Interior Forested Lowlands & Uplands 34 1.1 0.4 0.7 1.4
Ecoregion
(fig. 36)
No. of
analyses
Mean
Percentile values
calculated from the data
25 50 75
Table 15. Summary statistics for selected properties and constituents of surface-water samples by ecoregion--Continued
[--, no data]

100 Environmental and Hydrologic Overview of the Yukon River Basin, Alaska and Canada
Dissolved-silica concentration, milligrams per liter
Yukon Stikine Highlands 123 2.9 2.6 3 3.4
Yukon Southern Lakes 429 4.1 3.0 3.9 5.2
Boreal Mountains and Plateaus 116 3.5 3.4 3.5 3.8
Interior Highlands 119 7.2 5.8 7.3 8.3
Interior Bottomlands 20 10.6 6.35 12 14
Brooks Range 23 2.9 2.4 2.8 3.3
Alaska Range 974 9.0 6.1 8.8 11
Interior Forested Lowlands & Uplands 34 5.3 2.7 4.9 7.3
Dissolved nitrate plus nitrate concentration, as nitrogen, milligrams per liter
Yukon Stikine Highlands 299 0.09 0.04 0.08 0.13
Yukon Southern Lakes 532 0.04 0.01 0.03 0.06
Boreal Mountains and Plateaus 588 0.06 0.01 0.04 0.06
Interior Highlands 21 0.19 0.1 0.16 0.26
Interior Bottomlands 10 0.25 0.18 0.24 0.27
Brooks Range -- -- -- -- --
Alaska Range 139 0.18 0.1 0.17 0.2
Interior Forested Lowlands & Uplands -- -- -- -- --
Total phosphorus concentration, as phosphorus, milligrams per liter
Yukon Stikine Highlands 114 0.01 0.002 0.003 0.008
Yukon Southern Lakes 1063 0.05 0.008 0.02 0.10
Boreal Mountains and Plateaus 572 0.13 0.006 0.008 0.014
Interior Highlands 37 0.08 0.01 0.03 0.07
Interior Bottomlands -- -- -- -- --
Brooks Range -- -- -- -- --
Alaska Range 102 0.23 0.02 0.08 0.3
Interior Forested Lowlands & Uplands -- -- -- -- --
Ecoregion
(fig. 36)
No. of
analyses
Mean
Percentile values
calculated from the data
25 50 75
Total organic carbon, as carbon, milligrams per liter
Yukon Stikine Highlands 145 1.4 0.5 0.6 1.6
Yukon Southern Lakes 180 1.3 0.7 1.1 1.6
Boreal Mountains and Plateaus 15 4.9 3.3 4.1 4.7
Interior Highlands 8 10.5 5.5 9.0 15.5
Interior Bottomlands -- -- -- -- --
Brooks Range -- -- -- -- --
Alaska Range 30 1.7 0.8 1 1.3
Interior Forested Lowlands & Uplands -- -- -- -- --
Dissolved organic carbon, as carbon, milligrams per liter
Yukon Stikine Highlands -- -- -- -- --
Yukon Southern Lakes -- -- -- -- --
Boreal Mountains and Plateaus -- -- -- -- --
Interior Highlands 4 4.5 3 4.5 6.1
Interior Bottomlands -- -- -- -- --
Brooks Range -- -- -- -- --
Alaska Range 26 1.4 1.1 1.2 1.4
Interior Forested Lowlands & Uplands -- -- -- -- --
Total iron concentration, as iron, micrograms per liter
Yukon Stikine Highlands 154 169 14 32 126
Yukon Southern Lakes 692 699 128 230 478
Boreal Mountains and Plateaus 151 136 42 85 174
Interior Highlands 16 225 70 135 355
Interior Bottomlands -- -- -- -- --
Brooks Range 4 127 60 125 195
Alaska Range 71 6740 420 1000 11000
Interior Forested Lowlands & Uplands -- -- -- -- --
Ecoregion
(fig. 36)
No. of
analyses
Mean
Percentile values
calculated from the data
25 50 75
Table 15. Summary statistics for selected properties and constituents of surface-water samples by ecoregion--Continued
[--, no data]

Water Quality 101
Dissolved iron concentration, as iron, micrograms per liter
Yukon Stikine Highlands -- -- -- -- --
Yukon Southern Lakes -- -- -- -- --
Boreal Mountains and Plateaus -- -- -- -- --
Interior Highlands 40 216 115 210 285
Interior Bottomlands 10 62 10 10 50
Brooks Range 5 18 0 10 30
Alaska Range 119 73 10 30 72
Interior Forested Lowlands & Uplands -- -- -- -- --
Total manganese, as manganese, micrograms per liter
Yukon Stikine Highlands 154 5 0.5 1.5 4.0
Yukon Southern Lakes 692 31 10 18 34
Boreal Mountains and Plateaus 151 7 2.2 5 10
Interior Highlands 16 27.5 0 25 45
Interior Bottomlands -- -- -- -- --
Brooks Range -- -- -- -- --
Alaska Range 71 171 20 60 220
Interior Forested Lowlands & Uplands -- -- -- -- --
Total barium, as barium, micrograms per liter
Yukon Stikine Highlands 142 41 33 44 50
Yukon Southern Lakes 691 43 22 35 56
Boreal Mountains and Plateaus 48 25 18 29 30
Interior Highlands -- -- -- -- --
Interior Bottomlands -- -- -- -- --
Brooks Range -- -- -- -- --
Alaska Range 86 46 39 45 54
Interior Forested Lowlands & Uplands -- -- -- -- --
Ecoregion
(fig. 36)
No. of
analyses
Mean
Percentile values
calculated from the data
25 50 75
Total strontium, as strontium, micrograms per liter
Yukon Stikine Highlands 142 127 90 138 162
Yukon Southern Lakes 692 240 86 207 418
Boreal Mountains and Plateaus 48 62 62 69 72
Interior Highlands -- -- -- -- --
Interior Bottomlands -- -- -- -- --
Brooks Range -- -- -- -- --
Alaska Range 85 216 160 190 290
Interior Forested Lowlands & Uplands -- -- -- -- --
Total arsenic, as arsenic, micrograms per liter
Yukon Stikine Highlands 99 0.8 0.1 0.1 0.2
Yukon Southern Lakes --
(<25 percent of data above detection limit)
Boreal Mountains and Plateaus 148 0.5 0.3 0.4 0.6
Interior Highlands -- -- -- -- --
Interior Bottomlands -- -- -- -- --
Brooks Range -- -- -- -- --
Alaska Range 21 7.4 1 2 9
Interior Forested Lowlands & Uplands -- -- -- -- --
Total lithium, as lithium, micrograms per liter
Yukon Stikine Highlands 141 1.0 1.1 1.3 1.5
Yukon Southern Lakes 193 1.0 1.0 1.2 1.6
Boreal Mountains and Plateaus 151 0.8 0.8 0.9 1
Interior Highlands -- -- -- -- --
Interior Bottomlands -- -- -- -- --
Brooks Range -- -- -- -- --
Alaska Range -- -- -- -- --
Interior Forested Lowlands & Uplands -- -- -- -- --
Ecoregion
(fig. 36)
No. of
analyses
Mean
Percentile values
calculated from the data
25 50 75
Table 15. Summary statistics for selected properties and constituents of surface-water samples by ecoregion--Continued
[--, no data]
102 Environmental and Hydrologic Overview of the Yukon River Basin, Alaska and Canada
Data for three other trace elements, manganese, barium and
strontium, were also analyzed. Total manganese concentrations
vary widely throughout the basin but are generally highest in the
Alaska Range ecoregion and lowest in the Yukon Stikine High-
lands ecoregion. Barium and strontium were detected throughout
the Yukon River Basin. Barium is relatively constant, but stron-
tium varies widely (table 15). The highest concentrations and the
greatest variability of strontium concentrations are in the Yukon
Southern Lakes ecoregion, whereas the lowest concentrations and
least variability of strontium were found in the Boreal Mountains
and Plateaus ecoregion.
Anthropogenic Effects on Water Quality
Discussions of the water quality of the Yukon River Basin
are based on limited data and indicate that water chemistry differ-
ences throughout the basin are due more to natural factors than to
human-induced factors. However, the basin has been affected by
human activities, both from within the basin and from outside the
basin. The difficulty arises in determining to what degree humans
have affected the water quality, because a suitable water-quality
data base does not exist at the present time.
The Yukon River Basin is not subject to the intense applica-
tion of organic pollution found in some rivers of the lower 48
states. It is, however, more vulnerable to global atmospheric trans-
port. Global transport of pollutants is well recognized. In the
northern hemisphere, transport occurs primarily in the winter
months when temperature and pressure gradients are the steepest.
Pollutants from mid-latitudes are transported northward, where
greater precipitation and colder temperature cause deposition from
a "warm-cold distillation" effect (Majewski and Capel, 1995).
Chlorinated pesticides, such as HCH, HCS, DDT, toxaphene, and
chordanes, have been observed in the Arctic and are believed to
have been transported in the atmosphere. Many of the compounds
are lipophilic, concentrating in the fat and fatty tissues of fish and
game animals.
In 1991, elevated levels of toxaphene, DDT, and PCB’s were
found in burbot liver, and lake trout and whitefish muscle in Lake
Laberge near the headwaters of the Yukon River (Muir and Lock-
hart, 1992). Analysis of archived fish tissue from 1974 found con-
centrations similar to those of the 1991 sampling. The
concentrations in Lake Laberge whitefish were 3 to 42 times
higher than those in whitefish from other lakes in the region (Muir
and Lockhart, 1992). Atmospheric transport was determined to be
the source of the toxaphene and an exceptionally long food chain
served to concentrate the pollutants in the predatory fish (Kidd and
others, 1995).
Mining activity has, and continues to be, an important eco-
nomic industry in the Yukon River Basin. Probably the biggest
concern of mining is the possible harm to fish-spawning areas.
Although today’s mining practices are highly regulated to prevent
damage to fish habitat, many old abandoned mine areas remain.
One example is Coal Creek, located in Yukon-Charley Rivers
National Preserve. This particular watershed was mined exten-
sively in the early 1900’s and the mining practices used at the time
had a severe impact on the watershed. The site was declared a
Superfund site by the U.S. Environmental Protection Agency and
cleanup was completed in 1998.
During the Cold War, the military had a strong presence in
Alaska. In addition to the military bases located near Fairbanks
and Delta Junction, early warning radar sites were located at some
villages along the Yukon River. At the U.S. Air Force Base at
Galena, 250,000 drums containing potentially toxic materials are
currently spread out across the tundra as a result of a flood. The
effect on water quality has yet to be determined.
Summary 103
SUMMARY
This report describes the environmental and hydrologic set-
ting of the Yukon River Basin, the fourth largest drainage basin in
North America. The primary environmental and hydrologic fea-
tures of the Yukon River Basin are as follows:
• The population of the Yukon River Basin is approximately
126,000 people. Approximately 10 percent of these people
have a subsistence lifestyle and depend on the fish and game
resources of this 330,000-square-mile basin.
• The climate of the Yukon River Basin is variable because of its
large size and range in altitude. Precipitation ranges from 10 to
130 in. annually and the mean average air temperature is about
22 °F. The upstream part of the basin is rolling topography or
moderately high rugged mountains, whereas the downstream
part of the basin is primarily low mountains, plains, and low-
lands. The geology is complex and consists of many types of
consolidated rocks in the mountain ranges surrounding the
basin and unconsolidated sediments deposited in the lowland
areas.
• Wetlands account for about 30 percent of the Yukon River
Basin. The primary land cover is needleleaf forest and the pri-
mary soils are Gelisols. Many of the Gelisols are frozen
organic soil. These soils are located in the northern third of the
basin which is underlain by continuous permafrost.
• The Yukon River Basin consists of 20 ecoregions, distinct areas
delineated by the integration of their natural features. Interior
Forested Lowlands and Uplands is the largest ecoregion of the
basin and accounts for 21 percent of the drainage area. The
Interior Highlands ecoregion is the second largest ecoregion of
the basin and accounts for about 17 percent of the drainage
area.
• Discharge from streams and rivers in the Yukon River Basin
varies depending on the presence of glaciers. Two major tribu-
taries that drain glacier areas of the Yukon River, the Tanana
River and the White River, account for 29 percent of the flow
of the Yukon River but only account for about 20 percent of
the drainage area. Melting glaciers add more water to these
rivers and sustain runoff through the summer season. The
average annual discharge of the Yukon River near its mouth is
227,000 ft
3
/s. However, most of the flow occurs from May
through September.
• Near its mouth, the Yukon River transports about 60 million
tons of suspended sediment toward the Bering Sea annually.
However, each year, about 20 million tons of sediment are
deposited on flood plains and in braided reaches of the river.
Implications of this deposition are enormous for the sequestra-
tion of organic carbon, contaminants, and other materials that
are absorbed onto, or otherwise associated with, alluvial sedi-
ments.
• The waters of the main stem of the Yukon River and its tributar-
ies are predominantly calcium magnesium bicarbonate waters
with specific conductance ranging from 54 to 373 µS/cm.
Concentrations of the nutrients nitrogen and phosphorus are
generally less than 0.5 mg/L. Temporal trends in water quality
between summer and winter are evident at some sites along the
Yukon River. Comparison of water-quality data within ecore-
gions indicates that total organic carbon concentrations were
highest in ecoregions dominated by organic soils.
• Some anthropogenic effects to water quality of the Yukon River
Basin have been documented. These effects are due to atmo-
spheric processes, pre-regulation mining, and old military sites
used during the Cold War. The cumulative effects on the
Yukon River Basin cannot be made because of a lack of water-
quality data.
104 Environmental and Hydrologic Overview of the Yukon River Basin, Alaska and Canada
REFERENCES CITED
Aagaard, K., and Carmack, E.C., 1989, The role of sea ice and other fresh water
in the Arctic circulation: Journal of Geophysical Research, v. 94, p. 14485-
14498.
Agriculture Canada, 1976, Glossary of terms in soil science: Agriculture Can-
ada, Research Branch, Publication 1459, 44 p.
Alaska Department of Labor, 1999, Research & analysis, demographics unit,
population estimates: accessed January 1999 at URL
www.labor.state.ak.us/ research/pop/popmain.htm
Alaska Geographic Society, 1987, The upper Yukon Basin: Alaska Geographic
Society Quarterly, v. 14, no. 4, 117 p.
Alaska Geographic Society, 1990, The middle Yukon River: Alaska Geographic
Society Quarterly, v. 17, no. 3, 96 p.
Alaska Geographic Society, 1991, The lower Yukon River: Alaska Geographic
Society Quarterly, v. 17, no. 4, 96 p.
Alaska Geospatial Data Clearinghouse, 1998, Preliminary vegetation classes:
accessed December 1998 at URL agdc.usgs.gov/data/usgs/ erosafo/
veg/veg.html
Alaska Geospatial Data Clearinghouse, 1999, Fire history: accessed December
1998 at URL agdc.usgs.gov/data/projects/fhm
BESIS (Bering Sea Impacts Study), 1997, The impacts of global climate change
in the Bering Sea region: Girdwood, Alaska, September 18-21, 1996, 42 p.
Bostock, H.S., 1970, Physiographic regions of Canada: Geological Survey of
Canada, Map 1254A, scale 1:5,000,000.
Brown, J., Ferrians, Jr., O.J., Heginbottom, J.A., and Melnikov, E.S., 1997, Cir-
cum-Arctic map of permafrost and ground ice conditions: U.S. Geological
Survey Circum-Pacific Map Series, Map CP-45.
Burrows, R.L., 1980, Cross-section, velocity, and bedload data at two erosion
sites on the Tanana River near Fairbanks, Alaska, 1979: U.S. Geological
Survey Open-File Report 80-699, 32 p.
Burrows, R.L., Emmett, W.W., and Parks, Bruce, 1981, Sediment transport in
the Tanana River near Fairbanks, Alaska, 1977-79: U.S. Geological Sur-
vey Water-Resources Investigations 81-20, 42 p.
Burrows, R.L., and Harrold, P.E., 1983, Sediment transport in the Tanana River
near Fairbanks, Alaska, 1980-81: U.S. Geological Survey Water-
Resources Investigations Report 83-4064, 116 p.
Burrows, R.L., Parks, Bruce, and Emmett, W.W., 1979, Sediment transport in
the Tanana River in the vicinity of Fairbanks, Alaska, 1977-78: U.S. Geo-
logical Survey Open-File Report 79-1539, 37 p.
Chapman, W.L., and Walsh, J.E., 1993, Recent variations of sea ice and air tem-
peratures in high latitudes: Bulletin of American Meteorology Society, v.
74, no. 1, p. 33-47.
Childers, J.M., Meckel, J.P., and Anderson, G.S., 1972, Floods of August 1967
in east-central Alaska, with a section on Weather features contributing to
the floods, by E.D. Diemer, U.S. Weather Bureau: U.S. Geological Survey
Water-Supply Paper 1880-A, 77 p.
Colby, B.R., 1956, Relationship of sediment discharge to streamflow: U.S. Geo-
logical Survey Open-File Report, 170 p.
Cowardin, L.M., Carter, Virginia, Golet, F.C., and LaRoe, E.T., 1979, Classifi-
cation of wetlands and deepwater habitats of the United States: U.S. Fish
and Wildlife Service Report FWS/OBS-79/31, 131 p.
Dunne, T., Mertes, L.A.K., Meade, R.H., Richey, J.E., and Forsberg, B.R.,
1998, Exchanges of sediment between the flood plain and channel of the
Amazon River in Brazil: Geological Society of America Bulletin, v. 110,
p. 450-467.
Ecological Stratification Working Group, 1995, A national ecological frame-
work for Canada: Hull, Ottawa, Agriculture and Agri-Food Canada and
Environment Canada, Report and National Map, scale 1:7,500,000.
Emmett, W.W., Burrows, R.L., and Parks, Bruce, 1978, Sediment transport in
the Tanana River in the vicinity of Fairbanks, Alaska, 1977: U.S. Geolog-
ical Survey Open-File Report 78-290, 28 p.
Environment Canada, 1999, Yukon SOE [state of the environment] highlights
—Land and people: accessed January 1999 at URL www.taiga.net/
yukonsoe/hilp.html
Ferrians, O.J., Jr., 1965, Permafrost map of Alaska: U.S. Geological Survey
Miscellaneous Geologic Investigations Map I-445, scale 1:2,500,000.
References Cited 105
Foote, M.J., 1976, Classification, description, and dynamics of plant communi-
ties following fire in the taiga of interior Alaska—Fire effects study: Fair-
banks, Alaska, U.S. Department of Agriculture Forest Service, Institute of
Northern Forestry report.
Fretwell, J.D., Williams, J.S., and Redman, P.J., compilers, 1996, National
water summary on wetland resources: U.S. Geological Survey Water-Sup-
ply Paper 2425, 431 p.
Gallant, A.L., Binnian, E.F., Omernik, J.M., and Shasby, M.B., 1995, Ecore-
gions of Alaska: U.S. Geological Survey Professional Paper 1567, 73 p.,
1 plate.
Gordey, S.P., and Makepeace, A.J. (compilers), 1999, Yukon digital geology:
Geological Survey of Canada, Open File D3826, Exploration and Geolog-
ical Services Division, Yukon, Indian and Northern Affacirs Canada, Open
File 1999-1(D), CD-ROM.
Harrold, P.E., and Burrows, R.L., 1983, Sediment transport in the Tanana River
near Fairbanks, Alaska, 1982: U.S. Geological Survey Water-Resources
Investigations Report 83-4213, 53 p.
Hartman, C.W., and Johnson, P.R., 1978, Environmental atlas of Alaska (2
d
ed.): University of Alaska, Institute of Water Resources, 95 p.
Holder, R.R., and Senecal-Albrecht, D., 1998, Yukon River comprehensive
salmon plan for Alaska: Alaska Department of Fish and Game Report for
the Yukon River Regional Planning Team, 162 p.
Indian and Northern Affairs Canada, 1999, Yukon Territory, Canada, forest fire
history database, 1946-1997: Whitehorse, Yukon, Indian and Northern
Affairs Canada, Forest Management, CD-ROM.
Jones, S.H., and Fahl, C.B., 1994, Magnitude and frequency of floods in Alaska
and conterminous basins of Canada: U.S. Geological Survey Water-
Resources Investigations Report 93-4179, 122 p. + 2 pl.
Juday, G.P., Ott, R.A., Valentine, D.W., and Barber, V.A., 1998, Forests, climate
stress, insects, and fire, in Weller, G. and Anderson, P.A. (eds.), Implica-
tions of global change in Alaska and the Bering Sea Region: University of
Alaska, Fairbanks, Center for Global Change and Arctic System Research,
Proceedings of a Workshop, June 1997, p. 23.
Kidd, K.A., Schindler, D.W., Muir, D.C., Lockhart, W.L., and Hesslein, R.H.,
1995, High concentrations of toxaphene in fishes from a subarctic lake:
Science, v. 269, p. 240-241.
Lamke, R.D., 1991, Alaska floods and droughts, in Paulson, R.W., and others,
National water summary, 1988-89—Hydrologic events and floods
droughts: U.S. Geological Survey Water-Supply Paper 2375, p. 171-180.
Lisitsysn, A.P., 1969, Recent sedimentation in the Bering Sea: Washington,
D.C., National Science Foundation, The Israel Program for Scientific
Translations (translated from Russian).
Majewski, M.S., and Capel, P.D., 1995, Pesticides in the atmosphere—Distri-
bution, trends, and governing factors: Chelsea, Michigan, Ann Arbor
Press, 214 p.
Meade, R.H., Yuzyk, T.R., and Day, T.J., 1990, Movement and storage of sedi-
ment in rivers of the United States and Canada, in Wolman, M.G., and
Riggs, H.C., eds., Surface water hydrology: Geological Society of Amer-
ica, The geology of North America, v. O-1, p. 255-280.
Meier, M.F., 1969, Glaciers and water supply: Journal of the American Water
Works Association, v. 61, no. 1, p. 8-12.
Meyer, D.F., 1995, Flooding in the Middle Koyukuk River Basin, Alaska,
August 1994: U.S. Geological Survey Water-Resources Investigations
Report 95-4118, 8 p. + 2 plates.
Muir, D., and Lockhart, W.L., 1992, Food chain accumulation and biochemical
effects of organochlorine contaminants in fish from Lake Laberge and
other Yukon lakes, in Murray, J.L., and Shearer, R.G., eds., Synopsis of
research conducted under the 1991/1992 Northern Contaminants Program:
Ottawa, Minister of Indian Affairs and Northern Development, Environ-
mental Studies No. 68, p. 173-177.
Omernik, J.M., 1995, Ecoregions—A spatial framework for environmental
management, in Davis, W.S. and Simon, T., eds., Biological assessment
and criteria—Tools for water resource planning and decisions making:
Boca Raton, Florida, Lewis Publishers, p. 49-62.
Parfit, Michael, 1998, The untamed Yukon River: National Geographic Maga-
zine, v. 194, no. 1, July 1998, p. 100-127.
Paterson, W.S.B., 1994, The physics of glaciers (3
d
ed.): New York, Elsevier
Science Inc., 480 p.
106 Environmental and Hydrologic Overview of the Yukon River Basin, Alaska and Canada
Rieger, S., Schoephorster, D.B., and Furbish, C.E., 1979, Exploratory soil sur-
vey of Alaska: U.S. Department of Agriculture, Soil Conservation Service,
213 p.
Schumm, S.A., and Winkley, B.R., 1994, The character of large alluvial rivers,
in Schumm, S.A., and Winkley, B.R., eds., The variability of large alluvial
rivers: New York, American Society of Civil Engineers, p. 1-9.
Searby, H.W., 1968, Climates of the States—Alaska: Environmental Data Ser-
vice ESSA, Climatology of the United States, No. 60-49.
Silberling, N.J., Jones, D.L., Monger, J.W.H., Coney, P.J., Berg, H.C., and
Plafker, George, 1994, Lithotectonic terrane map of Alaska and adjacent
parts of Canada, in Plafker, George, and Berg, H.C., eds., The geology of
Alaska: Geological Society of America, The geology of North America,
v. G-1, plate 3, 1 sheet, scale 1:7,500.000.
Singer, M.J., and Munns, D.N., 1987, Soils
—An introduction: New York, Mac-
millan Publishing Company, 492 p.
Talbot, S.S., and Markon, C.J., 1986, Vegetation mapping of the Nowitna
National Wildlife Refuge, Alaska using Landsat MSS digital data: Photo-
grammetric Engineering and Remote Sensing, v. 52, no. 6, p. 791-799.
Thorson, R.M., and Dixon, E.J., Jr., 1983, Alluvial history of the Porcupine
River, Alaska—Role of glacial lake overflow from northwest Canada:
Geological Society of America Bulletin, v. 94, no. 5, p. 576-589.
U.S. Department of Agriculture, 1975, Soil taxonomy—A basic system of soil
classification for making and interpreting soil surveys: Soil Conservation
Service, U.S. Department of Agriculture Handbook 436, 754 p.
U.S. Environmental Protection Agency, 1977, Quality criteria for water, 1976:
U.S. Government Printing Office, 256 p.
U.S. Geological Survey, 1954-62, Quantity and quality of surface waters of
Alaska. Annual reports as follows: water years 1951-53, Water-Supply
Paper 1466; water years 1954-56, Water-Supply Paper 1486; water year
1957, Water-Supply Paper 1500; water year 1958, Water-Supply Paper
1570; water year 1959, Water-Supply Paper 1640; and water year 1960,
Water-Supply Paper 1720.
U.S. Geological Survey, 1970-71a, Quality of surface waters of Alaska. Annual
reports as follows: water years 1964, Water-Supply Paper 1959; water year
1965, Water-Supply Paper 1966; water year 1966, Water-Supply Paper
1996.
U.S. Geological Survey, 1971b, Surface-water supply of the United States,
1961-65, Part 15, Alaska: U.S. Geological Survey Water-Supply Paper
1936.
U.S. Geological Survey, 1976, Surface-water supply of the United States, 1966-
70, Part 15, Alaska: U.S. Geological Survey Water-Supply Paper 2136.
U.S. Geological Survey, 1972-75, Water resources data for Alaska, 1971-74,
Part 1, Surface water records: U.S. Geological Survey Water-Data Reports
AK-71 to AK-74 (published annually).
U.S. Geological Survey, 1976-97, Water resources data for Alaska, water years
1975-96: U.S. Geological Survey Water-Data Reports AK-75-1 to
AK-96-1 (published annually).
U.S. Geological Survey, 1987, Hydrologic unit map—1987, State of Alaska:
U.S. Geological Survey map, 1 sheet, scale 1:2,500,000.
Wahrhaftig, C., 1965, Physiographic divisions of Alaska: U.S. Geological Sur-
vey Professional Paper 482, 51 p., 6 plates.
