METRA 2022 CUSTOMER
SATISFACTION SURVEY
November 2022
Prepared for the Regional Transportation Authority

METRA 2022 CUSTOMER SATISFACTION SURVEY
November 2022
i
CONTENTS
1.0 INTRODUCTION ................................................................................ 1
2.0 SURVEY DESIGN .............................................................................. 2
3.0 SURVEY ADMINISTRATION & DISTRIBUTION ............................... 5
3.1 SURVEY ADMINISTRATION ...................................................................5
3.2 RESPONSE RATES ................................................................................5
3.3 CLEANING, MERGING, AND WEIGHTING.............................................7
4.0 RESULTS ........................................................................................... 8
4.1 DEMOGRAPHIC INFORMATION ............................................................8
4.2 RESULTS BY YEAR .............................................................................. 14
4.3 RESULTS BY METRA LINE .................................................................. 25
4.4 DRIVERS OF SATISFACTION .............................................................. 31
DERIVED IMPORTANCE ..................................................................... 32
QUADRANT CHARTS .......................................................................... 33
4.5 ADDITIONAL RESULTS ........................................................................ 35
5.0 CONCLUSION .................................................................................. 40
APPENDIX A. 2022 QUESTIONNAIRE ............................................... A-1
METRA CS SURVEY 2022 ........................................................................ A-1
RAIL LINE, STATION AND TICKET USAGE ............................................. A-1
GENERAL METRA USAGE ....................................................................... A-5
SATISFACTION WITH METRA SERVICE ................................................. A-6
DEMOGRAPHICS .................................................................................... A-10
APPENDIX B. SEAT DROP POSTCARD ALLOCATION ................... B-1
APPENDIX C. CROSSTABS ............................................................... C-1
ii
LIST OF FIGURES
FIGURE 1: SCREENSHOT OF ATTRIBUTE SATISFACTION QUESTIONS IN
METRA WEB SURVEY .............................................................................................. 3
FIGURE 2: METRA IMPORTANCE RANKINGS................................................................ 4
FIGURE 3: GENDER BY YEAR ......................................................................................... 8
FIGURE 4. HIGHEST LEVEL OF EDUCATION COMPLETED BY YEAR ......................... 9
FIGURE 5. AGE BY YEAR .............................................................................................. 10
FIGURE 6. CURRENT EMPLOYMENT STATUS BY YEAR ............................................ 11
FIGURE 7. HOUSEHOLD ANNUAL INCOME BY YEAR ................................................. 12
FIGURE 8. RACE BY SURVEY YEAR............................................................................. 13
FIGURE 9: OVERALL SATISFACTION BY YEAR .......................................................... 14
FIGURE 10: LIKELIHOOD TO RECOMMEND METRA BY YEAR .................................. 15
FIGURE 11: AVAILABILITY OF CAR FOR TRIP BY YEAR ............................................ 16
FIGURE 12: SATISFACTION WITH ONBOARD PERSONNEL COURTESY BY
YEAR ....................................................................................................................... 17
FIGURE 13: SATISFACTION WITH SERVICE DELIVERY BY YEAR ............................. 19
FIGURE 14: SATISFACTION WITH SAFETY BY YEAR ................................................. 20
FIGURE 15: SATISFACTION WITH INFORMATION AND COMMUNICATION
BY YEAR ................................................................................................................. 21
FIGURE 16: SATISFACTION WITH CLEANLINESS AND COMFORT BY YEAR ........... 23
FIGURE 17: SATISFACTION WITH REGIONAL TRANSPORTATION BY YEAR ........... 24
FIGURE 18: OVERALL SATISFACTION BY METRA LINE ............................................ 26
FIGURE 19: LIKELIHOOD TO RECOMMEND BY METRA LINE .................................... 27
FIGURE 20. SATISFACTION WITH ONBOARD PERSONNEL COURTESY BY
METRA LINE ........................................................................................................... 28
FIGURE 21: 2022 DERIVED IMPORTANCE COEFFICIENTS ......................................... 33
FIGURE 22: KEY DRIVERS OF OVERALL SATISFACTION CHART ............................. 34
FIGURE 23. TELECOMMUTE FREQUENCY WORK-RELATED RIDERS
(AMONG THOSE WHOSE EMPLOYER ALLOWS TELECOMMUTING) ................. 36
FIGURE 24: METRA TICKET TYPE ................................................................................ 37
FIGURE 25: USUAL PAYMENT METHOD FOR TICKET ................................................ 38
FIGURE 26: PURCHASE LOCATION FOR TICKET ....................................................... 39
FIGURE 27: SEAT DROP POSTCARDS DISTRIBUTED BY LINE ................................ B-1
LIST OF TABLES
TABLE 1: METRA 2022 RETURNED SURVEYS BY RECRUITMENT SOURCE .............. 6
TABLE 2: RIDERSHIP DATA, SAMPLE COMPOSITION, AND EXPANSION
FACTOR .................................................................................................................... 6
TABLE 3: SATISFACTION WITH SAFETY BY METRA LINE ......................................... 29
TABLE 4: SATISFACTION WITH INFORMATION AND COMMUNICATION BY
METRA LINE ........................................................................................................... 29
TABLE 5: SATISFACTION WITH CLEANLINESS AND COMFORT BY METRA
LINE ......................................................................................................................... 30
TABLE 6: TOP FIVE MOST IMPORTANT ATTRIBUTES ................................................ 31
TABLE 7: QUADRANT CHARTS EXPLANATION .......................................................... 34

Metra 2022 Customer Satisfaction Survey
1
1.0 INTRODUCTION
This report summarizes the findings of the 2022 Metra Customer Satisfaction study conducted
in April 2022 on behalf of Metra and the Regional Transportation Authority (RTA). The 2022
study, the newest study in an ongoing effort, began in 2020 but was halted due to the COVID-19
pandemic. The purpose of the ongoing effort is to understand customer perceptions of quality of
Metra service, and the results from this study will help to evaluate performance and inform
future service adjustments. Comparable studies were conducted on behalf of CTA and Pace to
measure similar aspects of service to gain an understanding of satisfaction with transit service
in the six-county RTA service region. A survey was developed and distributed to Metra
customers via postcards handed out at stations, a seat drop, and emailed invitations. The effort
resulted in a total of 5,044 surveys being returned and used for analyses in the following
sections.

Metra 2022 Customer Satisfaction Survey
2
2.0 SURVEY DESIGN
The 2022 Metra Customer Satisfaction Survey was an online-only survey. To help reduce
survey fatigue and improve data quality the survey was programmed using proprietary software
which allowed customization of questions by logical skips and question wording based on
answers to previous questions. The 2022 survey was designed to align closely with the 2016
survey to allow for comparisons over time; however, adjustments were made to reflect current
events. For example, a question about Metra’s response to the COVID-19 pandemic was
added, and to maximize response rates, the survey instrument used in 2016 was substantially
shortened.
Following a similar format as CTA and Pace surveys, the 2022 Metra survey began with asking
respondents about general Metra usage. This section included questions about what line
respondents ride and which Metra station they get on the train. These questions allow for a
better understanding of customer satisfaction among various segments of riders.
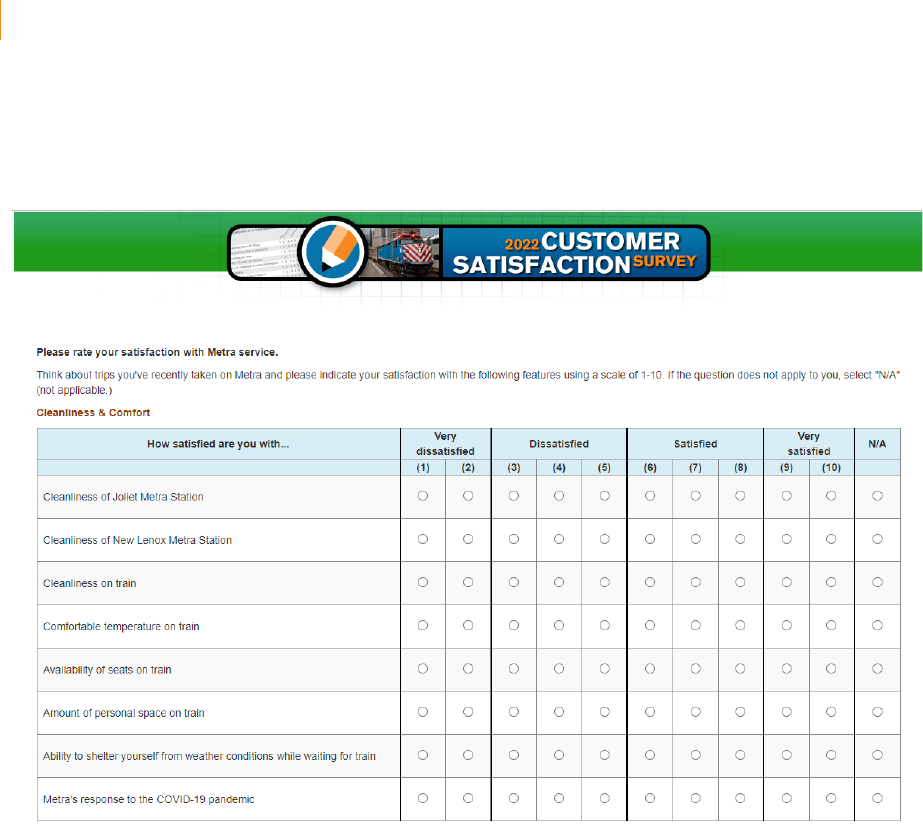
With regard to satisfaction questions, Metra measured a set of 26 attributes across seven
service dimensions using a 10-point scale. Respondents were asked to assign a value to their
satisfaction with each attribute using the 10-point scale with 1 being “Very Unsatisfied” and 10
being “Very Satisfied”. Respondents were also able to select not applicable (“n/a”). See Figure 1
for a screenshot of the cleanliness and comfort page, as an example for how satisfaction
attribute questions were presented. Specifically, the service dimensions that were included in
the survey were:
- Service Delivery
- Employee Performance
- Security
- Likelihood to Recommend
- Information and Communication
- Cleanliness and Comfort
- Overall Service
Metra 2022 Customer Satisfaction Survey
3
FIGURE 1: SCREENSHOT OF ATTRIBUTE SATISFACTION QUESTIONS IN METRA WEB SURVEY
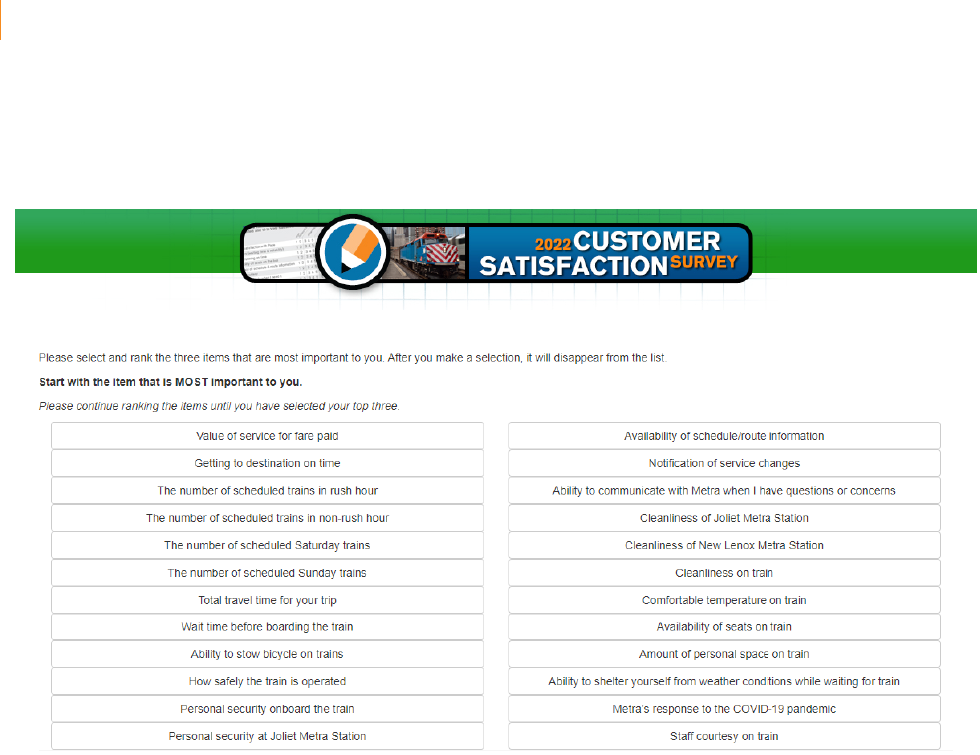
In addition to the customer satisfaction questions, the survey asked respondents to rank the
service attributes that are most important to them (Figure 2). Responses to this question provide
insight into survey respondents’ priorities, and which attributes drive the overall customer
experience. Metra may choose to prioritize to improve satisfaction with attributes that survey
respondents view as more important.
Metra 2022 Customer Satisfaction Survey
4
FIGURE 2: METRA IMPORTANCE RANKINGS
Additionally, participants were asked about six regional attributes that were part of each Service
Board’s survey. Two of the six regional attributes were new to the 2022 survey: the availability
of connecting services near transit such as bike share and the condition of transit infrastructure.
The last section of the survey asked respondents a series of demographic questions. This
demographic section asked respondents about their age, gender, race/ethnicity, and more.

Metra 2022 Customer Satisfaction Survey
5
3.0 SURVEY ADMINISTRATION & DISTRIBUTION
3.1 SURVEY ADMINISTRATION
Most responses to the survey came from email invitations sent to Metra’s marketing database
and service alert customer list. These emails were sent on March 22 and 31, 2022. Those who
had not yet completed the survey by April 11, 2022, were sent a subsequent reminder email,
and the process was repeated for a final April 21, 2022, reminder. Survey invitations were also
posted on Metra’s Twitter feed, and a link to the survey was posted on Metra’s website.
In addition to online outreach, this year’s recruitment included an intercept component. The
project team coordinated with Metra for a seat-drop effort on April 4, 2022, where roughly
20,000 postcards were placed on select trains of all Metra lines, approximately proportional to
ridership. These postcards included a URL to the online survey and a unique password that
allowed respondents to take the survey. The same postcards were also distributed at the five
major downtown Chicago stations (Union, Ogilvie, LaSalle, Millennium, and Van Buren)
between April 12 and April 24, 2022. A full recruitment effort breakdown can be found in Table
1.
3.2 RESPONSE RATES
5,044 respondents completed the survey and were retained in the dataset. Out of 31,232 email
invitations, 3,166 recipients successfully completed the survey – a 10% response rate
compared to 13% in 2016. Additional social media and online recruitment efforts conducted by
Metra yielded 220 completes: 138 via the Metra website, 43 from Twitter, and 39 from
Facebook. Finally, postcard distribution, which was a new recruitment method addition this year,
resulted in an additional 1,114 and 544 completed surveys through seat drops and postcard
handouts, respectively. Postcard distribution allowed for Metra to survey those who may not be
included in the email list or do not have social media.
Metra 2022 Customer Satisfaction Survey
6
TABLE 1: METRA 2022 RETURNED SURVEYS BY RECRUITMENT SOURCE
Recruitment Source
Outreach Total
Survey Completes
Return Rate
Email Invitation
31,232
3,166
10.1%
Postcard Seat Drop
20,000
1,114
5.57%
Station-Based Postcard Handout
17,500
544
3.1%
Metra Website
-
138
-
Twitter
-
43
-
Facebook
-
39
-
Total
68,732
5,044
7.0%
Note: Results reflect unweighted, collected surveys. Response rates are not computed for
website completes and social media outreach, since it is impossible to determine how many
potential respondents were reached.
Table 2 shows the breakdown of returned surveys by line. The unweighted returned surveys by
line generally mirrors the ridership by line.
TABLE 2: RIDERSHIP DATA, SAMPLE COMPOSITION, AND EXPANSION FACTOR
Line
Average
Weekday
Ridership
(April 2022)
Percent of
Total
Ridership
Unweighted
Sample
Unweighted
Survey Proportion
MARGIN OF
ERROR BY LINE
(BASED ON OVERALL
2022 SATISFACTION)
ME
11,440
11%
582
12%
1.55%
RI
11,017
11%
681
14%
1.97%
SWS
2,554
3%
223
4%
5.20%
HC
854
1%
79
2%
7.29%
BNSF
23,088
23%
879
17%
1.65%
UP-W
10,346
10%
527
10%
2.80%
MD-W
6,392
6%
339
7%
2.64%
UP-NW
12,130
12%
856
17%
2.24%
NCS
1,419
1%
120
2%
5.14%
MD-N
7,477
7%
327
6%
1.48%
UP-N
13,473
13%
431
9%
2.02%
Total
100,190
100%
5,044
100%
0.73%

Metra 2022 Customer Satisfaction Survey
7
3.3 CLEANING, MERGING, AND WEIGHTING
Data weighting and expansion were applied to ensure that the survey sample accurately reflects
Metra’s traveling population. Initial weights were calculated using April 2022 ridership data
provided by Metra. In this year’s survey data, there were noticeable differences between the
demographics of respondents recruited via intercept methods (i.e., station-based postcard
handouts and seat drop) vs. other means. Recruitment via station-based postcard handouts
occurred system-wide in that postcards were distributed at all 5 downtown Metra stations which
serve all of Metra’s 11 lines. Further, the postcard seat drop occurred on each line, and
postcards for the seat drop were also allocated proportional to ridership by line. Thus, those
recruited via the postcard intercept methods (either station-based or seat drop) were considered
to be a truer representation of the population of Metra riders. Respondents recruited online were
therefore reweighted to the demographics of the intercept sample (station-based postcard
handout and postcard seat drop). This was achieved by applying an iterative proportional fit
(IPF) algorithm using the age, household income, ability to speak English, and race/ethnicity
information of respondents who were recruited via the postcard intercept methods as targets.
Expanded weights were calculated by maintaining each respondent’s proportional weight in the
sample as determined in the previous steps, but then expanding their values so the sum of all
weights matched the total ridership during April 2022. This expansion process allows for a more
accurate representation of Metra’s respondents and ensures that oversampled lines (e.g., UP-
NW) are not overrepresented in the results. All tabulations in the rest of the report were
conducted using the expanded data.
Metra 2022 Customer Satisfaction Survey
8
4.0 RESULTS
The following section outlines the findings from the 2022 survey, both in comparison to its
previous iterations in 2016 and 2014 and as a stand-alone year. All analyses presented below
use data weighted to proportionally represent average weekday ridership of Metra passengers
in April 2022 and are adjusted by select demographics (age, household income, race/ethnicity,
and English proficiency) of the intercept sample.
4.1 DEMOGRAPHIC INFORMATION
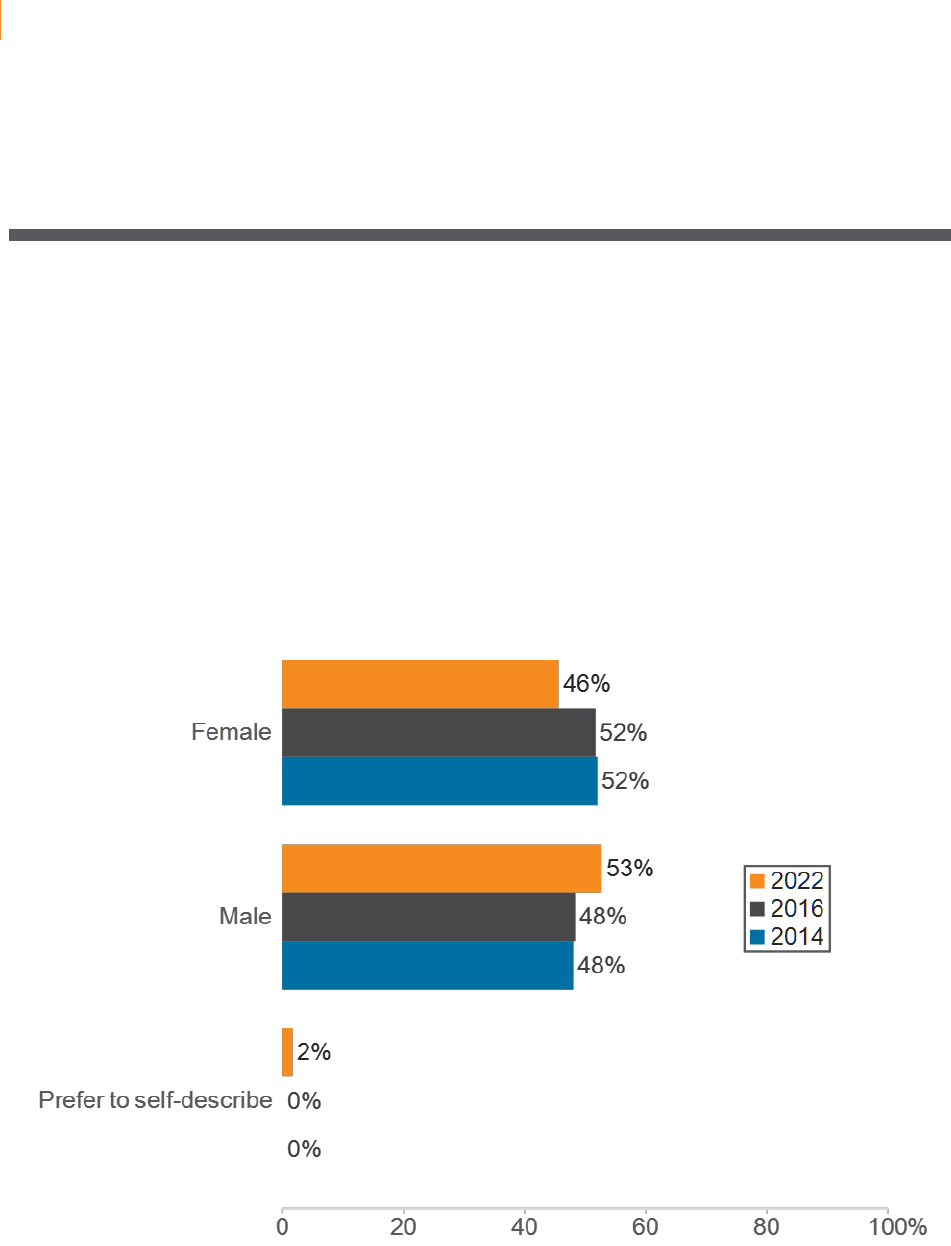
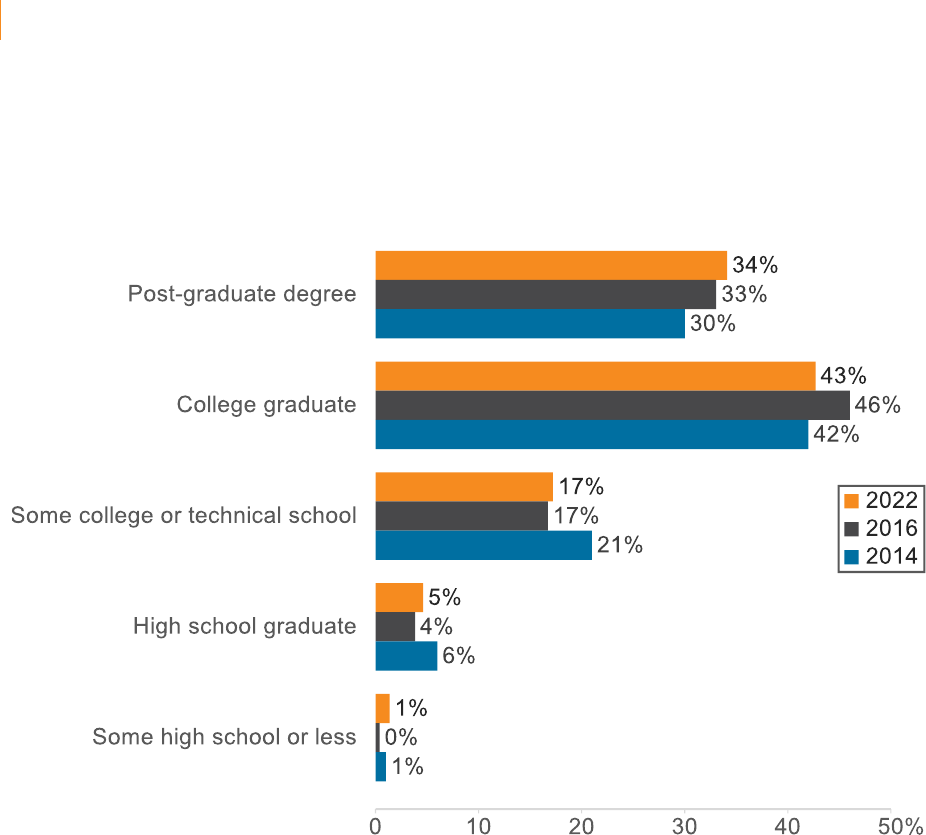
Many demographic attributes stayed relatively consistent year to year. Gender distribution and
highest level of education received, for instance, saw minimal shifts from 2016 to 2022 (Figure 3
and Figure 4).
FIGURE 3: GENDER BY YEAR
Metra 2022 Customer Satisfaction Survey
9
FIGURE 4. HIGHEST LEVEL OF EDUCATION COMPLETED BY YEAR
Metra 2022 Customer Satisfaction Survey
10
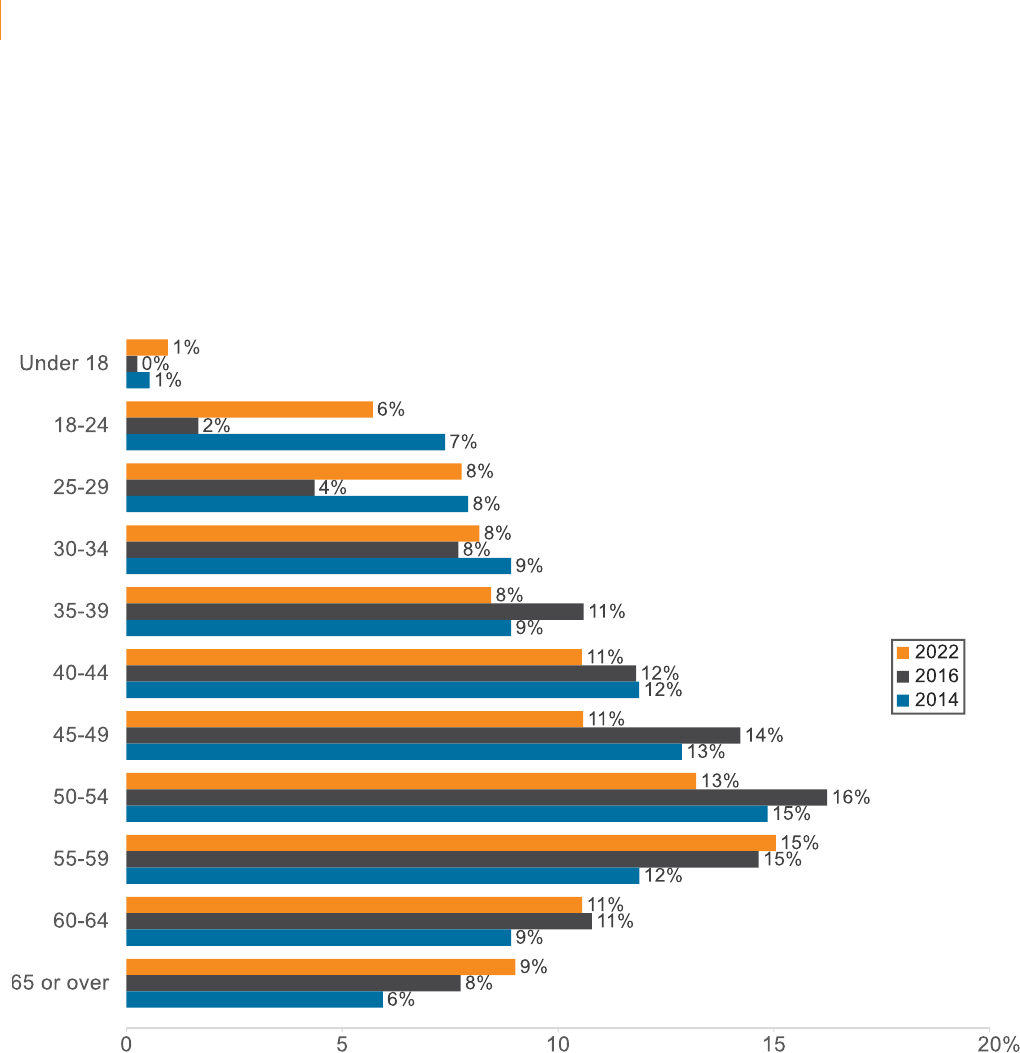
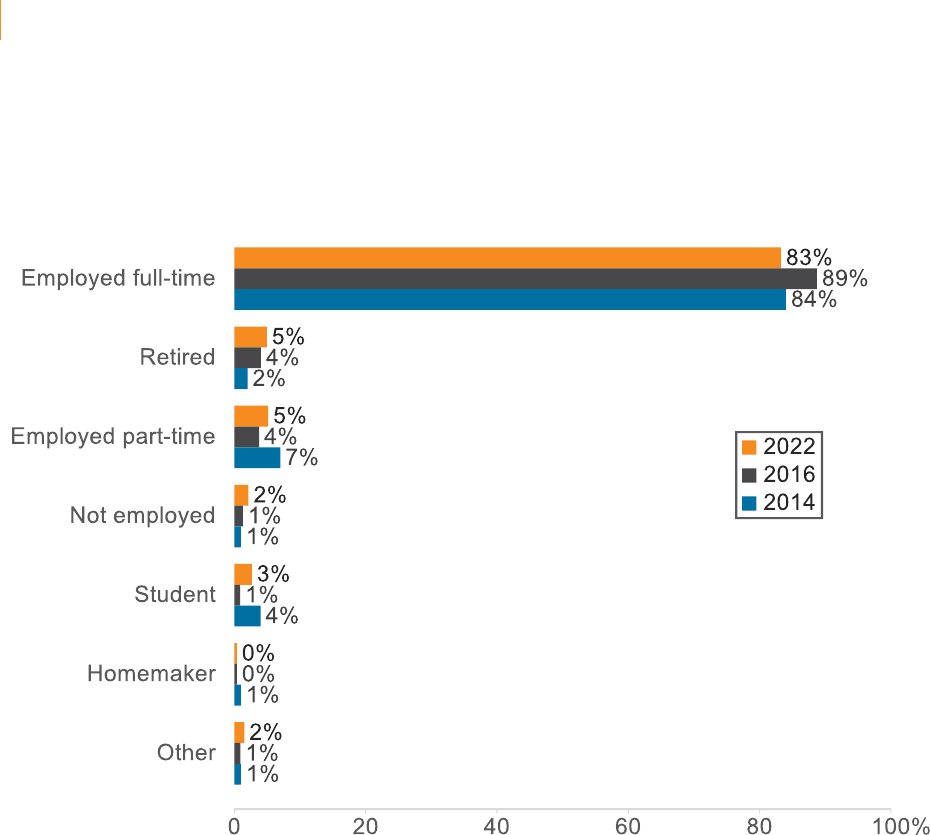
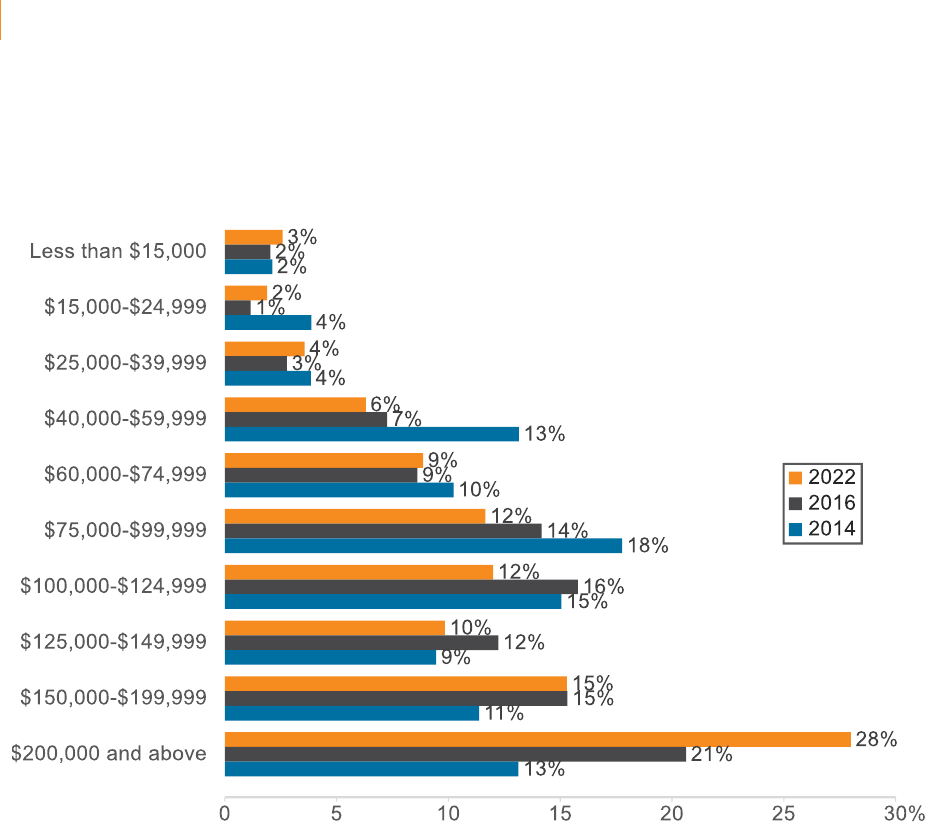
Age and employment status saw relatively minimal shifts in percentage points from the 2016 to
2022 surveys. However, respondents were more affluent in the 2022 survey with 28% reporting
an income of $200,000 or more (Figure 5, Figure 6, and Figure 7).
FIGURE 5. AGE BY YEAR
Metra 2022 Customer Satisfaction Survey
11
FIGURE 6. CURRENT EMPLOYMENT STATUS BY YEAR
Metra 2022 Customer Satisfaction Survey
12
FIGURE 7. HOUSEHOLD ANNUAL INCOME BY YEAR
Metra 2022 Customer Satisfaction Survey
13
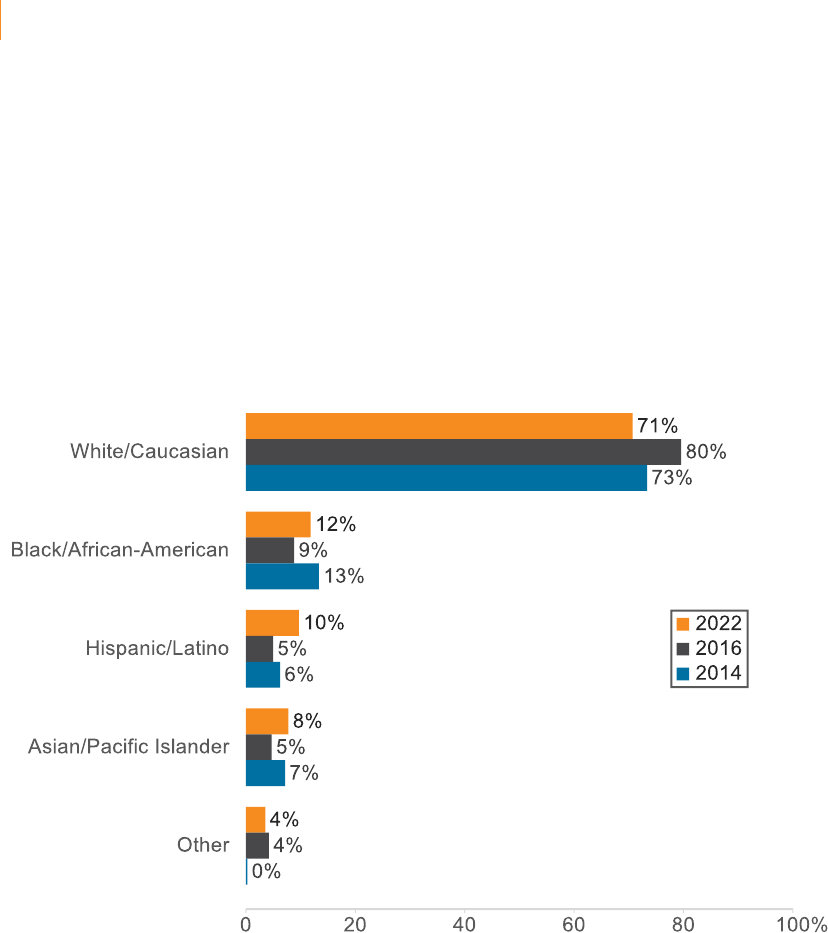
As seen in Figure 8, respondents were slightly more diverse than in 2016. While 80% of
respondents in 2016 were White/Caucasian, 71% identified the same way in 2022. Instead,
more respondents reported being Black/African-American (12% in 2022 versus 9% in 2016),
Hispanic/Latino (10% in 2022 versus 5% in 2016) and Asian/Pacific Islander (8% in 2022 versus
5% in 2016).
FIGURE 8. RACE BY SURVEY YEAR

Metra 2022 Customer Satisfaction Survey
14
4.2 RESULTS BY YEAR
Overall satisfaction with Metra services has consistently increased over the past eight years:
satisfaction in 2014 was 75%, which increased to 83% in 2016 and is at 92% in 2022. Despite
the intervening COVID-19 pandemic, Metra’s current riders clearly express a high level of
satisfaction with Metra overall (Figure 9).
FIGURE 9: OVERALL SATISFACTION BY YEAR
Metra 2022 Customer Satisfaction Survey
15
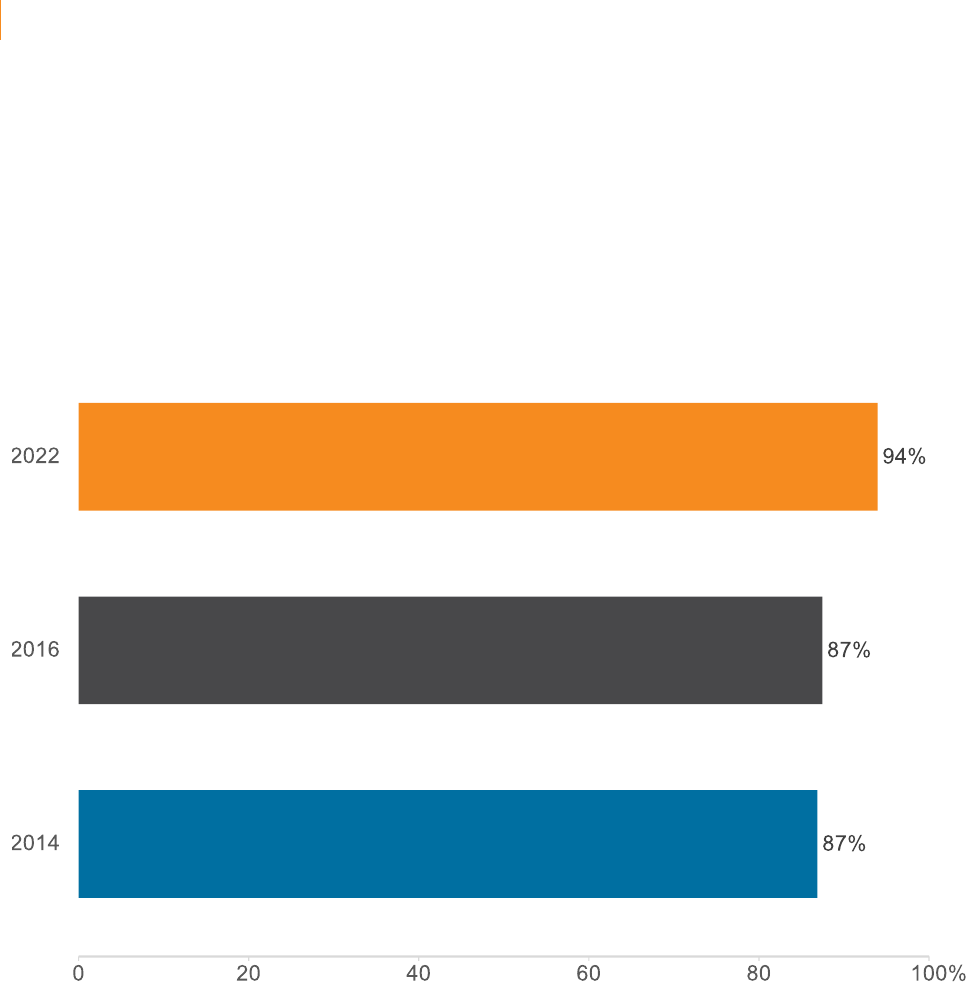
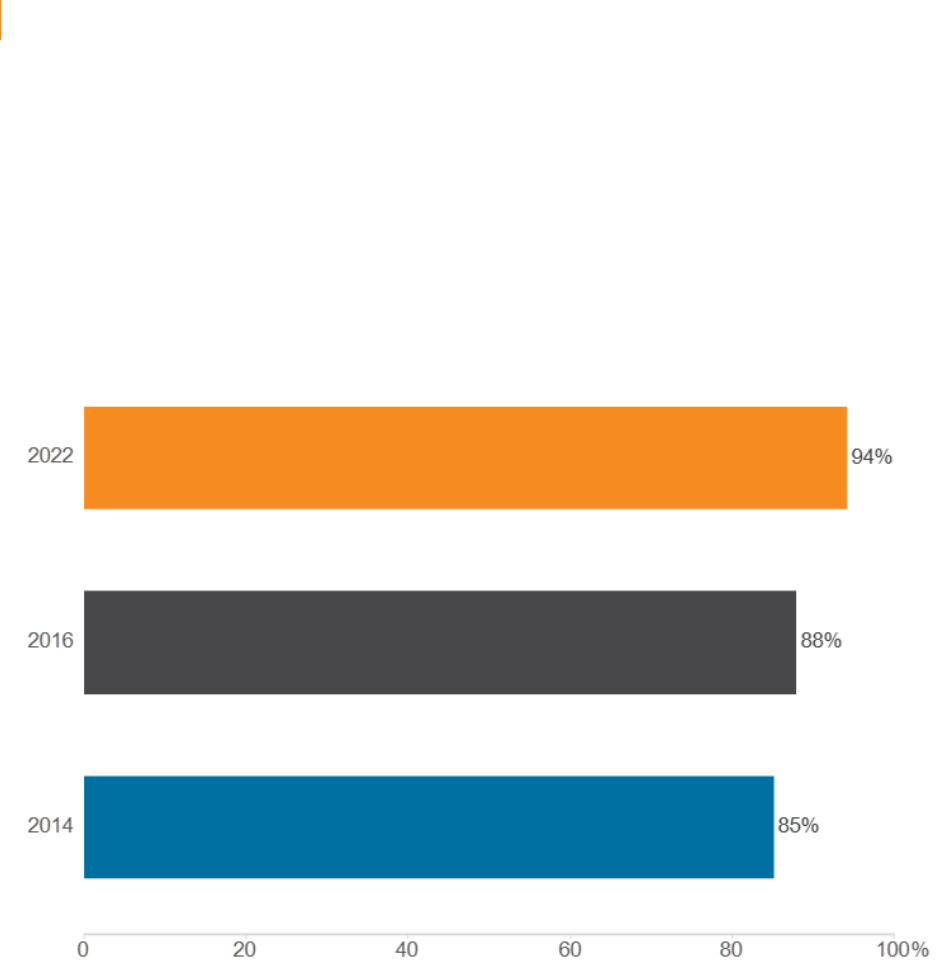
Loyalty to Metra has not only remained high but increased by seven percentage points from
87% in 2014 and 2016 to 94% in 2022. Metra riders are more likely than ever to recommend its
services to others (Figure 10).
FIGURE 10: LIKELIHOOD TO RECOMMEND METRA BY YEAR
Metra 2022 Customer Satisfaction Survey
16
Despite a slight decrease, most respondents – 83% – still report having a car available to them.
This suggests that riding Metra trains are the preferred method of travel among those who could
choose to otherwise drive to their destination (Figure 11).
FIGURE 11: AVAILABILITY OF CAR FOR TRIP BY YEAR
Metra 2022 Customer Satisfaction Survey
17
Prior years’ surveys asked respondents to rate their satisfaction with the courtesy of Metra
station and onboard staff; however, given the prevalence of ticket vending machines, the 2022
survey omitted questions regarding station agents. With a satisfaction score of 94%, up 6-
percentage points from an 88% satisfaction score in 2016, riders have clearly indicated that
Metra personnel courtesy is both noticed and appreciated by passengers (Figure 12).
FIGURE 12: SATISFACTION WITH ONBOARD PERSONNEL COURTESY BY YEAR

Metra 2022 Customer Satisfaction Survey
18
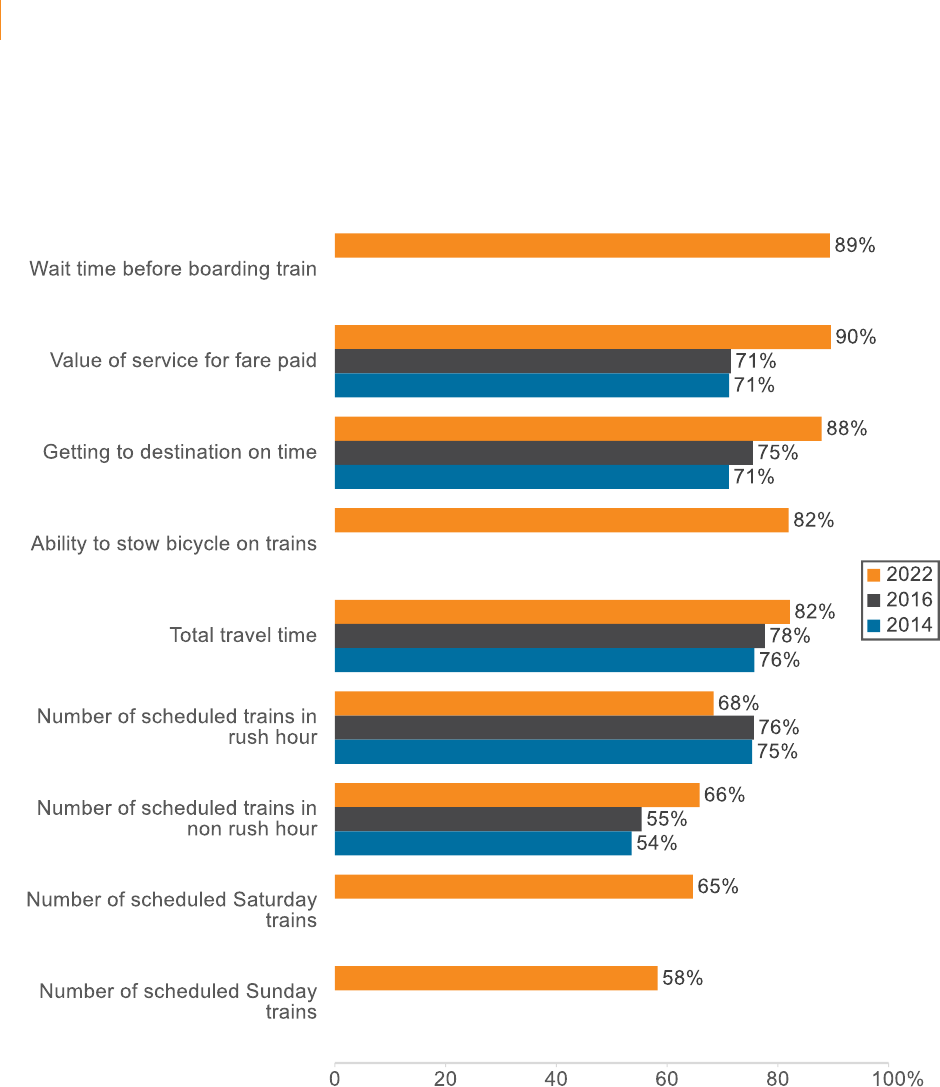
Satisfaction with service delivery attributes almost entirely improved from years past.
Satisfaction with value for fare paid and getting to destinations on time saw the highest
increases; satisfaction with value for fare paid went up 19 percentage points from 2016 to 90%
in 2022, and satisfaction with getting to one’s destination on time increased from 75% in 2016 to
88% in 2022. The increase in satisfaction with value for fare paid may be attributed to the
introduction of the $10 Day Pass in Summer 2020, the $6 Day Pass in February 2022 for travel
within three zones, or the delayed expiration of the 10-Ride Ticket. The Fair Transit South Cook
Pilot, which began in January 2021 and offers reduced Metra fares on the Metra Electric Line
and Rock Island Line, subsidized by Cook County, also may have contributed to this increase in
satisfaction. While the introduction in July 2022 of Metra’s $100 “Super Saver” Monthly Pass
pilot program began after this survey closed, this fare promotion fits the theme of the previous
fare actions that Metra riders appear to have appreciated. The single attribute that saw a
decrease in satisfaction was the number of trains in rush hour. Whereas in 2016 76% of riders
were satisfied, this year 68% were satisfied with the number of rush-hour trains. It should be
noted that Metra has continued to add back service throughout 2022, including after this survey
closed, that could impact these results if the question was asked today.
The 2016 question about weekend train availability was split up by day this year. 65% of
respondents were satisfied with the number of scheduled trains on Saturdays, and 58% with
trains on Sundays. An additional question about the ability to stow bicycles was added to this
year’s survey, and 82% of riders who answered this question were satisfied (Figure 13).
Metra 2022 Customer Satisfaction Survey
19
FIGURE 13: SATISFACTION WITH SERVICE DELIVERY BY YEAR
Note: “Wait time before boarding the train”, “ability to stow bicycles on trains”, “number of
scheduled Saturday trains”, and “number of scheduled Sunday trains” were new attributes to the
2022 survey.
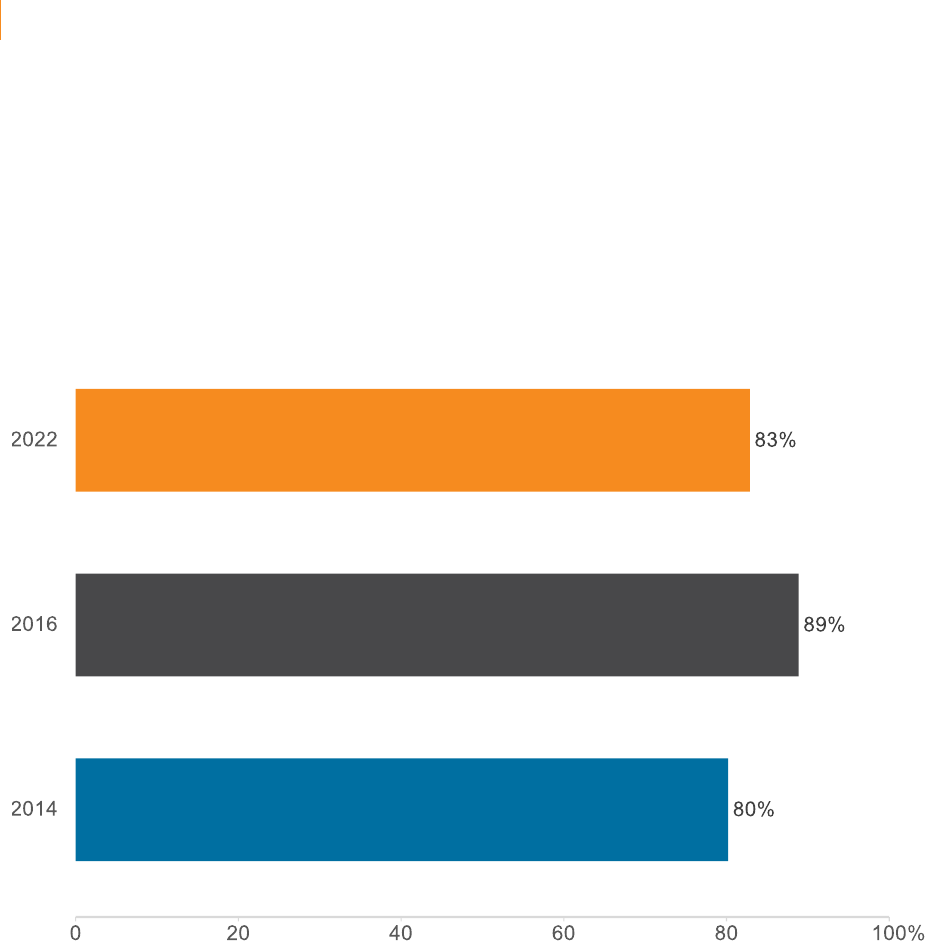
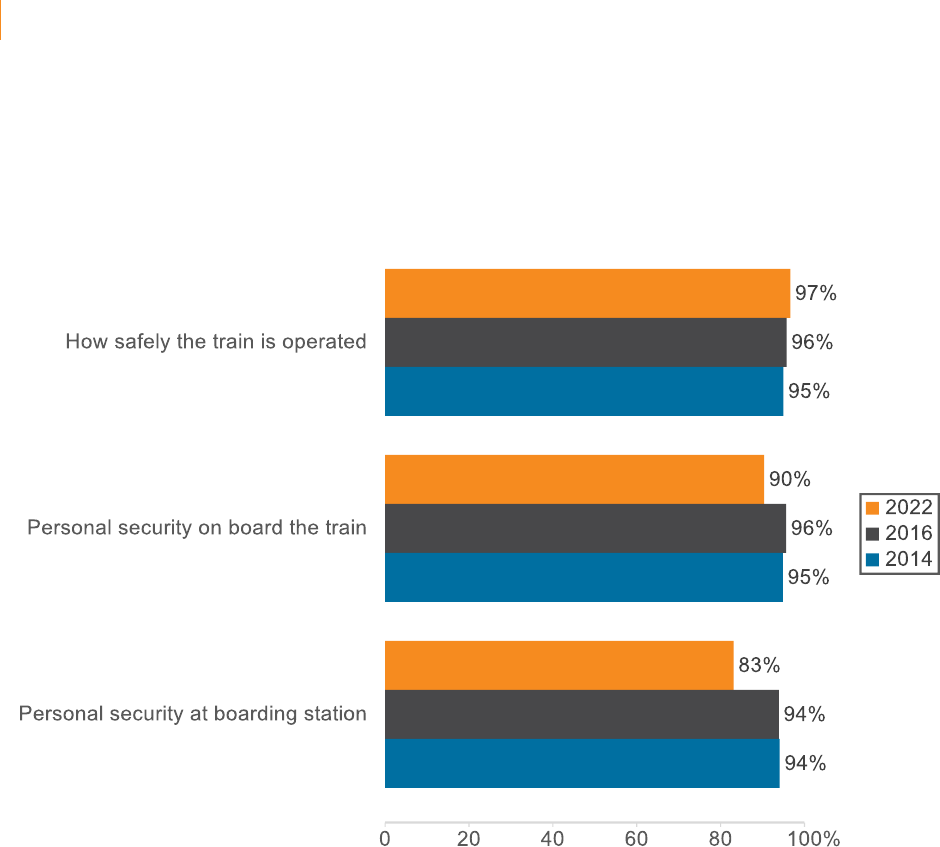
While satisfaction about how safely the train is operated remained stable this year (97%
compared to 96% in 2016), personal security concerns while on board the train and while
waiting for the train at boarding stations increased since 2016, resulting in satisfaction
decreasing from 96% to 90% and 94% to 83%, respectively (Figure 14).
Metra 2022 Customer Satisfaction Survey
20
FIGURE 14: SATISFACTION WITH SAFETY BY YEAR
Note: In previous iterations of the survey, “personal security on board the train” and “personal
security at boarding station” were phrased “personal safety on board the train” and “personal
safety at boarding station”, respectively.
Metra 2022 Customer Satisfaction Survey
21
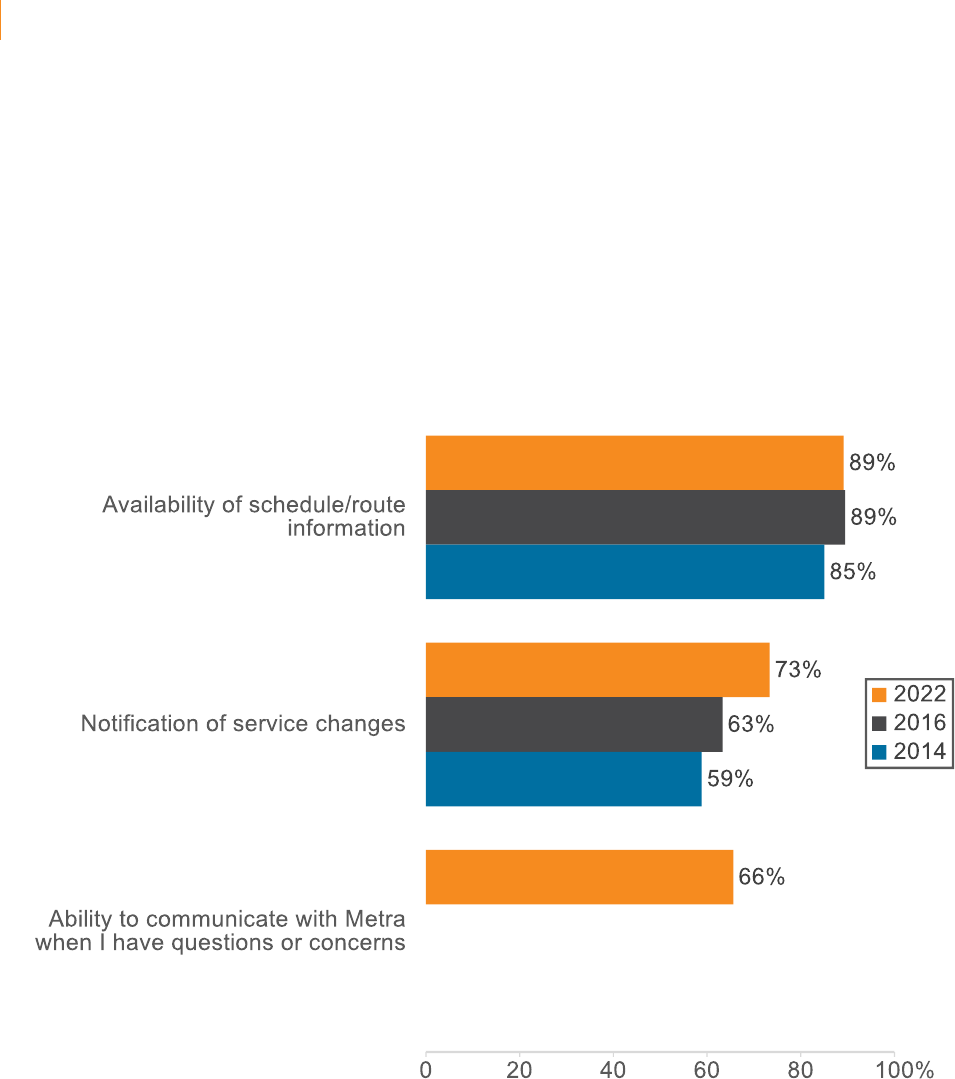
Satisfaction with information and communication remained constant or increased since the last
survey. Availability of schedule information remained stable at 89% and 73% of riders report
being satisfied with notification of service changes after a reported 63% in 2016.
A new question was also added this year that inquired into rider’s ability to communicate
questions/concerns with Metra, to which 66% of respondents indicated satisfaction (Figure 15).
FIGURE 15: SATISFACTION WITH INFORMATION AND COMMUNICATION BY YEAR
Note: “Ability to communicate with Metra when I have questions or concerns” was a new
attribute to the 2022 survey.

Metra 2022 Customer Satisfaction Survey
22
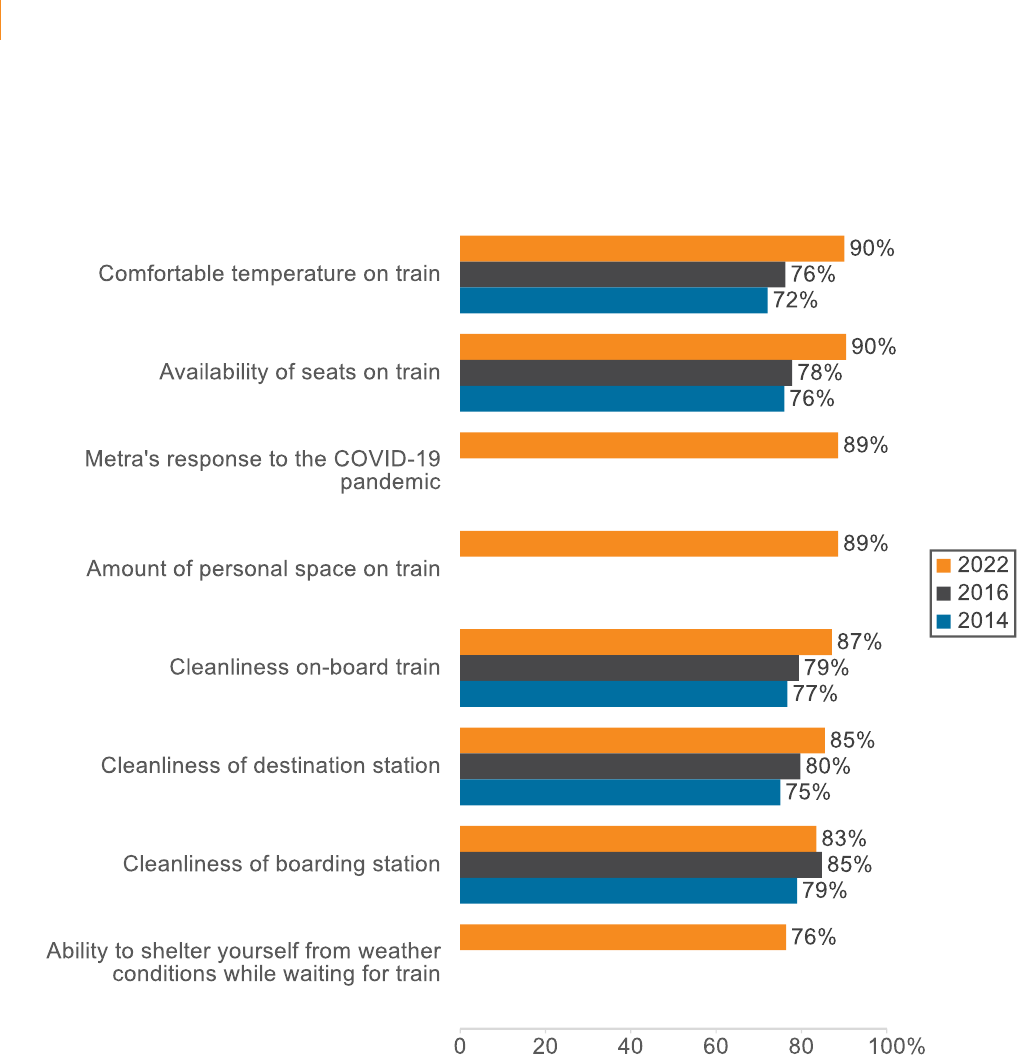
Cleanliness and comfort on Metra trains have consistently trended upward over the years, and
2022 is no different. Except for boarding station cleanliness, which decreased by two
percentage points from 85% in 2016 to 83% in 2022, every attribute saw an increase from prior
surveys, as much as 12 percentage points in the case of seat availability, which increased from
78% in 2016 to 90% in 2022. This increase in satisfaction with seat availability most likely is due
to ridership levels being lower than prior to the pandemic. Riders were asked for the first time
this year about their ability to shelter themselves from weather conditions, and 76% reported
satisfaction in this regard.
Because of the COVID-19 pandemic, satisfaction with Metra’s response to COVID-19 was
added, and 89% of riders indicated an overall positive perception of Metra’s efforts in the face of
this major global disruption (Figure 16).
Metra 2022 Customer Satisfaction Survey
23
FIGURE 16: SATISFACTION WITH CLEANLINESS AND COMFORT BY YEAR
Note: “Metra’s response to the COVID-19 pandemic,” “amount of personal space on train”, and
“ability to shelter yourself from weather conditions while waiting for train” were new attributes to
the 2022 survey.
Metra 2022 Customer Satisfaction Survey
24
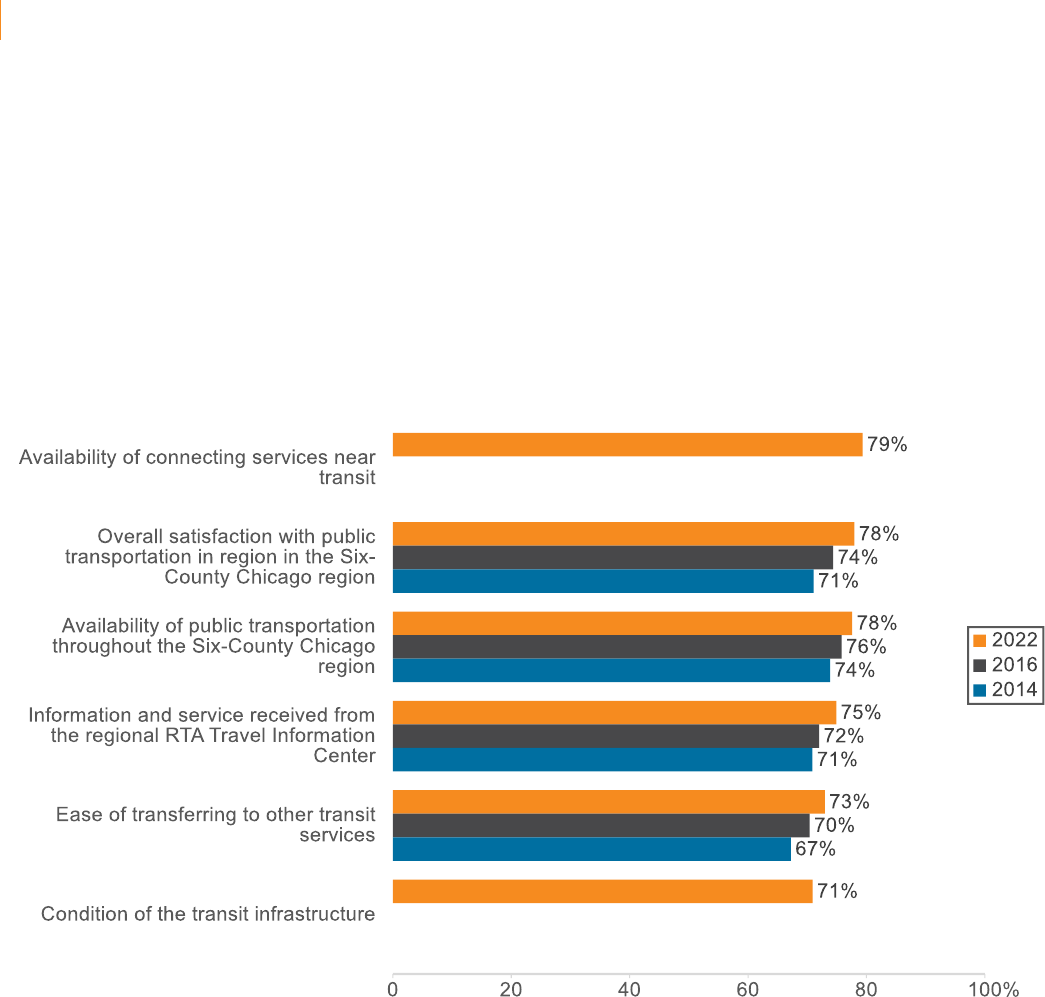
Satisfaction with regional service attributes saw modest increases across the board, ranging
from a 2 percentage point increase from 76% to 78% regarding service availability throughout
the greater Chicago area to a 4 percentage point increase from 74% to 78% in overall
satisfaction in regional service. This year’s survey also sought insight into connecting transit
service availability and transit infrastructure conditions and found that 79% and 71% of riders
indicated satisfaction to these attributes, respectively (Figure 17).
FIGURE 17: SATISFACTION WITH REGIONAL TRANSPORTATION BY YEAR
Note: “Availability of connecting services near transit” and “condition of the transit infrastructure”
were new attributes to the 2022 survey.

Metra 2022 Customer Satisfaction Survey
25
4.3 RESULTS BY METRA LINE
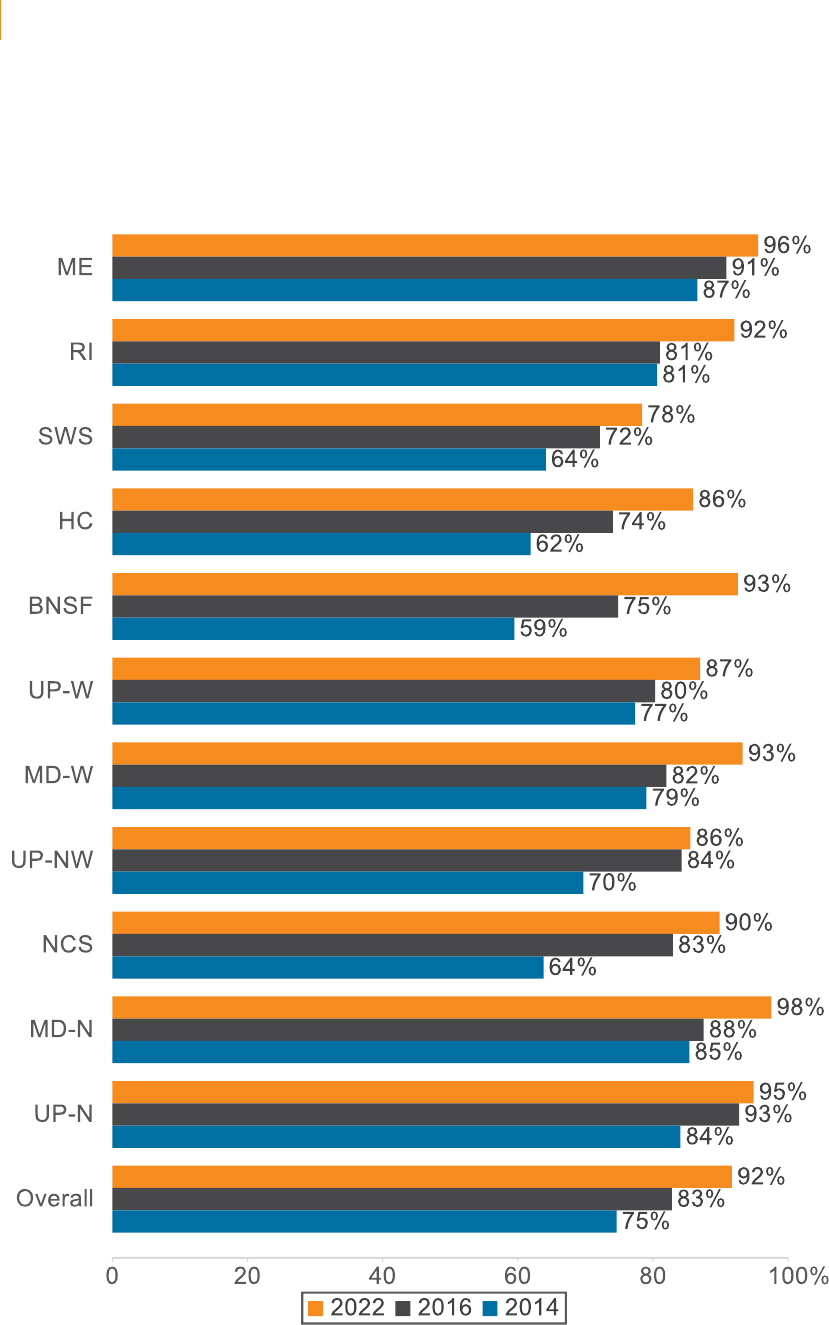
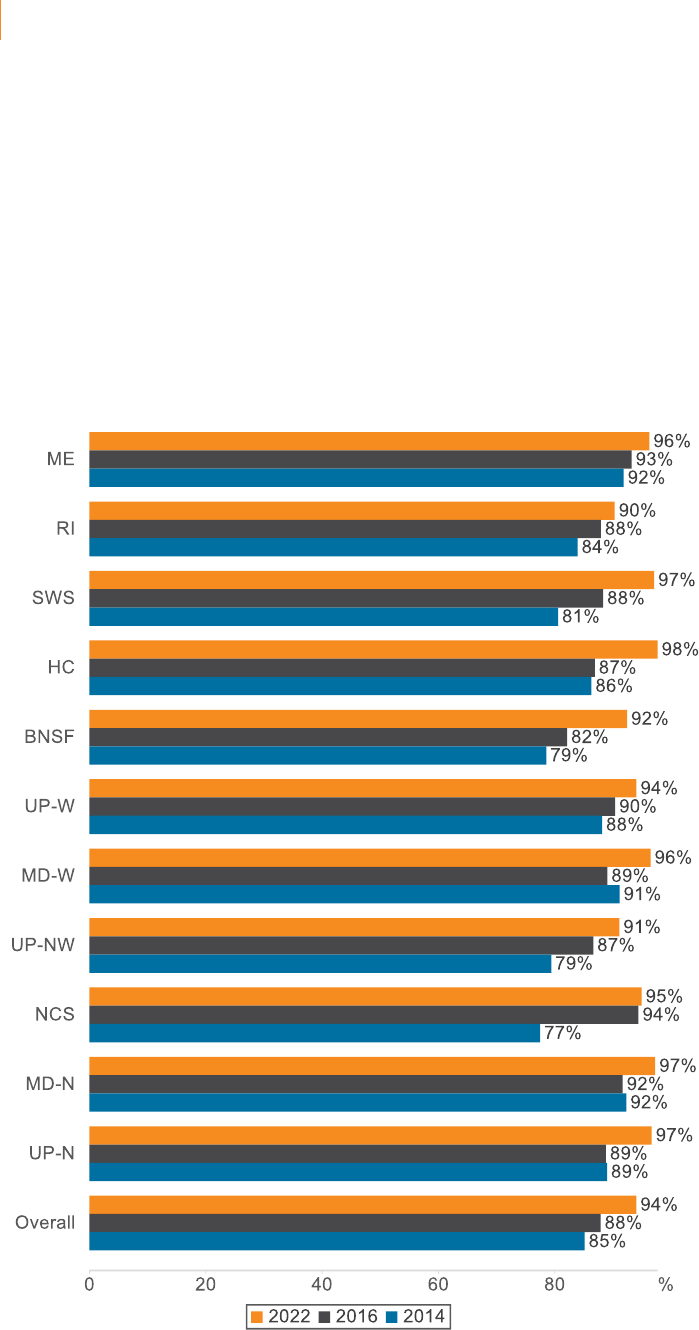
With an overall satisfaction score of 92%, Metra riders were more satisfied with the Service
Board’s performance than in 2016 (83%). Seven of the eleven lines Metra operates reported
satisfaction scores over 90%: ME at 96%, RI at 92%, BNSF at 93%, MD-W at 93%, NCS at
90%, MD-N at 98%, and UP-N at 95%. Three more Metra lines reported satisfaction over 80%:
86% of riders were satisfied with HC, 87% with UP-W, and 86% with UP-NW. Only one Metra
line reported satisfaction under 80%, SWS at 78% satisfied. It should be noted that Metra has
continued to add back service throughout 2022, including after this survey closed, that could
impact these results if these questions were asked today.
Metra 2022 Customer Satisfaction Survey
26
FIGURE 18: OVERALL SATISFACTION BY METRA LINE
Metra 2022 Customer Satisfaction Survey
27
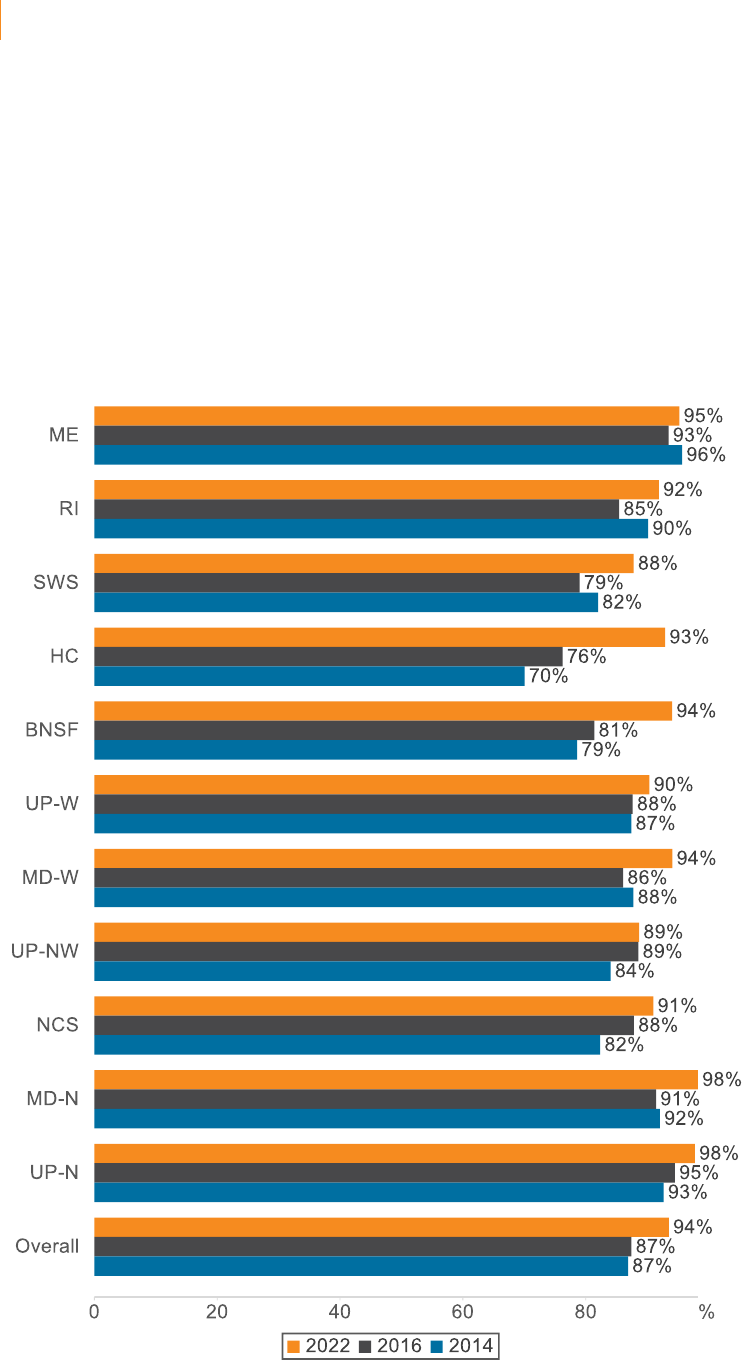
Except for UP-NW and SWS (at 89% and 88%, respectively), every line surpassed a 90%
likelihood to recommend Metra to others. MD-N and UP-N were the most likely to recommend
Metra at 98%, and the overall likelihood to recommend Metra’s service was 94%. Additionally,
every line was either equally or more likely to recommend Metra in 2022 than in 2016 (Figure
19).
FIGURE 19: LIKELIHOOD TO RECOMMEND BY METRA LINE
Metra 2022 Customer Satisfaction Survey
28
As seen in Figure 20, riders were highly satisfied with employee courtesy, with every line
scoring above 90% in satisfaction (overall satisfaction score of 94%). Satisfaction scores for this
item ranged from 90% (RI) to 98% (HC). All Metra lines increased in satisfaction with onboard
personnel courtesy between the 2016 and 2022 surveys.
FIGURE 20. SATISFACTION WITH ONBOARD PERSONNEL COURTESY BY METRA LINE
Metra 2022 Customer Satisfaction Survey
29
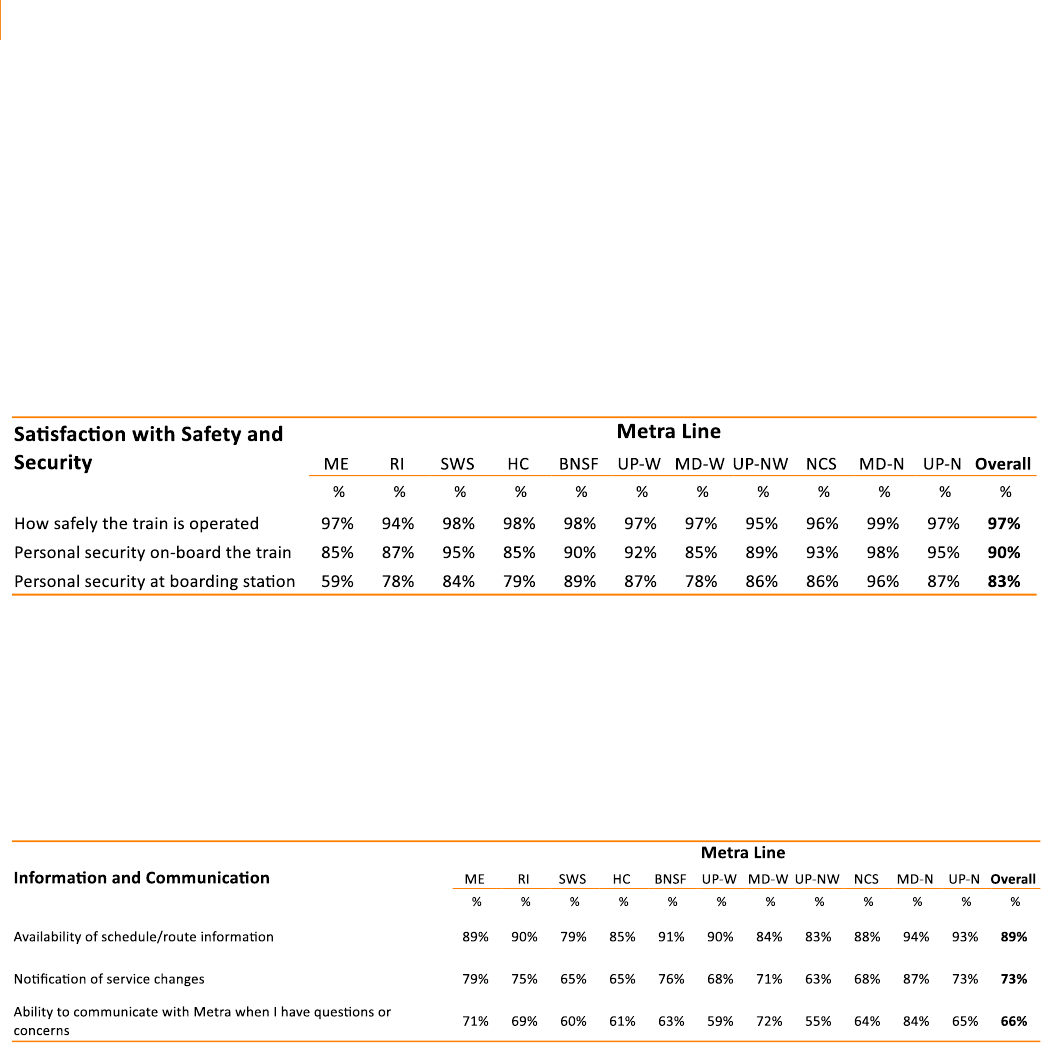
As with overall satisfaction, all lines scored at a high and consistent level with regards to safety
and security. However, personal security concerns at certain stations should be noted. Despite
an overall satisfaction score of 83%, ME riders reported 59% satisfaction with their boarding
stations’ security. On the other hand, 96% of MD-N riders felt secure at their boarding stations
and were 99% satisfied with how safely the MD-N trains were operated (Table 3).
TABLE 3: SATISFACTION WITH SAFETY BY METRA LINE
Note: Boarding stations are defined as the station at which the respondent boarded the train.
Overall satisfaction with the availability of schedules and route information is 89%. However,
73% of riders were satisfied with service change notifications and a lower 73% felt they could
adequately communicate their questions and concerns to Metra. Lowest among the lines, 55%
of UP-NW riders were satisfied with their communication abilities (Table 4).
TABLE 4: SATISFACTION WITH INFORMATION AND COMMUNICATION BY METRA LINE
Metra 2022 Customer Satisfaction Survey
30
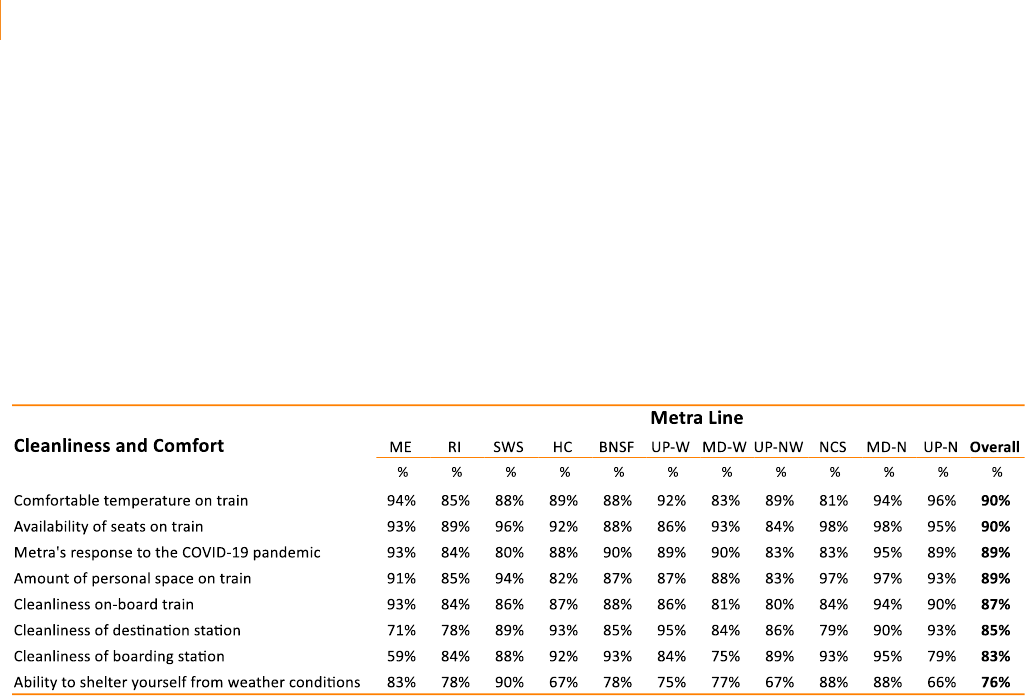
Satisfaction scores for train car and station cleanliness and comfort while aboard Metra trains
were generally high across all lines. However, the ability to shelter from weather conditions at
boarding stations was less satisfactory, at 76% overall. Despite the unprecedented challenges
associated with the COVID-19 pandemic, riders overall – at 89% – felt that Metra responded
well and adjusted its service appropriately (Table 5).
TABLE 5: SATISFACTION WITH CLEANLINESS AND COMFORT BY METRA LINE
Note: Boarding stations are defined as the station at which the respondent boarded the train.
Destination stations are defined as the station at which the respondent alighted the train.
Metra 2022 Customer Satisfaction Survey
31
4.4 DRIVERS OF SATISFACTION
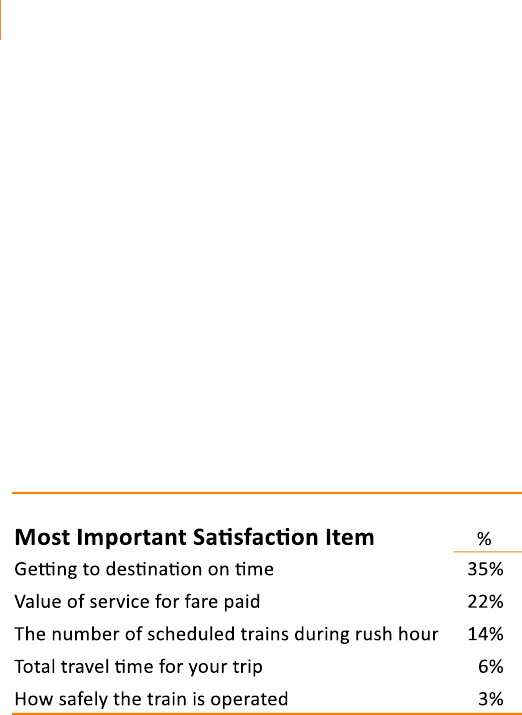
While satisfaction scores for different attributes of Metra service may vary widely, some
attributes matter more to riders than others. When explicitly asked about which aspect of
Metra’s service is most important, getting to one’s destination on time is by far the most
commonly named, with 35% of respondents selecting it as their most important attribute.
Service value for fare paid is also important to riders, as well as the number of rush-hour trains,
total travel time, and safe train operation, all of which make up the rest of the top five most
important Metra attributes (Table 6).
TABLE 6: TOP FIVE MOST IMPORTANT ATTRIBUTES

Metra 2022 Customer Satisfaction Survey
32
Derived Importance
Rather than relying solely on stated importance measures from respondents, additional
coefficient calculations were computed to determine the derived importance each measured
attribute had on influencing overall satisfaction. This allowed for greater insight into the
underlying factors driving overall customer satisfaction that a respondent may not explicitly
state.
For this analysis, 29 individual and regional service attributes were modeled as predictors that
influence overall satisfaction with Metra. Absent among these were questions that asked
outright about overall satisfaction (e.g., “Overall satisfaction with public transportation in region
in the six-county Chicago region”). A multiple regression model was developed using a
backward selection process. In backward regression, the variable selection starts with the full
list of explanatory variables, i.e., the 29 service attributes and five regional attributes. Variables
that have no significant contribution explaining the dependent variable, overall satisfaction, are
removed and the model is re-estimated at each step.
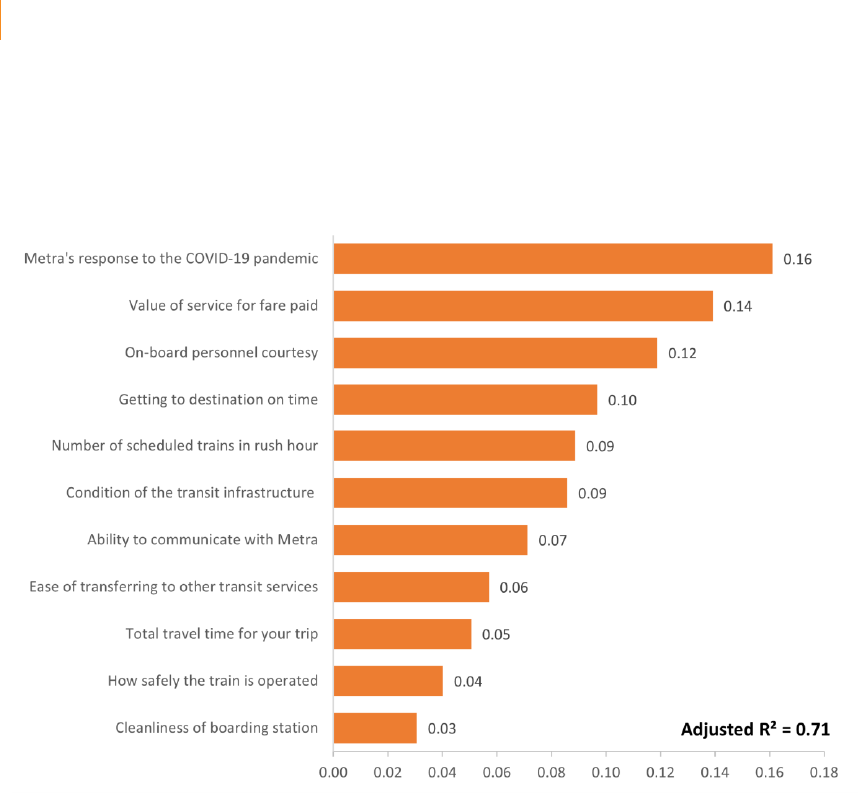
With an adjusted R
2
of 0.71, the final regression yielded 11 of the initial 29 service and regional
attributes which significantly influence respondents’ overall satisfaction with Metra (Figure 21).
The magnitude of each derived importance coefficient is a measure of the importance of the
service attribute in determining respondents’ overall satisfaction with Metra.
Metra 2022 Customer Satisfaction Survey
33
FIGURE 21: 2022 DERIVED IMPORTANCE COEFFICIENTS
Interestingly, while Metra's response to COVID did not show up in the explicit ranking (see
Table 6), it is the highest-ranked derived importance variable. This suggests that respondents
did not consider this attribute as relatively important when explicitly asked; more subtle
measures of importance revealed it to be the highest determining factor of overall satisfaction.
In the 2016 survey, value of service for fare paid was not considered to be an important attribute
(in 2022 it is the second-most important). Onboard personnel courtesy was the second-highest
ranked derived importance variable in 2022 compared to being the third-highest ranked derived
importance variable in the 2022 survey.
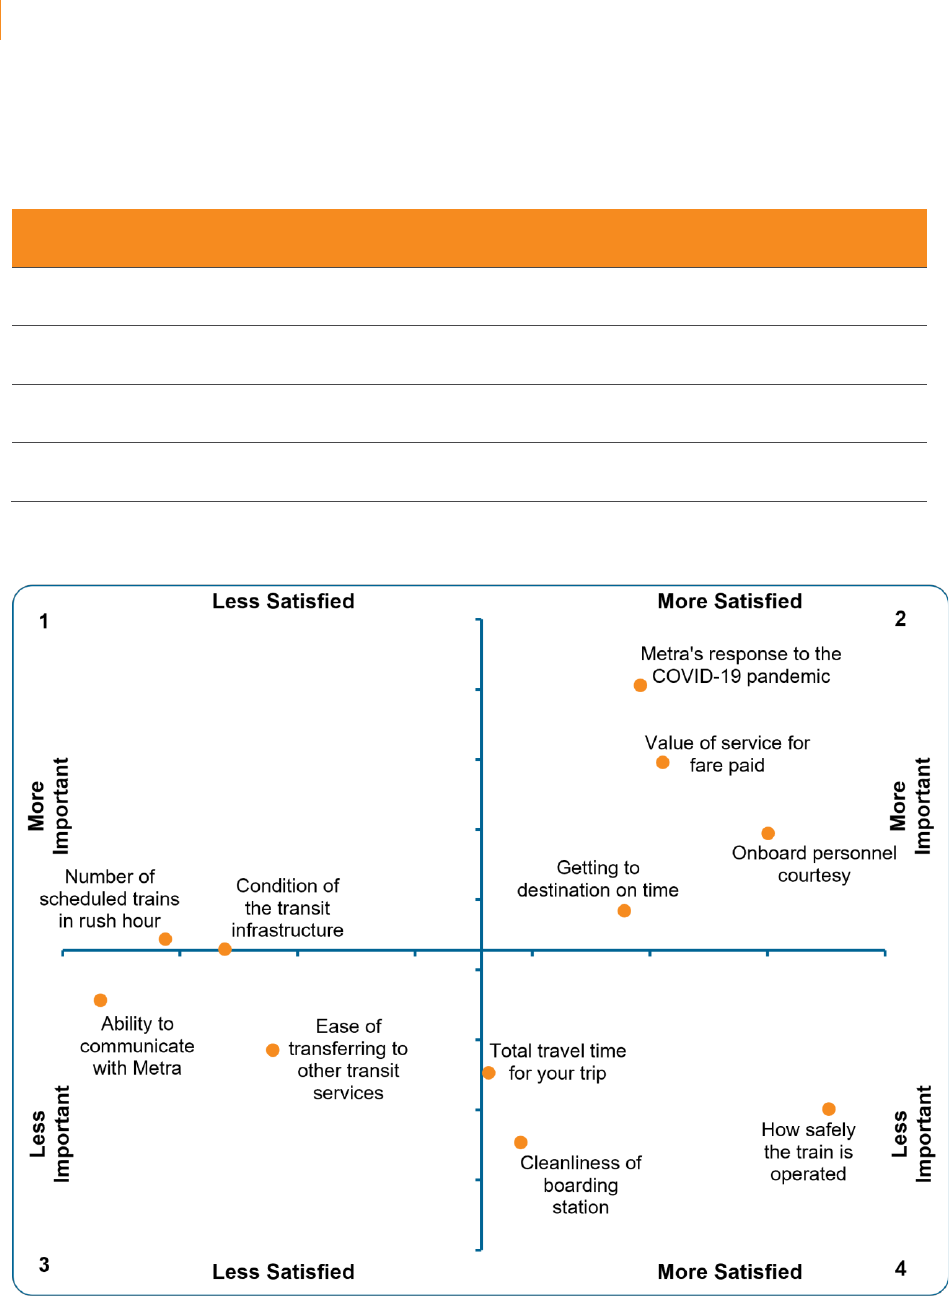
Quadrant Charts
A quadrant chart visually depicts service attributes’ derived importance against satisfaction.
Figure 22 shows the derived importance and satisfaction of the 16 service and regional
attributes identified above. These mapped points will provide insight as to where Metra should
focus efforts to maximize customer satisfaction. The Y-axis (vertical) measures importance and
the X-axis (horizontal) measures attribute satisfaction. Both axes are split at their means, thus
creating the four quadrants. Table 7 outlines what each of the four quadrants represent and the
appropriate action required by Metra to maximize customer satisfaction.
Metra 2022 Customer Satisfaction Survey
34
TABLE 7: QUADRANT CHARTS EXPLANATION
Quadrant
Location
Satisfaction Level
Importance
Action
1
Top left
Relatively low
Relatively high
Attributes for improvement
2
Top right
Relatively high
Relatively high
Attributes to maintain
3
Bottom left
Relatively low
Relatively low
Attributes to monitor
4
Bottom right
Relatively high
Relatively low
Attributes with no immediate action
FIGURE 22: KEY DRIVERS OF OVERALL SATISFACTION CHART

Metra 2022 Customer Satisfaction Survey
35
The top-right quadrant contains attributes that are both important and performing better than
mean satisfaction. Metra is currently meeting respondents’ expectations with Metra’s response
to the COVID-19 pandemic, value of service for fare paid, getting to destination on time, and
onboard personal courtesy. Metra should work to maintain the level of performance of these
attributes.
The top-left quadrant contains attributes that are also important but have satisfaction scores
below the mean. Improvements in the number of trains in rush hour and the condition of transit
infrastructure should be prioritized. A more concerted effort to address these priorities will likely
improve customer satisfaction with Metra overall.
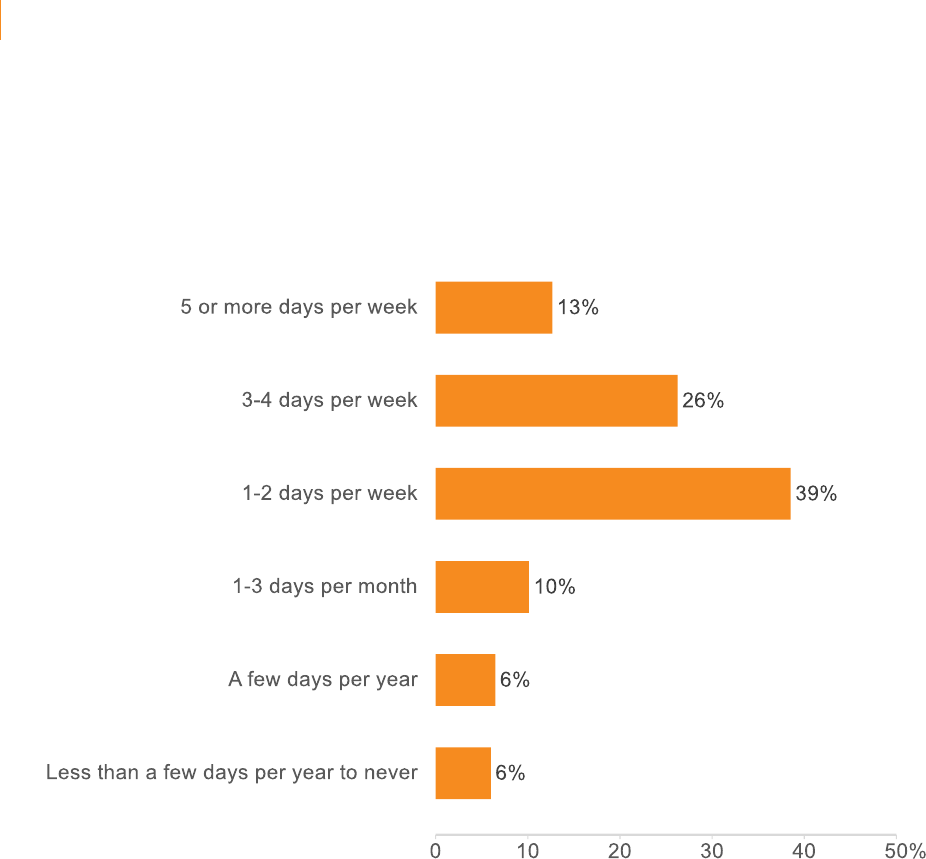
4.5 ADDITIONAL RESULTS
Among those riders who take Metra for commuting to work or for business related to work,
about 13% indicated that the employer does not allow telecommuting. However, among the
remaining 87%, the frequency with which they telecommute is indicated in Figure 23. Reflecting
a rise in the number of workers who telecommute or work from home as a result of the COVID-
19 pandemic, 78% of riders whose trips are work-related report telecommuting at least once a
week (39% telecommute 1-2 days per week, 26% telecommute 3-4 days per week, and 13%
telecommute 5 or more days per week)
While the 2016 survey asked about telecommuting, comparisons to 2016 should be made with
caution due to differences in the phrasing of the question and the answer options. Of
respondents that used Metra to make work-related trips in the 2016 survey, 63% reported that
they telecommute compared to 87% in 2022. The median number of days per month that these
respondents telecommuted was 5 days, which is approximately equal to 1-2 days per week. In
the 2022 survey, the median number of days that respondents use Metra for work-related
purposes was also 1-2 days per week.
Metra 2022 Customer Satisfaction Survey
36
FIGURE 23. TELECOMMUTE FREQUENCY WORK-RELATED RIDERS (AMONG THOSE WHOSE
EMPLOYER ALLOWS TELECOMMUTING)
Note: “Work-related” trips are defined as respondents who reported the purpose of their most
recent trip as “commute to/from work” or “business related to work.”
Metra 2022 Customer Satisfaction Survey
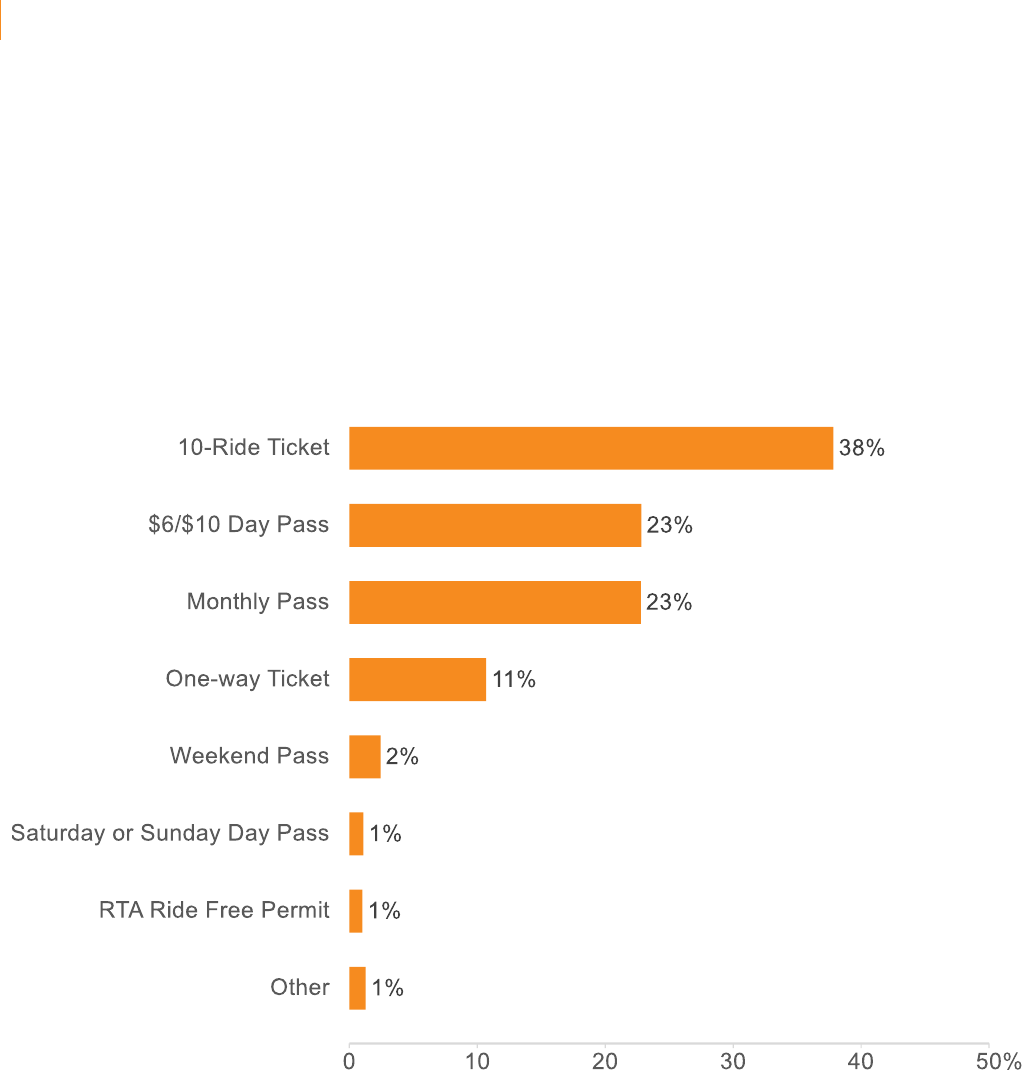
37
While Monthly Passes used to be the most popular ticket option, they have been surpassed in
popularity by the 10-Ride Ticket, which accounts for 38% of all respondent ticket purchases
(Figure 24). It should be noted that Metra’s $100 “Super Saver” Monthly Pass pilot program
began in July 2022, after this survey closed, which could have an impact on these results if
redone today.
FIGURE 24: METRA TICKET TYPE

Metra 2022 Customer Satisfaction Survey
40
5.0 CONCLUSION
Metra has proven its ability to overcome challenges and adjust according to customer needs,
and satisfaction with Metra has not only remained high, but positive attitudes towards many of
Metra’s service attributes continue to surpass prior years. Specifically, with an overall
satisfaction score of 92%, Metra is making a good impression on its riders, and a likelihood to
recommend score of 94% demonstrates rider loyalty to the Service Board. Even as conditions
change and customer needs evolve, Metra continues to deliver a service that its riders are
highly satisfied with. For instance, in the face of the COVID-19 pandemic, 89% of riders report
satisfaction with Metra’s response, and newer initiatives like the Ventra app and bicycle
allowance on trains yielded high satisfaction scores as well. Two intercept recruitment methods
were added in 2022, namely station-based postcard handouts and postcard seat drop. The
station-based postcard handouts occurred system-wide in that postcards were distributed at all
5 downtown Metra stations which are served by all of Metra’s 11 lines, and the postcard seat
drop occurred on each line proportional to ridership by line. This allowed Metra riders who are
not on the email list or on social media to participate, increasing the representativeness of the
obtained sample at a reasonable cost. Given that results for the 2022 Metra Customer
Satisfaction Survey were obtained after an unparalleled decrease in ridership that occurred
during COVID, repeated assessment of customer needs and satisfaction become crucial as
Metra rebuilds its ridership.

Metra 2022 Customer Satisfaction Survey
A-1
APPENDIX A. 2022 QUESTIONNAIRE
METRA CS SURVEY 2022
[surveylang]
I would like to take this survey in English
Me gustaría tomar la encuesta en español
This survey is conducted by Resource Systems Group, Inc. (RSG). RSG's privacy policy can be
found here.
We are committed to protecting the confidentiality, integrity, and security of your
personal information. We take this responsibility seriously. Our privacy documentation is
intended to help you understand how we collect, share, and safeguard your information.
Information about privacy for this survey can be found here.
Dear Customer:
Metra appreciates and values your opinions; therefore, we would like you to complete this
detailed customer satisfaction survey. This survey will take about 10 minutes, and at the end
you will have an opportunity to provide any additional comments that you have on Metra
service. Your feedback will help Metra evaluate our performance and will assist us in identifying
specific areas where our service is in need of improvement. Thank you for your input, and for
riding Metra!
Please click “Next” to begin.
By clicking “Next”, I consent to participate in this survey.
[intro]
RAIL LINE, STATION AND TICKET USAGE
For the next few questions, we would like you to concentrate on your typical Metra trip,
that is, the trip you make most often, a portion of which includes Metra.:
1. Please respond based on your most typical trip. If your typical Metra usage is from
home-work then work-home, answer the following questions for your home-work trip.
Which Metra train line do you ride?
[line] [programmer: pull down menu]
ME Metra Electric Line (University Park/South Chicago, 93
rd
St./Blue Island)
RI Rock Island Line (Joliet)
SWS SouthWest Service Line (Manhattan)
HC Heritage Corridor Line (Joliet)
BNSF BNSF Line (Aurora)
UP-W Union Pacific West Line (Elburn)
MD-W Milwaukee District West Line (Elgin)
UP-NW Union Pacific Northwest Line (Harvard/McHenry)

Metra 2022 Customer Satisfaction Survey
A-2
NCS North Central Service Line (Antioch)
MD-N Milwaukee District North Line (Fox Lake)
UP-N Union Pacific North Line (Kenosha)
2. At which station do you get on the train? [boardsta]
Note: If your typical Metra usage is from home-work then work-home, answer the following
questions for your home-work trip.
[programmer: drop down menu line specific, enforce that [boardsta] and [deststa] have different
answers]
3. How do you get to the <boardsta> Metra station where you get on the train? [access]
[programmer: allow one answer only]
o Walk the entire way
o Drive alone and park
o Get dropped off
o Carpool as the driver
o Carpool as a passenger
o Pace bus
o CTA bus
o CTA ’L’ train
o Transfer from another Metra train
o Taxi
o Lyft/Uber/Via or similar ride-hailing service
o Personal scooter
o Shared e-scooter (e.g., Lime, Bird, JUMP)
o Private shuttle bus/van
o Shared bike (Divvy)
o Personal bike
o Other, please specify: ___________
4. At which station do you get off the train?
Note: If your typical Metra usage is from home-work then work-home, answer the following
questions for your home-work trip.
[deststa] [programmer: drop down menu same as [boardsta], enforce that [boardsta] and
[deststa] have different answers]
5. How do you get to your final destination from the <deststa> Metra station where you get
off the train? [egress] [programmer: allow only one answer]
o Walk the entire way
o CTA ‘L’ train
o CTA bus
o Pace bus
o Private shuttle bus/van

Metra 2022 Customer Satisfaction Survey
A-3
o Taxi
o Lyft/Uber/Via or similar ride-hailing service
o Personal scooter
o Shared e-scooter (e.g., Lime, Bird, JUMP)
o Shared bike (Divvy)
o Personal bike
o Get picked up
o Drive alone and park
o Carpool as the driver
o Carpool as a passenger
o Transfer to another Metra train
o Other, please specify: ___________
6. What is the purpose of your most typical trip? [purp]
o Commute to/from work
o Commute to/from school [programmer: only show if this option is selected in
[purpose]]
[school_specified]
o Elementary, middle, or high school
o College or university
o Vocational/trade or other school
o Business related to work
o Medical/dental appointment
o Personal business
o Shopping
o Entertainment, visiting, recreation
o Airport (as an air traveler)
o Other, please specify: ___________
7. What type of Metra ticket do you use for your most typical trip? [pass]
o Monthly Pass (full fare or reduced fare)
o 10-Ride Ticket (full fare or reduced fare)
o How many 10-Ride tickets do you typically use each month: [num10pass]
[programmer: only show if this option is selected in [pass]]
o Less than 1
o 1-2
o 3-4
o More than 4
o One-Way Ticket (full fare or reduced fare)
o Weekend Pass
o Saturday or Sunday Day Pass

Metra 2022 Customer Satisfaction Survey
A-4
o $10 Day Pass
o $6 Day Pass
o RTA Ride Free Permit [programmer: skip to Q 12 ]
o Other, please specify: ___________
8. Do you qualify for reduced fares through any of Metra’s reduced fare programs? (Senior,
disabled, U.S. Military, elementary, middle, or high school student)? [fullfare]
[programmer: only show this question if NOT “ME” or “RI” selected in [line]]
o Yes [programmer: only show submenu if this option is selected in [fullfare]]
o Which reduced fare do you qualify for? [fullfare_specified]
o Senior
o Disabled
o U.S. Military
o Elementary, middle, or high school student
o No
o Don’t know
9. Currently, all ME and RI riders qualify for reduced fares under the temporary Fair Transit
South Cook Pilot. Would you qualify for reduced fares through any of Metra’s other
reduced fare programs? (Senior, disabled, U.S. Military, elementary, middle, or high
school student)? [fullfare_RIME] [programmer: only show this question if “ME” or
“RI” selected in [line]]
o Yes [programmer: only show submenu if this option is selected in [fullfare_RIME]]
o Which reduced fare do you qualify for? [fullfare_specified]
o Senior
o Disabled
o U.S. Military
o Elementary, middle, or high school student
o No
o Don’t know
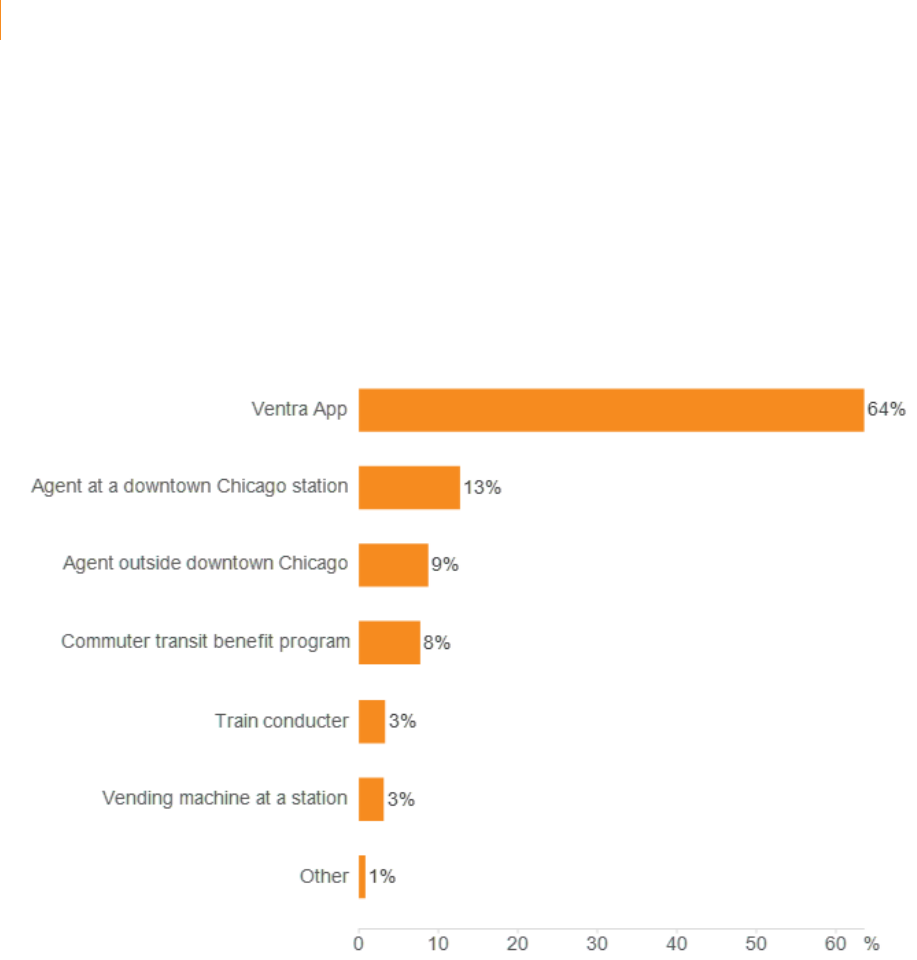
10. Where do you usually purchase your Metra ticket? [wherepass]
o Agent at a downtown Chicago station
o Agent at a station outside of downtown Chicago
o Vending machine at a station
o From a conductor on the train
o Ventra App
o Directly through a commuter transit benefit program (WageWorks, Wired Commute,
ADP etc.)
o Other, please specify: ___________
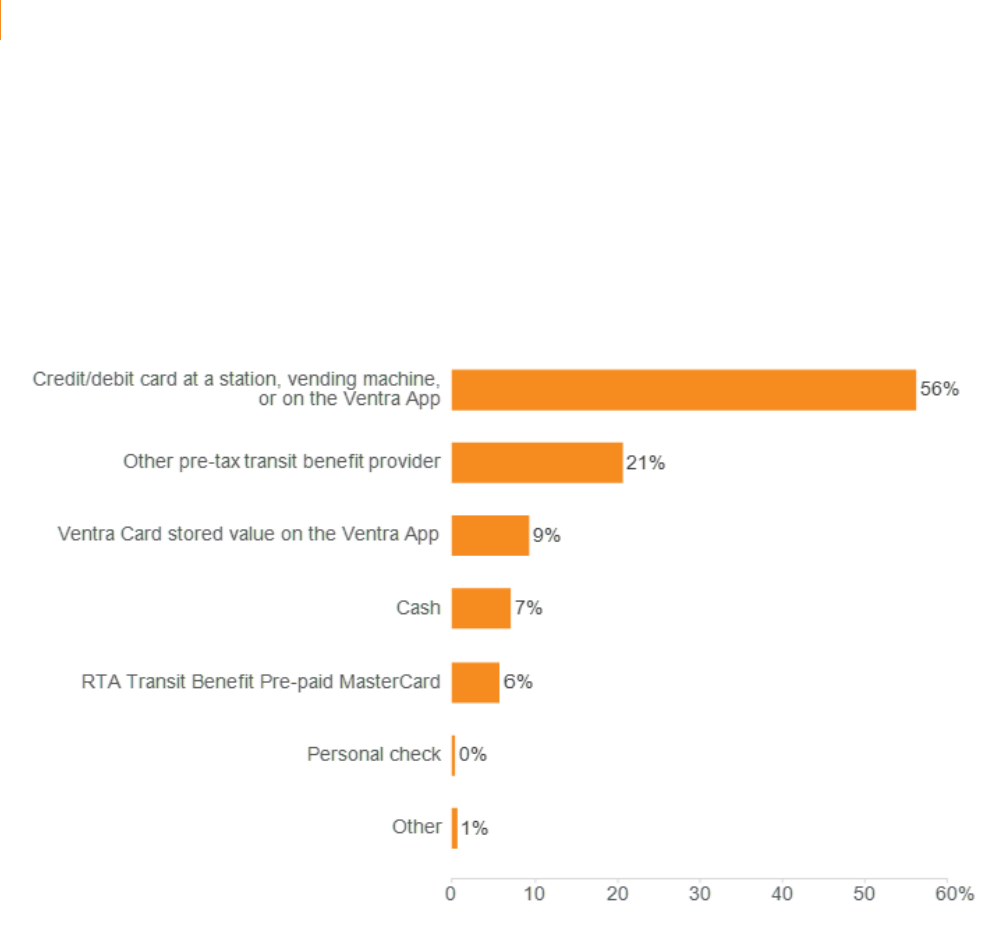
11. How do you typically pay for your Metra ticket? [payticket]
o Credit/debit card at a station, vending machine, or on the Ventra App

Metra 2022 Customer Satisfaction Survey
A-5
o Cash
o Personal check
o RTA Transit Benefit Pre-paid MasterCard
o Other pre-tax transit benefit provider (WageWorks, Wired Commute, ADP, etc.)
o Ventra Card stored value on the Ventra App
o RTA Ride Free Permit
o Other, please specify: ___________
GENERAL METRA USAGE
PLEASE LET US KNOW ABOUT YOUR GENERAL METRA USAGE:
12. In a typical week, how many days do you ride Metra? [freq]
o 7 days per week
o 6 days per week
o 5 days per week
o 4 days per week
o 3 days per week
o 2 days per week
o 1 day per week
o Less than one day per week but more than one day per month
o One day per month or less
[programmer: only show [times] if respondent selects 2 or more days per week in [freq]]
13. Which times of day do you ride Metra (select all that apply) [times]
Weekday mornings between 6:00 and 9:00 a.m.
Weekdays between 9:00 a.m. and 3:00 p.m.
Weekday afternoons between 3:00 and 6:00 p.m.
Weekday evenings between 6:00 and 9:00 p.m.
Weekday evenings between 9:00 p.m. and 12:00 a.m.
Weekdays between 12:00 a.m. and 6:00 a.m.
Anytime on the weekends
14. Before the start of the pandemic (i.e., March 2020), were you a regular rider of Metra
(that is, riding at least once per month)? [beforepan]
o Yes
o No <skip to currentreg>
15. When did you become a regular rider of Metra (that is, riding at least once per month)?
[Dur]
<drop down with year from “2000 or earlier” to “2020”>
16. Are you currently a regular rider (that is, riding at least once per month)? [currentreg]
o Yes

Metra 2022 Customer Satisfaction Survey
A-6
o No
17. How frequently do you work frworkom home or telecommute? [telecommute_freq]
o Employer does not allow
o 5 or more days per week
o 3-4 days per week
o 1-2 days per week
o 1-3 days per month
o A few days per year
o Less than a few days per year/never
o Not Applicable (e.g., I don’t work)
18. Please indicate whether you agree or disagree with the following statements. If the
question does not apply to you, select “N/A” (not applicable) [rideragree]
Yes
No
N/A
A. I regularly bring a bicycle on-board the train
○
○
○
B. I travel with a smartphone with reliable internet
service
○
○
○
SATISFACTION WITH METRA SERVICE
PLEASE RATE YOUR SATISFACTION WITH METRA SERVICE:
19. Think about trips you’ve recently taken on Metra and please indicate your satisfaction
with the following features using a scale of 1-10. If the question does not apply to you,
select “N/A” (not applicable) DELIVERY [service]
How satisfied are
you with…
Very
dissatisfied
Dissatisfied
Satisfied
Very
satisfied
N/A
A. Value of
service for fare
paid
1
2
3
4
5
6
7
8
9
10
n/a
B. Getting to
destination on
time
1
2
3
4
5
6
7
8
9
10
n/a
C. The number of
scheduled
trains in rush
hour
1
2
3
4
5
6
7
8
9
10
n/a
D. The number of
scheduled
1
2
3
4
5
6
7
8
9
10
n/a

Metra 2022 Customer Satisfaction Survey
A-7
trains in non-
rush hour
E. The number of
scheduled
Saturday trains
1
2
3
4
5
6
7
8
9
10
n/a
F. The number of
scheduled
Sunday trains
1
2
3
4
5
6
7
8
9
10
n/a
G. Total travel
time for your
trip
1
2
3
4
5
6
7
8
9
10
n/a
H. Wait time
before
boarding the
train
1
2
3
4
5
6
7
8
9
10
n/a
I. Ability to stow
bicycle on
trains
1
2
3
4
5
6
7
8
9
10
n/a
SECURITY [psafe]
How satisfied are you
with…
Very
dissatisfied
Dissatisfied
Satisfied
Very
satisfied
N/A
J. How safely the
train is operated
1
2
3
4
5
6
7
8
9
10
n/a
K. Personal security
onboard the train
1
2
3
4
5
6
7
8
9
10
n/a
L. Personal security
at <boardsta>
1
2
3
4
5
6
7
8
9
10
n/a
MUNICATION [inf]
How satisfied are you
with…
Very
dissatisfied
Dissatisfied
Satisfied
Very
satisfied
N/A
M. Availability of
schedule/route
information
1
2
3
4
5
6
7
8
9
10
n/a
N. Notification of
service changes
1
2
3
4
5
6
7
8
9
10
n/a
O. Ability to
communicate
with Metra when I
have questions or
concerns
1
2
3
4
5
6
7
8
9
10
n/a

Metra 2022 Customer Satisfaction Survey
A-8
How satisfied are
you with…
Very
dissatisfied
Dissatisfied
Satisfied
Very
satisfied
N/A
P. Cleanliness of
<boardsta>
1
2
3
4
5
6
7
8
9
10
n/a
Q. Cleanliness of
<deststa>
1
2
3
4
5
6
7
8
9
10
n/a
R. Cleanliness on
train
1
2
3
4
5
6
7
8
9
10
n/a
S. Comfortable
temperature on
train
1
2
3
4
5
6
7
8
9
10
n/a
T. Availability of
seats on train
1
2
3
4
5
6
7
8
9
10
n/a
U. Amount of
personal space
on train
1
2
3
4
5
6
7
8
9
10
n/a
V. Ability to
shelter yourself
from weather
conditions
while waiting
for train
1
2
3
4
5
6
7
8
9
10
n/a
W. Metra’s
response to
the COVID-19
pandemic
1
2
3
4
5
6
7
8
9
10
n/a
YEE PERFORMANCE [emp]
How satisfied are you
with…
Very
dissatisfied
Dissatisfied
Satisfied
Very
satisfied
n/a
X. Staff courtesy on
train
1
2
3
4
5
6
7
8
9
10
n/a
[programmer: show all customer satisfaction statements from 0and allow respondents to
rank-order their top 3]
20. Please select and rank the three items that are most important to you. After you make a
selection, it will disappear from the list. Start with the item that is MOST important to you.
Please continue ranking the items until you have selected your top three. [satisrank]
Please confirm your top three by clicking "Next" to continue. If you need to change your
selection, click the “<<Previous” button
21. Overall Value [overall]

Metra 2022 Customer Satisfaction Survey
A-9
Very
dissatisfied
Dissatisfied
Satisfied
Very
satisfied
N/A
How satisfied are you
with Metra overall
1
2
3
4
5
6
7
8
9
10
n/a
22. Likelihood to Recommend [loyal]
Very
unlikely
Unlikely
Likely
Very
likely
N/A
How likely are you to recommend
Metra to others
1
2
3
4
5
6
7
8
9
10
n/a
23. Regional Satisfaction [reg]
Please consider your ability to move throughout the Chicago region, using any and all of the
available public transportation options (CTA, Pace, Metra) and indicate your overall
regional satisfaction using the 1 to 10 scale. If the question does not apply to you, please
select “N/A” (not applicable).
How satisfied are you
with…
Very
dissatisfied
Dissatisfied
Satisfied
Very
satisfied
n/a
Y. Availability of
public
transportation
throughout the six-
county Chicago
region when and
where you need to
travel
1
2
3
4
5
6
7
8
9
10
n/a
Z. Ease of
transferring to
other transit
services (such as
coordination of
scheduling,
payment, signage,
walking paths,
etc.)
1
2
3
4
5
6
7
8
9
10
n/a
AA. The availability of
connecting
services near
transit such as
bike share, ride-
hail etc.
1
2
3
4
5
6
7
8
9
10
n/a

Metra 2022 Customer Satisfaction Survey
A-10
BB. The condition of
the transit
infrastructure
(such as buses,
trains, stations,
bridges, signage,
etc.)
1
2
3
4
5
6
7
8
9
10
n/a
CC. Information and
service received
from the regional
RTA Travel
Information Center
1
2
3
4
5
6
7
8
9
10
n/a
DD. Overall satisfaction
with public
transportation in
the SIX-COUNTY
CHICAGO
REGION
1
2
3
4
5
6
7
8
9
10
n/a
DEMOGRAPHICS
PLEASE TELL US ABOUT YOURSELF:
33. Home ZIP Code (5 digits) [zip]
__ __ __ __ __
34. Are you? [gender]
o Male
o Female
o Prefer to self-describe _______________
35. What is your age ? [age]
o Under 18
o 18-24
o 25-29
o 30-34
o 35-39
o 40-44
o 45-49
o 50-54
o 55-59
o 60-64
o 65 or over
36. What is the highest level of education you have completed? [educ]

Metra 2022 Customer Satisfaction Survey
A-11
o Some high school or less
o High school graduate
o Some college or technical school
o College graduate
o Post graduate degree
37. What is your current employment status? [employ]
o Employed full-time
o Employed part-time
o Homemaker
o Retired
o Student
o Not employed
o Other, please specify: ___________
[programmer: only show if Student in [employ]] [studenttype]]
38. Which type of school do you currently attend? [school]
o High school
o Technical college
o Community college
o Four-year college
o Graduate school
o Other, please specify: ________
39. Which of the following categories best describes your ethnic background (Please select all
that apply) [race] [programmer, allow multiple selections]
o White/Caucasian
o Asian/Pacific Islander
o Black/African-American
o Hispanic/Latino
o Other, please specify: ___________
40. What language do you most often speak at home? [lang]
o English
o Spanish
o Polish
o Chinese
o Korean
o Tagalog
o Russian
o Other, please specify: ___________

Metra 2022 Customer Satisfaction Survey
A-12
41. How well do you speak English? [ability]
o Very well
o Well
o Not well
o Not at all
42. How many people are in your household (including you)? [hhsize] [programmer: allow
only numbers]
43. Number of children under age 18 in household [kids] [programmer: allow only
numbers]
44. Number of cars in household [veh] [programmer: allow only numbers]
45. Number of employed people in household [hhemp] [programmer: allow only numbers]
46. Do you usually have a car available for the trip you typically make on Metra? [caravail]
o Yes
o No
47. Do you consider yourself to be a person with a disability? [disab]
o Yes
o No
48. What is your household’s approximate annual income? [hhinc] [programmer: do not
validate]
o Less than $15,000
o $15,000-$19,999
o $20,000 - $24,999
o $25,000 - $29,999
o $30,000 - $34,999
o $35,000 - $39,999
o $40,000-$59,999
o $60,000-$74,999
o $75,000-$99,999
o $100,000-$124,999
o $125,000-$149,999
o $150,000-$199,999
o $200,000 and above
Thank you for your assistance in this important research project.

Metra 2022 Customer Satisfaction Survey
A-13
49. Metra continues to seek input about our service. If you would like to participate in
research for Metra or RTA, please provide your email: __________________
[programmer: validate that it’s an email address]
50. Please share any final comments you have about your experiences with Metra.
Thank you for participating!
Metra 2022 Customer Satisfaction Survey
B-1
APPENDIX B. SEAT DROP POSTCARD
ALLOCATION
FIGURE 27: SEAT DROP POSTCARDS DISTRIBUTED BY LINE
Line
Number of
Postcards
Distributed
SWS
500
HC
150
BNSF
4,350
MD-N
1,500
MD-W
1,300
NCS
300
UP-N
2,900
UP-NW
2,400
UP-W
2,000
RI
2,200
ME
2,400
Total
20,000

Metra 2022 Customer Satisfaction Survey
C-1
APPENDIX C. CROSSTABS
Crosstabs are provided under separate cover.
