
January 2024
St. Louis Lambert International Airport
Economic Impact Study
Prepared for
Greater St. Louis, Inc.
Final Report
January 2024
Prepared by
Kimley-Horn and Associates
1001 W. Southern Avenue
Suite 131
Mesa, AZ 85210

1 | Page
November 2023
Table of Contents
1. Study Introduction ............................................................................................................... 6
2. Regional Overview ............................................................................................................... 8
2.1. Metropolitan Area Population ......................................................................................... 8
2.2. Metropolitan Area Economy ......................................................................................... 10
3. Airport Setting .................................................................................................................... 15
3.1. Historic Activity ............................................................................................................. 15
3.2. Master Plan Forecast Activity Summary ....................................................................... 20
3.3. Similar Airport Comparison ........................................................................................... 22
3.3.1. St. Louis Lambert International Airport Overview .................................................. 23
3.3.2. Pittsburgh International Airport .............................................................................. 25
3.3.3. Nashville International Airport ............................................................................... 28
3.3.4. Cincinnati/Northern Kentucky International Airport ............................................... 31
3.3.5. Austin-Bergstrom International Airport .................................................................. 34
3.3.6. Summary ............................................................................................................... 38
4. Economic Methodology and Modeling ............................................................................ 43
4.1. Key Terms .................................................................................................................... 43
4.1.1. Economic Impact Categories ................................................................................ 43
4.1.2. Economic Impact Measures .................................................................................. 44
4.2. Data Collection ............................................................................................................. 46
4.2.1. On-Airport Activity ................................................................................................. 46
4.2.2. Off-Airport Activity ................................................................................................. 48
4.2.3. Tax Impacts ........................................................................................................... 51
4.2.4. Supplier Diversity Program .................................................................................... 51
4.3. Economic Modeling Process ........................................................................................ 51
4.3.1. Use of IMPLAN Model ........................................................................................... 52
5. 2019 Airport Economic Contributions and Community Benefits .................................. 54
5.1. 2019 On-Airport Impacts .............................................................................................. 54
5.1.1. 2019 On-Airport Direct Impacts ............................................................................. 54
5.1.2. 2019 On-Airport Multiplier Impacts ........................................................................ 55
5.1.3. 2019 Total On-Airport Activity Impacts .................................................................. 56
5.2. 2019 Off-Airport Impacts .............................................................................................. 57

2 | Page
November 2023
5.2.1. 2019 Off-Airport Direct Impacts ............................................................................. 57
5.2.2. 2019 Off-Airport Multiplier Impacts ........................................................................ 58
5.2.3. 2019 Total Off-Airport Impacts .............................................................................. 59
5.3. 2019 Total Airport Impacts ........................................................................................... 60
5.4. Supplier Diversity Program Impacts ............................................................................. 62
5.5. 2019 Tax Impacts ......................................................................................................... 64
5.6. Community Benefits ..................................................................................................... 66
5.6.1. Bayer ..................................................................................................................... 66
5.6.2. Boeing ................................................................................................................... 67
5.6.3. Bunge .................................................................................................................... 68
6. 2032 Projected Future Economic Contributions ............................................................ 71
6.1. 2032 On-Airport Impacts .............................................................................................. 71
6.1.1. 2032 On-Airport Direct Impacts ............................................................................. 72
6.1.2. 2032 On-Airport Multiplier Impacts ........................................................................ 73
6.1.3. 2032 Total On-Airport Activity Impacts .................................................................. 74
6.2. 2032 Off-Airport Impacts .............................................................................................. 75
6.2.1. 2032 Off-Airport Direct Impacts ............................................................................. 77
6.2.2. 2032 Off-Airport Multiplier Impacts ........................................................................ 78
6.2.3. 2032 Total Off-Airport Multiplier Impacts ............................................................... 79
6.2.4. Impacts of Future International Air Service ........................................................... 80
6.3. 2032 Total Airport Impacts ........................................................................................... 82
6.4. 2032 Tax Impacts ......................................................................................................... 84
7. Conclusion ......................................................................................................................... 86

3 | Page
November 2023
Table of Tables
2. Regional Overview ............................................................................................................... 8
Table 2-1. Multi-billion-dollar Firms Located in St. Louis MSA ................................................ 12
3. Airport Setting .................................................................................................................... 15
Table 3-1. Forecast GA Operations at St. Louis Lambert International Airport, FY Basis ....... 22
Table 3-2. Comparative Summary between St. Louis Lambert International Airport and Other
Case Example Airports ............................................................................................................ 23
Table 3-3. St. Louis Metropolitan Region Overview ................................................................ 24
Table 3-4. St. Louis Lambert International Airport Airport Activity Overview ........................... 25
Table 3-5. Pittsburgh Metropolitan Region Overview .............................................................. 25
Table 3-6. PIT Activity Overview ............................................................................................. 26
Table 3-7. Nashville Metropolitan Region Overview ............................................................... 29
Table 3-8. BNA Airport Activity Overview ................................................................................ 30
Table 3-9. Cincinnati Metropolitan Region Overview .............................................................. 32
Table 3-10. CVG Airport Activity Overview ............................................................................. 33
Table 3-11. Austin Metropolitan Region Overview .................................................................. 35
Table 3-12. AUS Airport Activity Overview .............................................................................. 36
Table 3-13. Airport Summary Comparison .............................................................................. 38
Table 3-14. Historic Comparison of Socioeconomic Across Case Study Airports ................... 39
4. Economic Methodology and Modeling ............................................................................ 43
Table 4-1. Defining Economic Impact Categories ................................................................... 43
Table 4-2. Defining Economic Impact Measures ..................................................................... 44
Table 4-3. NAICS Codes Used in Off-Airport Business Assessment ...................................... 48
5. 2019 Airport Economic Contributions and Community Benefits .................................. 54
Table 5-1. 2019 On-Airport Direct Impacts .............................................................................. 54
Table 5-2. 2019 On-Airport Multiplier Impacts ......................................................................... 56
Table 5-3. 2019 On-Airport Total Impacts ............................................................................... 57
Table 5-4. 2019 Off-Airport Aviation-Reliant Businesses Direct Impacts ................................ 58
Table 5-5. 2019 Off-Airport Visitor Spending Direct Impacts................................................... 58
Table 5-6. 2019 Off-Airport Aviation-Reliant Businesses Multiplier Impacts ........................... 59
Table 5-7. 2019 Off-Airport Visitor Spending Multiplier Impacts.............................................. 59
Table 5-8. 2019 Off-Airport Total Impacts ............................................................................... 60

4 | Page
November 2023
Table 5-9. 2019 St. Louis Lambert International Airport Total Airport Impacts ........................ 60
Table 5-10. 2019 St. Louis Lambert International Airport Total Impacts by Activty Type ........ 61
Table 5-11. 2019 Airport Contracted Services Impacts Attributable to the Airport’s Supplier
Diversity Program .................................................................................................................... 62
Table 5-12. 2019 Airport Capital Expenditure Impacts Attributable to the Airport’s Supplier
Diversity Program .................................................................................................................... 63
Table 5-13. 2019 Tax Revenues Generated from Direct On- and Off-Airport Activity ............. 65
Table 5-14. Tax Revenues Generated from Total On- and Off-Airport Activity ....................... 66
6. 2032 Projected Future Economic Contributions ............................................................ 71
Table 6-1. 2032 On-Airport Direct Impacts .............................................................................. 73
Table 6-2. 2032 On-Airport Multiplier Impacts ......................................................................... 74
Table 6-3. 2032 On-Airport Total Impacts ............................................................................... 75
Table 6-4. 2032 Off-Airport Aviation-Reliant Businesses Direct Impacts ................................ 77
Table 6-5. 2032 Off-Airport Visitor Spending Direct Impacts................................................... 78
Table 6-6. 2032 Off-Airport Aviation-Reliant Businesses Multiplier Impacts ........................... 78
Table 6-7. 2032 Off-Airport Visitor Spending Multiplier Impacts.............................................. 79
Table 6-8. 2032 Off-Airport Total Impacts ............................................................................... 80
Table 6-9. 2032 Total Impacts of Future International Air Service at St. Louis Lambert
International Airport ................................................................................................................. 81
Table 6-10. 2032 St. Louis Lambert International Airport Total Airport Impacts...................... 83
Table 6-11. 2032 St. Louis Lambert International Airport Total Impacts by Activty Type ........ 84
Table 6-12. 2032 Tax Revenues Generated from Direct On- and Off-Airport Activity ............. 85
Table 6-13. 2032 Tax Revenues Generated from Total On- and Off-Airport Activity .............. 85

5 | Page
November 2023
Table of Figures
2. Regional Overview ............................................................................................................... 8
Figure 2-1. Illinois and Missouri Counties within the St. Louis MSA.......................................... 8
Figure 2-2. St. Louis MSA Population Change (2000 – 2021) .................................................. 9
Figure 2-3. St. Louis MSA Population Projection (2022 – 2042) ............................................. 10
Figure 2-4. Employment Growth Rates by Industry (2000 – 2018) ......................................... 12
Figure 2-5. Growth in Real Gross Domestic Product (2001 – 2019) ....................................... 14
3. Airport Setting .................................................................................................................... 15
Figure 3-1. St. Louis Lambert International Airport Passenger Enplanements (2000 – 2021) 17
Figure 3-2. Historical Trends in Air Cargo Tonnage (Short Tons) 2004 – 2019 from the St.
Louis Lambert International Airport Master Plan ..................................................................... 18
Figure 3-3. Itinerant and Local General Aviation Operations (CY 1997 – 2019) from the St.
Louis Lambert International Airport Master Plan ..................................................................... 19
Figure 3-4. Forecast of the Airport’s Enplanements Under Three Scenarios from the St. Louis
Lambert International Airport Master Plan ............................................................................... 20
Figure 3-5. Air Cargo Forecast Tonnage by Scenario - All Carriers (FY 2018 – 2040) .......... 21
Figure 3-6. St. Louis Lambert International Airport Aerial ....................................................... 24
Figure 3-7. Pittsburgh International Airport Aerial ................................................................... 26
Figure 3-8. Nashville International Airport Aerial ..................................................................... 29
Figure 3-9. Cincinnati/Northern Kentucky International Airport Aerial ..................................... 32
Figure 3-10. Austin-Bergstrom International Airport Aerial ...................................................... 36
Figure 3-11. Summary of Historic Socioeconomic Trends Across Study Airports ................... 40
Figure 3-12. Historic Enplanements at Comparison Airports .................................................. 41
4. Economic Methodology and Modeling ............................................................................ 43
Figure 4-1. Relationship of Payroll, Value Added, and Business Revenues ........................... 45
Figure 4-2. St. Louis Lambert International Airport Economic Impact Calculation Process .... 46
5. 2019 Airport Economic Contributions and Community Benefits .................................. 54
Figure 5-1. 2019 MBE and WBE Contributions to Total Airport Contract Service Impacts ..... 63
Figure 5-2. 2019 MBE and DBE Contributions to Total Airport Capital Expenditure Impacts . 64
6. 2032 Projected Future Economic Contributions ............................................................ 71
Figure 6-1. Proposed Airport Development Plan ..................................................................... 72
Figure 6-2. Share of 2032 Total Visitor Spending Impacts by Type of Visitor ......................... 82

6 | Page
Section 1. Study Introduction // November 2023
1. Study Introduction
Many residents and businesses are likely familiar with their local commercial service airport as
they may depend on it to travel to destinations across the country, and even the world, for
business and/or leisure. They may also understand the airport provides a critical link in the
broader transportation network, facilitating air transportation for the movement of goods and
services, as well as people. However, what many in the public may not realize is that airports
are powerful engines that generate economic activity across several industries by supporting
jobs, generating revenues, providing payroll and employee compensation, and generating
taxes. This starts with direct staff employment but extends to the many businesses hosted at the
airport, on-site construction activity, and many other facets that contribute to local economic
conditions.
Greater St. Louis, Inc., a nonprofit organization formed to support economic development for the
St. Louis metropolitan area, partnered with the St. Louis Lambert International Airport ("the
Airport”) for the St. Louis Lambert International Airport Economic Impact Study. Through the
results of the AEIS, the economic and social value of the Airport is calculated and documented
for use by both groups in communicating with the broader community about the tremendous
contributions of the Airport to the region.
The AEIS utilizes data provided by the Airport and other sources to analyze the economic
impact during a specific time period. For purposes of this study, both a historical and future
analysis are included. The historical economic impact analysis is based on activity from 2019
while the future economic impact analysis uses 2032 as the base year. 2019 was selected as
the historical year to demonstrate a typical year of activity at the Airport. Due to the global
impacts of the COVID-19 pandemic, airports across the globe, including St. Louis Lambert
International, experienced a significant decline in aviation activity throughout 2020 and into 2021
and 2022. While aviation activity began recovering in 2022, the recovery was uneven for
airports across the U.S. At St. Louis Lambert International Airport, 2023 activity is expected to
surpass 2019 and therefore 2019 is considered representative of the current conditions,
recognizing there have been many structural changes in the economy as a result of the
pandemic that affect all sectors of the economy.
In addition to this historical perspective that generally also represents conditions for 2023, GSL
and the Airport are interested in estimating the future economic impact that will result from the
implementation of a major capital improvement program that includes terminal redevelopment
and expansion. This program will facilitate increases in international service as well as attract
additional activity and growth in the region beyond the Airport. For purposes of this study, 2032
has been assumed to be the year when the full terminal capital program, also referred to as the
preferred airport development program from the Airport’s Master Plan, is complete and is used
to estimate the future economic impact.
The remainder of this technical report starts with a socioeconomic overview of the St. Louis
metropolitan region, then provides context about the Airport and how it compares to other peer
airports. Following this background information, the study defines terminology used in economic
impact, including the different types of impacts calculated, and details the methodology used to

7 | Page
Section 1. Study Introduction // November 2023
calculate the current economic impacts. Once the current economic impacts are presented, the
study provides an overview of the methodology and results of the future economic contributions
analysis.

8 | Page
Section 2. Regional Overview // November 2023
2. Regional Overview
The following subsections provide an overview of historical and future socioeconomic trends
related to population and the economy for the St. Louis Metropolitan Statistical Area. This
information is presented to provide important context about the environment in which the Airport
exists.
2.1. Metropolitan Area Population
St. Louis Lambert International Airport is located within the St. Louis MSA, a bi-state
metropolitan area covering 15 counties across Missouri and Illinois. The counties that make up
the St. Louis MSA are shown in Figure 2-1.
Figure 2-1. Illinois and Missouri Counties within the St. Louis MSA
Source: Greater St. Louis, 2023.

9 | Page
Section 2. Regional Overview // November 2023
The Airport serves as the primary commercial air service and air cargo provider for the almost 3
million people living within the St. Louis MSA, which ranks 21
st
in the nation in terms of
population size. Most of this population resides in the Missouri counties of the MSA, with nearly
1 million people living in St. Louis County alone. The population of the St. Louis MSA has
increased by almost 5% from 2000 to 2021 according to historic data provided by Woods and
Poole Economics, Inc. As shown in Figure 2-2, the area’s population experienced steeper
growth from 2000 to 2010, before growth started to level off. There was very little growth
between 2015 and 2020, before the population saw a decline, likely due to the impacts of the
COVID-19 pandemic.
Figure 2-2. St. Louis MSA Population Change (2000 – 2021)
Sources: Woods and Poole Economics, Inc., (2000-2021), 2023; Kimley-Horn, 2023.
2,600,000
2,650,000
2,700,000
2,750,000
2,800,000
2,850,000
Population

10 | Page
Section 2. Regional Overview // November 2023
According to population projections prepared by Woods and Poole Economics, Inc., the
population of the St. Louis MSA is anticipated to increase by a Compound Annual Growth Rate
of 0.20% between 2022 and 2042. This projected population increase is presented in Figure
2-3 and estimates that approximately 100,000 people will move into the St. Louis MSA over the
next 20 years, which amounts to approximately 4% total population increase.
Figure 2-3. St. Louis MSA Population Projection (2022 – 2042)
Sources: Woods and Poole Economics, Inc. (2022-2042), 2023; Kimley-Horn, 2023.
2.2. Metropolitan Area Economy
As population continues to increase, economic indicators, such as employment, per capita
income, and regional gross domestic product are expected to increase as well. Estimates
indicate that the St. Louis region welcomes approximately 50,000 people relocating to the area
annually, resulting in a major source of new workforce talent for area employers. In addition to
the region’s growing workforce, the St. Louis region is experiencing an entrepreneurial revival,
with approximately 6,000 new businesses coming to the area annually and more than $400
million in venture capital funds invested in local startups in 2020 alone.
1
The economy in the St. Louis MSA is diverse and supported by a wide variety of industries,
many of which rely on the Airport to ship and receive goods, as well as transport individuals to
different markets across the country and the world. Key industries targeted for growth in the St.
Louis region include bioscience and health innovation, advanced manufacturing, agricultural
technology and agribusiness, geospatial sciences, and more. While these key industries
1
St. Louis Regional Overview, Greater St. Louis, Inc, https://greaterstlinc.com/region/regional-overview
2,760,000
2,780,000
2,800,000
2,820,000
2,840,000
2,860,000
2,880,000
2,900,000
2,920,000
2,940,000
Projected Population

11 | Page
Section 2. Regional Overview // November 2023
continue to grow and diversify the economy, the largest industry markets within the metropolitan
region, by share of total employment, include the following industries (presented in order from
largest to smallest):
Education and Health Services,
Professional and Business Services,
Retail and Wholesale Trade, and
Leisure and Hospitality.
2
Even though these industries account for the largest percentage of total employment within the
St. Louis MSA, the employment growth rates of these industries vary widely. As shown in
Figure 2-4, employment in the Education and Health Services industry has grown by an
average of 2% annually since 2000, followed by Leisure and Hospitality with a CAGR of just
under 1%.
3
Growth in the Leisure and Hospitality sector is reflective of the recreational travel
and tourism that is supported in the region. Attractions within the St. Louis MSA include the 630-
foot Gateway Arch National Monument, numerous museums and science centers, professional
sports teams, live music, outdoor recreational areas, and much more. These attractions draw
tens of millions of visitors each year to the St. Louis MSA
4
, many of whom utilize the Airport to
visit the city.
2
St. Louis Lambert International Airport Master Plan, Chapter 3 – Aviation Activity Analyses and Forecast
3
U.S. Bureau of Labor Statistics; Quarterly Census of Employment and Wages, 2020.
4
Explore St. Louis, Annual Report, Fiscal Year 2022.

12 | Page
Section 2. Regional Overview // November 2023
Figure 2-4. Employment Growth Rates by Industry (2000 – 2018)
Source: St. Louis Lambert International Airport, Master Plan, 2022.
Some of the largest employers in the MSA include BJC HealthCare, Washington University in
St. Louis, Mercy Health, and Boeing, which has two locations at/near the Airport. The St. Louis
MSA is also home to several Fortune 500 companies and other large private companies that are
headquartered in the region, as shown in Table 2-1. The presence of these multi-billion-dollar
firms drives, and will continue to drive, demand for infrastructure and services in the St. Louis
region, including the Airport.
Table 2-1. Multi-billion-dollar Firms Located in St. Louis MSA
Firm Name Industry
Annual Revenue
($ billions)
Sources
Centene Health Insurance $144.5 1,2
Bunge
Agribusiness & Food Ingredients
$66.7 2
Enterprise Holdings Services $30.0 3
Emerson Electric Electrical Engineering $19.6 1,2
Reinsurance Group of America Insurance Carriers $16.3 1,2
World Wide Technology Technology Hardware & Equipment $14.5 3
Jones Financial (Edward Jones) Diversified Financials $12.4 1,3
Graybar Electric Capital Goods $10.5 1,3

13 | Page
Section 2. Regional Overview // November 2023
Firm Name Industry
Annual Revenue
($ billions)
Sources
Olin Chemical Manufacturing $9.4 1,2
Ameren Utilities $7.7 1,2
Core & Main Construction $6.7 1
Post Holdings Food Markets $6.4 1
Peabody Energy Coal Energy $4.9 1,2
Stifel Financial Investment Brokerage $4.6 1,2
McCarthy Holdings Construction $4.4 3
Apex Oil Oil & Gas Operations $4.4 3
Arch Resources Coal Energy $3.7 1,2
Arco Construction Construction $3.7 3
Energizer Holdings Manufacturing $3.1 1
Schnuck Markets Food Markets $3.1 3
Caleres Retail $2.9 1
Belden Manufacturing $2.6 1
Alberici Construction $2.6 3
Sources:
1 “7 St. Louis-area companies make Fortune 500 list” St. Louis Business Journal, June 5, 2023,
https://www.bizjournals.com/stlouis/news/2023/06/05/seven-st-louis-companies-make-fortune-500.html, Accessed 6/5/23.
2 “Global 2000, 2023” Forbes, June 8, 2023, https://www.forbes.com/lists/global2000/, Accessed 6/8/23.
3 “America’s Largest Private Companies” Forbes, Dec. 1, 2022, www.forbes.com/largest-private-companies/list/, Accessed 2/23/23.
Compiled by Greater St. Louis Inc.
While not featured on the above list, the Bayer Corporation’s US headquarters is located in St.
Louis, with approximately 6,000 employees based in the region across all lines of business.
Bayer Corporation is a global firm, and frequently relies on access to domestic and international
air transportation to connect various lines of business across their global markets. Bayer is a
key user of the Airport and a more detailed account of how this firm relies on the Airport is
provided in Chapter 4. Current Airport Economic Contributions, Section 4.1.1.
The region’s growing workforce and diversified industries are driving forces in an overall
increase in the Gross Regional Product
5
over the past two decades. Inflation-adjusted (Real)
GRP measures the total value of all goods and services produced in an area, adjusted for
inflation over time. As Real GRP (or Gross Domestic Product) increases, employment and
income associated with that employment also increase, resulting in greater demand for air travel
for both business and leisure travelers. As shown in Figure 2-5, the GRP of the St. Louis MSA
has experienced consistent annual growth over the past 20 years
6
, reaching over $145 billion in
2019. Similar to population, Real GRP did experience short periods of reduction during the
Great Recession of 2009 and during the economic downturn of 2020 caused by the COVID
pandemic.
5
GRP is the equivalent of GDP but relates specifically to production of goods within the St. Louis MSA,
instead of nationally.
6
U.S. Bureau of Economic Analysis.

14 | Page
Section 2. Regional Overview // November 2023
Figure 2-5. Growth in Real Gross Domestic Product (2001 – 2019)
Source: St. Louis Lambert International Airport Master Plan, 2022.
The St. Louis MSA is characterized by a strong and diverse economy that supports many of the
region’s top industries and is considered the third most economically diverse metropolitan area
in the United States.
7
7
St. Louis Regional Overview, Greater St. Louis, Inc, https://greaterstlinc.com/region/regional-overview

15 | Page
Section 3. Airport Setting // November 2023
3. Airport Setting
The following subsections detail the Airport’s unique history, highlight the activity and demand
changes projected over the next 20 years, and present case examples of airports and
communities similar to St. Louis Lambert International Airport.
3.1. Historic Activity
St. Louis Lambert International Airport has a rich and productive history, supporting military and
civilian aviation needs since the inception of air travel. In addition to supporting these essential
aviation needs, the Airport has a long history of aircraft manufacturing, which began in 1939 and
continues to this day. The productivity of the Airport garnered positive public support time and
again, as voters continually approved bond issues for the advancement of the Airport over time.
The Airport is named after Albert Bond Lambert, who learned to fly with the Wright Brothers,
received his pilot’s license in 1911, and served in the U.S. Army in World War I. Major Lambert,
in partnership with the Missouri Aeronautical Society, leased 170 acres of farmland in St. Louis
County in 1920, and leveled the land to build an air strip and hangar. Major Lambert brought the
1923 International Air Races to St. Louis, and a young Charles Lindbergh flew to St. Louis for
the races and remained there after to be a flying instructor. It was during this time that the
Airport earned its name “Lambert St. Louis Flying Field.” In 1925, the Post Office awarded
William Robertson, the Commander of the National Guard’s 110
th
Observation Squadron
located at the Airport, with the airmail contract for service between Chicago and St. Louis, with
Charles Lindbergh as the chief pilot for the route. This Chicago to St. Louis airmail route is the
earliest predecessor of American Airlines.
The Airport captured the interest and hearts of the community and by 1928, a two-million-dollar
bond was approved by voters and Airport improvements began. By 1929, the Airport supported
the first transcontinental air-rail passenger service, which was inaugurated by Transcontinental
Air Transport, later becoming Transcontinental & Western Airlines. The first passenger terminal
was opened in 1933 and served more than 24,000 passengers that year. In that same year,
William Robertson established the Curtiss-Robertson Airplane Manufacturing Company, which
went on to build the Curtiss Robin light airplane and continued to produce a wide range of civil
and military aircraft into the 1930s, at that time operating under the name Curtiss-Wright
Airplane Company.
To support World War II efforts, the McDonnell Aircraft Company was established, and the
Curtiss-Wright aircraft manufacturing plant underwent a $10 million expansion project, which
included a new 6,000-foot-long runway and a new Naval Air Station to train naval aviation
cadets. After the war, the McDonnell Aircraft Company was awarded the contract to design and
produce the Navy’s first jet fighter, the Phantom, which was the first aircraft to take off from a
U.S. Naval air carrier. McDonnell Aircraft Company went on to acquire the Curtiss-Wright plant
and continued designing and producing military aircraft. Eventually, McDonnell Aircraft
Company purchased the factory and land from the City of St. Louis, who used those proceeds
to further Airport improvements, including developing a new 10,000-foot-long runway that could
support the new generation of military aircraft.

16 | Page
Section 3. Airport Setting // November 2023
Into the early 1950s new generations of passenger airlines entered the market, like Ozark
Airlines, and by the late 1950s Trans World Airlines began offering passenger jet service with
the brand-new Boeing 707, making the Airport the first in the U.S. to offer jet airline service.
McDonnell Aircraft Company continued to produce military aircraft, and ultimately built the
Mercury, a spacecraft NASA used to send the first Americans, Alan Shepard and John Glenn,
into space and in orbit. After this, McDonnell Aircraft Company went on to build several other
spacecrafts for NASA.
In 1971, the Airport was officially named the St. Louis Lambert International Airport. By 1982
TWA made the Airport its principal domestic hub and the Airport facilitated this growth in activity
by constructing Concourse D, which brought the total number of gates at the Airport to 81 by
1985. In 1998, the Federal Aviation Administration supported the development of a new 9,000-
foot-long parallel runway, new taxiways, and other associated improvements needed to serve
the growing aviation activity. In 2001, American Airlines purchased TWA assets and
discontinued their hub presence at the Airport. This resulted in a sharp decline in passenger
enplanements in the early 2000s.
8
As shown in Figure 3-1, passenger enplanements have not yet returned to levels experienced
in 2000. Between 2000 and 2003 passenger enplanements dropped significantly, which
corresponds with the reductions in aviation activity due to the aftermath of the 9/11 terrorist
attacks and economic decline. There was some growth occurring in passenger enplanements
after 2004; however, that period of growth was short lived and by 2007 passenger
enplanements were declining and remained steady until 2014. Loss of hub status and the 2009
Great Recession were limiting factors to the Airport’s growth between 2005 and 2014; however,
by 2015 the Airport was experiencing a steady increase in enplanements. By 2019, the Airport
experienced its most significant period of growth since 2000 and was ranked 34
th
busiest in the
U.S in 2019.
9
This return to a growth pattern was cut short due to the impacts of COVID-19,
resulting in a significant drop in enplanements in 2020 experienced by nearly all airports
worldwide. Despite some challenges between 2000 and 2020, the Airport experienced a notable
rebound in activity going into 2021, with just over five million passenger enplanements, trending
toward pre-COVID-19 levels.
8
History – St. Louis Lambert International Airport, https://www.flystl.com/about-
us/history#:~:text=Louis%20Lambert%20International%20Airport%20is,reaching%20the%20rank%20of%
20Major. (Accessed 2023).
9
FAA Passenger Boarding Reports (2000-2021), FAA Terminal Area Forecast (1990-1995).

17 | Page
Section 3. Airport Setting // November 2023
Figure 3-1. St. Louis Lambert International Airport Passenger Enplanements
(2000 – 2021)
Sources: FAA Passenger Boarding Reports (2000-2021); Kimley-Horn, 2023.
0
2,000,000
4,000,000
6,000,000
8,000,000
10,000,000
12,000,000
14,000,000
16,000,000

18 | Page
Section 3. Airport Setting // November 2023
As shown in Figure 3-2, the historic data for air cargo tonnage from 2004 to 2019 shows that
while air cargo tonnage experienced a moderate decline from 2004 to 2015, this activity started
increasing between 2015 and 2019. While air cargo tonnage did increase from 2015 to 2019,
reaching approximately 80,000 tons, this was still significantly lower than the tonnage for 2004
that peaked at slightly less than 120,000 tons.
Figure 3-2. Historical Trends in Air Cargo Tonnage (Short Tons) 2004 – 2019 from
the St. Louis Lambert International Airport Master Plan
Courtesy of: St. Louis Lambert International Airport Master Plan, Chapter 3, Figure 3.4-5, 2022.

19 | Page
Section 3. Airport Setting // November 2023
As shown in Figure 3-3, the historic activity for general aviation operations, both itinerant and
local, show an overall decline in activity from 1997 to 2019; however, there is a significant
increase in GA activity between 2001 and 2002, before activity experiences a significant decline
between 2004 and 2009. Since 2009, GA activity has continued to decline but at a much slower
rate than declines experienced prior.
Figure 3-3. Itinerant and Local General Aviation Operations (CY 1997 – 2019) from
the St. Louis Lambert International Airport Master Plan
Courtesy of: St. Louis Lambert International Airport, Airport Master Plan, Chapter 3, Figure 3.5-3.

20 | Page
Section 3. Airport Setting // November 2023
3.2. Master Plan Forecast Activity Summary
According to recent forecasts developed as a part of the St. Louis Lambert International Airport
Master Plan (initiated in 2020 and nearing completion in 2023), complete recovery from the
impacts of the COVID-19 pandemic may occur on a three-, five-, or nine-year cycle, with the
longer-term forecasts differing based on the three recovery scenarios. All three recovery
scenarios project annual enplanements will reach 9.5 million by 2040, with the three-year
recovery scenario forecast indicating that annual enplanements could reach 10.6 million by
2040, as shown in Figure 3-4.
Figure 3-4. Forecast of the Airport’s Enplanements Under Three Scenarios from
the St. Louis Lambert International Airport Master Plan
Sources: St. Louis Airport Authority (St. Louis Lambert International Airport airport records); Transportation Security Administration
(passenger screening data); Unison Consulting, Inc (forecasts), June 2020. Courtesy of: St. Louis Lambert International Airport
Master Plan, Chapter 3, Figure 3.3-33

21 | Page
Section 3. Airport Setting // November 2023
A three-scenario recovery process was also developed to project future growth in air cargo
tonnage at the Airport from 2020 to 2040, as shown in Figure 3-5. All three scenarios predict
that air cargo tonnage at the Airport will exceed pre-covid levels by approximately 2030, with the
three-year recovery scenario, presented as Scenario One, showing that air cargo tonnage could
exceed 100,000 tons by 2040. The more conservative recovery scenarios indicate that air cargo
tonnage could exceed 94,000 tons and 87,000 tons in Scenario Two (five-year recovery) and
Scenario Three (nine-year recovery), respectively.
Figure 3-5. Air Cargo Forecast Tonnage by Scenario - All Carriers
(FY 2018 – 2040)
Courtesy of: St. Louis Lambert International Airport Master Plan, Chapter 3, Figure 3.4-9.

22 | Page
Section 3. Airport Setting // November 2023
The St. Louis Lambert International Airport Master Plan also included GA operations forecast for
itinerant and local operations from 2020 through 2040. Table 3-1 provides a summary of those
projections and indicates that both GA itinerant and local operations are anticipated to increase
to pre-COVID-19 levels by approximately 2024 and remain steady over the remainder of the
forecast period.
Table 3-1. Forecast GA Operations at St. Louis Lambert International Airport, FY
Basis
Activity
Actual Forecast
2019 2020 2021 2022 2023 2024 2025 2030 2040
GA
Operations
- Local
6,416 6,110 6,110 6,110 6,110 6,416 6,416 6,416 6,416
GA
Operations
- Itinerant
621 318 318 318 318 621 621 621 621
GA –
Operations
Total
7,037 6,428 6,428 6,428 6,428 7,037 7,037 7,037 7,037
Sources: St. Louis Lambert International Airport Authority, St. Louis Lambert International Airport Traffic Reports, 2020, Union
Consulting, Inc, June 2020. Courtesy of: St. Louis Lambert International Airport Master Plan, Chapter 3, Table 3.5-1.
3.3. Similar Airport Comparison
The saying “if you’ve seen one airport, you’ve seen one airport” summarizes the notion that no
two airports are the same and each facility is shaped by a unique history as well as the
communities served by the airport. The physical size, ownership, operational composition, user
types, passenger demand, regional economics and transportation system, nearby airports, and
more can impact how an airport is developed over time and how it will adjust to changing
socioeconomic conditions.
While no two airports are the same, they can be impacted by similar events and conditions.
Case examples were developed to highlight the histories of four airports considered similar to
St. Louis Lambert International Airport and how they overcame a variety of challenges (such as
airline de-hubbing) to be the resilient transportation assets they are today. Those four airports
are:
Pittsburgh International Airport
Nashville International Airport
Cincinnati/Northern Kentucky International Airport
Austin-Bergstrom International Airport
Table 3-2 provides a high-level comparison of the size and activity at St. Louis Lambert
International Airport and the four case example airports. The comparison identifies the airports’
FAA National Plan of Integrated Airport Systems hub-size, which is dictated by the number of
annual enplanements an airport has, with large hub airports experiencing higher number of

23 | Page
Section 3. Airport Setting // November 2023
passenger enplanements than medium hub airports. In addition, the airports’ passenger
rankings and air cargo rankings based on Calendar Year 2021 data are presented. These
rankings are sourced from two FAA reports:
CY 2021 Passenger Boarding Data at all commercial service airports
CY 2021 All-Cargo Airports by Landed Weight at all qualifying cargo airports
Table 3-2. Comparative Summary between St. Louis Lambert International Airport
and Other Case Example Airports
Airport
(FAA ID)
FAA Hub Size
(2023 – 2027 NPIAS)
1
Passenger Rankings
(Out of 518 Commercial
Service Airports)
2
Air Cargo Rankings
(Out of 141 Qualifying
Cargo Airports)
3
STL Medium 36 57
PIT Medium 48 39
BNA Large 27 68
CVG Medium 49 7
AUS Large 30 47
Sources:
1
2023-2027 FAA NPIAS Report, 2022.
2
FAA CY 2021 Enplanements at All Commercial Service Airports, 2022.
3
FAA CY 2021 Qualifying Cargo Airports, Rank Order, and Percent Change from 2020, 2022.
As shown, St. Louis Lambert International Airport is in the middle range for passenger activity
compared to the case example airports. The range of rankings for air cargo is much larger, with
CVG ranking very high given the air cargo emphasis at this airport with both a DHL and Amazon
Air hub; however, St. Louis Lambert International Airport is ranked in the middle of the
remaining three case example airports.
3.3.1. St. Louis Lambert International Airport Overview
While a full regional overview is presented in Section 2. Regional Overview, Section 2.2, this
section, including Table 3-3 and Table 3-4, provides information specific to the region and the
Airport that is necessary for context and comparison to case example airports.
As shown in Table 3-3, the St. Louis MSA has a population of 2.8 million people and a per
capita income of $67,796, according to estimates provided by Woods and Poole Economics,
Inc. The region supports a diverse economy, with the Greater St. Louis economic development
organization identifying a range of key industries in the area, including advanced manufacturing,
agricultural technology, financial and business services, and more.

24 | Page
Section 3. Airport Setting // November 2023
Table 3-3. St. Louis Metropolitan Region Overview
Socioeconomic Factor Socioeconomic Data
St. Louis (MO-IL) MSA Population (2022) 2,818,040
1
St. Louis Per Capita Income (2022) $67,796
2
Key Industries (2023)
Advanced Manufacturing
AgTech
Bioscience and Health Innovation
Digital Transformation
Financial and Business Services
Geospatial
Mobilit
y
and Transportation
3
Sources:
1
Woods and Poole Economics, Inc. Data, St. Louis MSA, 2022.
2
Woods and Poole Economics, Inc. Data, St. Louis MSA, 2022.
3
Greater St. Louis, Inc. https://greaterstlinc.com/industry-strengths, 2023.
St. Louis Lambert International Airport is served by four runways, including three parallel and
one crosswind, as shown in Figure 3-6.
Figure 3-6. St. Louis Lambert International Airport Aerial
Source: Google Earth, Pro, 2023.

25 | Page
Section 3. Airport Setting // November 2023
Table 3-4
presents recent activity at the Airport, including more than five million enplanements,
and more than 590 million pounds of landed cargo in 2021. Currently, the Airport offers
commercial air service across 12 different air carriers, who offer nonstop flights to 70
destinations.
Table 3-4. St. Louis Lambert International Airport Airport Activity Overview
Airport Activity Indicator Airport Activity Data
Number of Annual Enplanements (2021) 5,070,471
1
Landed Cargo Weight in Pounds (2021) 590,883,300
2
Number of Air Carriers (2023) 12
3
Number of Nonstop Destinations (2023) 70
4
Sources:
1
Federal Aviation Administration – Passenger and All-Cargo Statistics,
https://www.faa.gov/airports/planning_capacity/passenger_allcargo_stats/passenger, 2021 (Accessed 2023).
2
Ibid.
3
St. Louis Lambert International Airport, https://www.flystl.com/flights-and-airlines/non-stop-service, 2023
4
Ibid.
3.3.2. Pittsburgh International Airport
PIT serves the Pittsburgh, Pennsylvania MSA and surrounding regions. According to Woods
and Poole Economics, Inc. population estimates, there are more than 2.5 million people within
the Pittsburgh MSA, as shown in Table 3-5. This table also presents the 2022 PCI for the
Pittsburgh MSA, which is approximately $68,618. The Pittsburgh Regional Alliance, the area’s
economic development marketing agency, identifies several key industries serving the region.
These diverse industries, shown in Table 3-5, indicate that the Pittsburgh region is no longer
only a “steel city,” but rather is now an incubator for industries related to healthcare, sciences,
business services, and more.
Table 3-5. Pittsburgh Metropolitan Region Overview
Socioeconomic Factor Socioeconomic Data
Pittsburgh (PA) MSA Population (2022) 2,535,538
1
Pittsburgh Per Capita Income (2022) 68,618
2
Key Industries (2023)
Climate Technology and Decarbonization
Cybersecurity
Energy
Life Sciences and Health
Manufacturing and Distribution
Robotics and Artificial Intelli
g
ence
3
Sources:
1
Woods and Poole Economics, Inc. Data, Pittsburgh MSA, 2022.
2
Woods and Poole Economics, Inc. Data, Pittsburgh MSA, 2022
3
Thriving Pittsburgh Industries, https://pittsburghregion.org/key-
industries/, 2023.

26 | Page
Section 3. Airport Setting // November 2023
PIT is served by four runways, including three parallel runways and one crosswind runway, as
shown in Figure 3-7.
Figure 3-7. Pittsburgh International Airport Aerial
Source: Google Earth, Pro, 2023.
Table 3-6 provides an overview of activity occurring at PIT. According to data published by the
FAA, PIT supported approximately 3.1 million enplanements in 2021, and more than 800 million
pounds of air cargo landed at the airport. The airport also supports 16 different air carriers that
provide nonstop flights to almost 50 destinations.
Table 3-6. PIT Activity Overview
Airport Activity Indicator Airport Activity Data
Number of Annual Enplanements (2021) 3,069,259
1
Landed Cargo Weight in Pounds (2021) 812,896,728
2
Number of Air Carriers (2023) 16
3
Number of Nonstop Destinations (2023) 49
4
Sources:
1Federal Aviation Administration – Passenger and All-Cargo Statistics,
https://www.faa.gov/airports/planning_capacity/passenger_allcargo_stats/passenger, 2021 (Accessed 2023).
2 Ibid.
3 Pittsburgh International Airport, https://flypittsburgh.com/, 2023.
4 Ibid.

27 | Page
Section 3. Airport Setting // November 2023
PIT was opened in 1952, and by 1987 had embarked on a billion-dollar expansion project that
was made possible due to financial support from U.S. Airways who planned to make PIT their
national hub. By 1992, the expansion project was finished and PIT, in partnership with U.S.
Airways, opened a new terminal that consisted of two main buildings, a landside terminal for
security, ground transportation, and baggage handling, as well as an airside building for
passenger gates, which were connected via the PIT People Mover, an underground automated
train system. The new terminal offered 100 gates and, in its prime, offered nonstop flights to
Paris, France; London, England; and Frankfurt, Germany, as well as multiple daily nonstop
flights to locations in California, including Los Angeles, San Francisco, and San Diego, and to
Seattle, Washington. The airport also offered five or more daily flights to nearby cities, including
Huntington, West Virginia, as well as State College and Harrisburg, Pennsylvania.
However, a mere 10 years later, the airport never reached the anticipated demand to utilize all
100 gates provided by the 1987 expansion, due in part to the decline in aviation activity in the
aftermath of the September 11
th
terrorist attacks, and the subsequent departure of U.S. Airways
from PIT. The airline filed for bankruptcy in 2002 and vacated the airport and its airport
properties, which resulted in the loss of 10,000 jobs in the Pittsburgh region. U.S. Airways went
on to focus its service in the Philadelphia, Pennsylvania and Charlotte, North Carolina markets
before merging with American Airlines. The loss of service by U.S. Airways caused a sharp
decline in activity at PIT and the city lost some of its nonstop connections to popular
destinations.
10
The initial loss of U.S. Airways was devastating; however, it did provide an opportunity for other
airlines to provide service to the region. Specifically, Southwest Airlines established a strong
presence at the airport and is now the airport’s largest carrier. It also created room for more
competition for low-cost carriers and other full-service carriers, in turn providing additional
options at varying price points for travelers. Through this transition in air carriers, the airport no
longer serves as an airline hub or connection point but caters to those travelers originating at
and arriving to Pittsburgh as their final destination.
In 2016, the airport gained a new CEO, who was committed to improving the airport’s
performance after a challenging decade. Since 2016 the airport increased the destinations
served from 37 to 67, doubled the number of air carriers from eight to 16, and experienced a
20% increase in passenger traffic between 2016 and 2020.
Strategic partnerships and a business mindset helped change the status of the airport. For
example, the airport’s CEO, along with the CEO of “Visit Pittsburgh” and other Pittsburgh
business leaders, attended the World Routes conference to rally support for new routes to
Pittsburgh. The close relationships and cooperation with business leaders and tourism agencies
helped to spread awareness of companies that are expanding or coming to the area, which
could be used to leverage and attract new airlines and new routes.
The Pittsburgh Tech Council is also involved in these collaboration efforts by advertising the
appeal of the Pittsburgh region and the airport to businesses and other cities. In turn, the airport
10
https://www.pittsburghmagazine.com/pittsburgh-then-and-now-pittsburgh-international-airport/.

28 | Page
Section 3. Airport Setting // November 2023
markets to the tech industry in the area. The cross-industry relationships and collaboration to
market the airport to airlines and large companies is what led to the revival of PIT.
In 2019, partnership-building paid off when the airport secured the return of a British Airways
nonstop flight to London. This route had been on a 20-year hiatus, and while impacts of COVID-
19 suspended the service for a time, it is back and operating. It is anticipated that this flight
alone will generate and contribute more than $50 million annually to the Pittsburgh regional
economy.
11
The airport recently announced an effort to modernize the airport and terminal in order to right-
size the facility for current and future demand projections. The modernization includes the
elimination of the “two-terminal” system and the PIT People Mover used to carry passengers
from landside to airside, and a reduction in the number of gates down to 51.
12
Not only did the airport establish intentional and strategic partnerships to grow its commercial
service footprint, but the airport also has worked equally hard to secure a significant air cargo
presence. The airport experienced an almost 80% increase in landed cargo weight between the
five years from 2016 to 2021 and an approximate 13% increase in cargo traffic in the first
quarter of 2022 compared to 2021. In October 2022, the airport was awarded $44 million in
contracts to build a state-of-the-art cargo facility, using 140,000 square feet of the former
landside terminal building. This multi-million-dollar cargo investment is intended to make PIT the
go-to cargo hub for the future.
13
The airport has experienced many changes in its seven-decade history. Ultimately, partnerships
with key airlines, businesses, industries, and organizations, as well as strategic investments in
airport infrastructure, have led to the revitalization of PIT. The airport continues to serve as a
critical link in the transportation network of the greater Pittsburgh region, for residents and
visitors alike.
3.3.3. Nashville International Airport
As shown in Table 3-7, BNA serves the Nashville-Davidson-Murfreesboro-Franklin MSA and
surrounding region. According to Woods and Poole Economics, Inc., the population of the
Nashville-Davidson-Murfreesboro-Franklin MSA is approximately two million people and the PCI
for the area is $71,030. The Nashville Area Chamber of Commerce identifies several key
industries in the region which are presented in Table 3-7, and include corporate operations,
music, and entertainment, and more.
11
https://flypittsburgh.com/acaa-corporate/newsroom/news-releases/british-airways-announces-return-of-
nonstop-service-between-pittsburgh-and-london/.
12
https://www.pittsburghmagazine.com/flying-into-the-future-pit-getting-new-terminal-fewer-gates/.
13
https://www.ttnews.com/articles/pittsburgh-airport-dedicates-44-million-build-cargo-facility.

29 | Page
Section 3. Airport Setting // November 2023
Table 3-7. Nashville Metropolitan Region Overview
Socioeconomic Factor Socioeconomic Data
Nashville-Davidson-Murfreesboro-Franklin (TN)
MSA Population (2022)
2,039,433
1
Nashville Per Capita Income (2022) $71,030
2
Key Industries (2023)
Advanced Manufacturing
Corporate Operations
Healthcare
Music and Entertainment
Suppl
y
Chain Mana
g
emen
t
3
Sources:
1
Woods and Poole Economics, Inc. Data, Nashville-Davidson-Murfreesboro-Franklin MSA, 2022.
2
Woods and Poole Economics, Inc. Data, Nashville-Davidson-Murfreesboro-Franklin MSA, 2022.
3
Nashville Area Chamber of Commerce – Target Industries, https://www.nashvillechamber.com/economic-development/relocate-or-
expand/target-industries, 2023.
As shown in Figure 3-8, the airport is served by four runways, which include three parallel
runways and one crosswind runway.
Figure 3-8. Nashville International Airport Aerial
Source: Google Earth, Pro, 2023.

30 | Page
Section 3. Airport Setting // November 2023
As shown in Table 3-8, BNA supported approximately 7.6 million passenger enplanements in
2021, which is the highest number of enplanements of all the case example airports included in
this report. In addition, approximately 474 million pounds of air cargo landed at the airport in
2021. There are 20 air service carriers operating at the airport, providing nonstop flights to 100
destinations.
Table 3-8. BNA Airport Activity Overview
Airport Activity Indicator Airport Activity Data
Number of Annual Enplanements (2021) 7,594,049
1
Landed Cargo Weight in Pounds (2021) 474,650,550
2
Number of Air Carriers (2023) 20
3
Number of Nonstop Destinations (2023) 100
4
Sources:
1
Federal Aviation Administration – Passenger and All-Cargo Statistics, https://www.faa.gov/airports/planning_capacity/ passenger_
allcargo_stats/passenger, 2021 (Accessed 2023).
2
Ibid.
3
Nashville International Airport, https://flynashville.com/, 2023
4
Ibid.
BNA originally opened in 1937 under the name Berry Field. The airport underwent significant
expansion during World War II to support the United States Army Air Forces’ Airport Transport
Command. After WWII, the United States Army Air Forces gave control of the airport back to the
City of Nashville and by 1958 the City Aviation Department started on a modernization and
expansion project for civil use.
After only a decade, the airport needed another expansion and in 1973, the newly established
Metropolitan Nashville Airport Authority produced a long-term growth plan that included a new
terminal and a new parallel runway that would increase capacity and reduce time between
takeoffs and landings. Construction of the new terminal took place between 1984 and 1987, and
a new parallel runway opened in 1989.
14
During this time, American Airlines invested $115 million in developing a new 15-gate
concourse, which opened in 1986, that would serve to support the American Airlines hub at the
airport. The American Airlines hub benefited the airport by bringing a number of nonstop flights
to many cities across the United States and Canada, as well as offering a nonstop flight to
London. The presence of American Airlines also helped attract large companies to headquarter
in the Nashville area, including Nissan and Saturn Corporation.
Service as an American Airlines hub peaked in 1993 with 265 daily departures to 79 cities;
however, after 1993, flights continually scaled back and by 1995 the American Airlines hub
14
http://www.nashville-bna.airports-guides.com/bna_history.html.

31 | Page
Section 3. Airport Setting // November 2023
closed. American Airlines cited the recession of the early 1990s and the lack of local
passengers as the reason for their departure from the airport.
15
After the loss of hub status, a “right-sizing” of the airport needed to occur, which included cutting
costs and making strategic decisions about growth. Political, business, and tourism leaders
were spurred into action to identify opportunities to revitalize the city, and its airport. Airport
executives dedicated efforts to lobby and attract new airlines, while city and business leaders
launched marketing campaigns to market Nashville as a prime location to live, vacation, and
conduct business. Local leaders emphasized the absence of state income tax in Tennessee as
a part of their marketing strategy. The city also offered incentives to bring new businesses to the
area. At the same time, Nashville’s long history of being considered “Music City U.S.A.,” named
as such in 1950, and its more recent emergence as a prime destination for leisure travelers,
spurred an economic revival in the area and brought more passengers and increased traffic to
the airport. By 2004, Southwest Airlines began growing its presence at the airport, along with
several other legacy carriers and LCCs. Southwest Airlines has grown to be the airport’s largest
carrier and the airport offers more daily flights currently (38) than at its peak with American
Airlines in 1993.
In 2017 the airport launched a five-year strategic development plan, referred to as “Vision BNA,”
that was informed by the 2017 Master Plan. Vision BNA included a $1.4 billion investment which
resulted in a new concourse (Concourse D), two expanded ticketing wings with their own
security checkpoints, and two new parking garages. Vision BNA also includes a new terminal
lobby, an international arrivals facility, and an on-airport Hilton Hotel, which are still to be
constructed. This development plan was deemed necessary to keep pace with the rapid growth
that Nashville has experienced over recent years. U.S. Census data indicates Nashville has
been the fifth fastest growing metropolitan area in the country over the last five years (from 2016
to 2021). The city attracts new residents due to its thriving economy, and the city’s diverse
industries make it a top U.S. city for job growth.
16
BNA shares a similar history of changing hub status and air carrier services as experienced at
PIT, along with a later revitalization of activity that resulted from a concerted effort to partner
with businesses and industries that would draw demand back to the airport. These partnerships,
accompanied by a notable uptick in tourism, have positioned the airport for continued growth
and vitality.
3.3.4. Cincinnati/Northern Kentucky International Airport
CVG serves the Cincinnati metropolitan area, which includes parts of Ohio, Kentucky, and
Indiana and a population of approximately 2.3 million people, according to 2022 Woods and
Poole Economics, Inc. estimates. The MSA has a PCI of $65,752, as shown in Table 3-9. The
area’s economic development agency, Regional Economic Development Initiative Cincinnati,
identifies four key industries in the region, shown in Table 3-9.
15
https://www.businessinsider.com/r-former-hub-airports-find-new-life-after-downsizing-2014-03.
16
https://airport-world.com/the-best-of-nashville/.

32 | Page
Section 3. Airport Setting // November 2023
Table 3-9. Cincinnati Metropolitan Region Overview
Socioeconomic Factor Socioeconomic Data
Cincinnati (OH-KY-IN) MSA Population (2022) 2,270,796
1
Cincinnati (OH-KY-IN) Per Capita Income
(2022)
$65,752
2
Key Industries (2023)
Bio-health
Business and Professional Services
Advanced Manufacturing
Technolo
gy
3
Sources:
1
Woods and Poole Economics, Inc. Data, Cincinnati MSA, 2022.
2
Woods and Poole Economics, Inc. Data, Cincinnati MSA, 2022.
3
Regional Economic Development Initiative (REDI) Cincinnati – Core Industries, https://redicincinnati.com/#:~:text=REDI%20
Cincinnati%20is%20the%20first,passionate%20about%20the%20Cincinnati%20region, 2023.
There are four runways at CVG, including three parallel runways and one crosswind runway, as
shown in Figure 3-9.
Figure 3-9. Cincinnati/Northern Kentucky International Airport Aerial
Source: Google Earth, Pro, 2023.

33 | Page
Section 3. Airport Setting // November 2023
According to FAA reports for 2021, CVG supported just over three million passenger
enplanements and almost 8.5 billion pounds of air cargo was landed at the airport. As previously
noted, CVG supports the largest cargo activity of all the case example airports. There are 14
different air service providers at the airport that offer nonstop flights to over 50 destinations, as
shown in Table 3-10.
Table 3-10. CVG Airport Activity Overview
Airport Activity Indicator Airport Activity Data
Number of Annual Enplanements (2021) 3,050,597
1
Landed Cargo Weight in Pounds (2021) 8,478,266,612
2
Number of Air Carriers (2023) 14
3
Number of Nonstop Destinations (2023) 51
4
Sources:
1
Federal Aviation Administration – Passenger and All-Cargo Statistics, https://www.faa.gov/airports/planning_capacity/
passenger_allcargo_stats/passenger, 2021 (Accessed 2023).
2
Ibid.
3
CVGAirport.com – Cincinnati/Northern Kentucky International Airport, 2023.
4
Ibid.
CVG was opened in 1947 and serves as the main commercial service airport for the Cincinnati
metropolitan region, including southern Ohio, northern Kentucky, and southeastern Indiana. In
the mid-1980s, Delta Air Lines opened a hub at the airport and provided financial support to
construct 22 gates across two terminals. Several years later, Delta invested another $500
million to build a third terminal that included Concourses A, B, and C.
In the 1990s, Delta shifted several of its flights at CVG from mainline to Comair flights. Comair
was a regional airline and owned subsidiary of Delta Air Lines. This change created the Delta
Connection regional service that still exists today and resulted in almost double the passenger
traffic within a decade. At its peak, Delta provided flights to over 130 destinations, including
international destinations like Amsterdam, Netherlands, and Frankfurt, Germany, and handled
over 670 Delta and Delta Connection flights each day.
17
However, by 2005, Delta Air Lines filed for bankruptcy, citing a spike in jet fuel prices and
growing competition from LCCs.
18
Delta flights began to steadily decrease and by 2008, Delta
had vacated their hub at CVG, while continuing to offer a significantly reduced number of flights,
and ultimately acquired Northwest Airlines during a merger acquisition. By 2014, CVG
experienced a 74% decrease in passenger traffic and went from over 600 daily flights to a mere
200 daily flights across all carriers. To account for the decrease in operations, the airport
consolidated all activity into one terminal and tore down the other two terminals by 2016.
19
17
https://airlinegeeks.com/2017/06/14/the-death-and-rebirth-of-memphis-mem-and-cincinnati-cvg/.
18
https://money.cnn.com/2005/09/14/news/fortune500/delta/.
19
https://doctoraviation.com/fall-rise-cincinnati-northern-kentucky-airport/.

34 | Page
Section 3. Airport Setting // November 2023
Around the same time that Delta left their CVG hub, CVG also experienced decreased activities
related to air cargo operations due to the relocation of the DHL headquarters from Cincinnati to
Wilmington, Ohio after DHL acquired Airborne Express in 2003. By 2005, CVG experienced a
nearly 29% decrease in landed cargo weight from the previous year and by 2006, an almost
87% drop in landed cargo weight. In just two short years CVG went from the 15
th
biggest cargo
carrier to the 101
st
.
In 2013, when the airport was continuing to experience decline, it secured its first LCC, with
Frontier Airlines, followed by Allegiant Airlines and Southwest Airlines. Around 2015, the airport
began making strategic decisions to significantly revitalize the airport. For example, to avoid
having one airline control the fate of the airport, a five-year contract was established in 2016
between the airport and Delta, which allowed CVG to retain a majority of the control over
business decisions at the airport. Included in this agreement was CVG’s ability to have more
control over capital projects, whereas before Delta had the power to approve almost all capital
projects and expenditures.
This deal also allowed CVG to retain leftover funds at the end of each year which could be used
in incentive packages to attract more airlines. Moreover, the contract created a more attractive
environment for LCCs and other carriers to come to the airport, creating a more competitive
environment. The deal also included a clause related to cargo carriers and stated that a
minimum amount of space must be leased, or minimum defined annual landed weight needed
to be met, in order for the cargo carrier to be a lessee. This new deal led to DHL returning to the
airport and establishing a “global super hub” at the airport as well as Amazon Air Cargo
constructing a new facility at the airport.
20
The strategy to revitalize the airport’s facilities was focused on diversifying operations rather
than relying on one airline and creating lease agreements that reserved decision making power
for the airport. Bringing in LCCs, attracting other airlines with financial incentives, and securing a
direct flight from Cincinnati to London, England on British Airways all contributed to the
revitalization of the airport. Moreover, the strategic decisions to bolster air cargo and attract new
cargo carriers helped to bring back the cargo activity that was once a significant part of CVG’s
overall operation. CVG was able to convert its operations from 90% connection trips during
Delta’s hub presence to the current 94% origin and destinations trips across a mix of airlines.
3.3.5. Austin-Bergstrom International Airport
AUS serves the Austin-Round Rock-Georgetown metropolitan area and surrounding regions in
Texas. According to 2022 Woods and Poole Economics, Inc. estimates, the population of this
metropolitan area is approximately 2.4 million people, and the PCI for the region is $73,027, as
shown in Table 3-11. According to the region’s economic development organization, Austin
Chamber, the area supports a diverse range of key industries, from automotive, to space
technology, financial services, and more.
20
https://www.cincinnati.com/story/money/2015/06/22/cvg-airlines-agreement/29114783/.

35 | Page
Section 3. Airport Setting // November 2023
Table 3-11. Austin Metropolitan Region Overview
Socioeconomic Factor Socioeconomic Data
Austin-Round Rock-Georgetown (TX) MSA
Population (2022)
2,398,380
1
Austin-Round Rock-Georgetown (TX) MSA Per
Capita Income (2022)
$73,027
2
Key Industries (2023)
Creative and Digital Media Technology
Financial Services
Advanced Manufacturing
Automotive
Corporate HQ and Regional Offices
Data Management
Life Sciences
Semiconductors
Space Technology
Clean Technolo
gy
3
Sources:
1
Woods and Poole Economics, Inc. Data, Austin-Round Rock-Georgetown MSA, 2022.
2
Woods and Poole Economics, Inc. Data, Austin-Round Rock-Georgetown MSA, 2022.
3
Austin Chamber – Economic Development – Key Industries, https://www.austinchamber.com/economic-development/key-
industries, 2023.
AUS is served by two parallel runways, shown in Figure 3-10 which is the fewest of all the case
example airports.

36 | Page
Section 3. Airport Setting // November 2023
Figure 3-10. Austin-Bergstrom International Airport Aerial
Source: Google Earth, Pro, 2023.
As shown in Table 3-12, AUS supported more than 6.6 million enplanements in 2021, according
to data provided by the FAA, which also reports that more than 600 million pounds of landed
cargo weight passed through AUS in 2021. According to the airport website, there are 19 air
carriers operating at AUS, offering nonstop flights to 90 destinations.
Table 3-12. AUS Airport Activity Overview
Airport Activity Indicator Airport Activity Data
Number of Annual Enplanements (2021) 6,666,215
1
Landed Cargo Weight in Pounds (2021) 607,956,455
2
Number of Air Carriers (2023) 19
3
Number of Nonstop Destinations (2023) 90
4
Sources:
1
Federal Aviation Administration – Passenger and All-Cargo Statistics,
https://www.faa.gov/airports/planning_capacity/passenger_allcargo_stats/passenger, 2021 (Accessed 2023).
2
Ibid.
3
Austintexas.gov/airport – Austin-Bergstrom International Airport, 2023
4
Ibid.

37 | Page
Section 3. Airport Setting // November 2023
AUS opened in 1999 after the former Bergstrom Air Force Base was decommissioned in 1993
and the land was returned to the City of Austin. The airport was the first to be built under the
U.S. Department of Defense’s Base Realignment and Closure Commission and began offering
commercial service to visitors and residents of the Austin area. Unlike the other airports
featured in this report, AUS never served as an airline hub or experienced the rapid decline in
activity due to the loss of hub status. However, the airport did experience a number of other
challenges in its history due to rapid population growth and a surge in demand for air travel
without adequate capacity. In 2014, the airport’s footprint had grown significantly to
accommodate increased demand, and British Airways began offering the first nonstop
transatlantic flight to London, England. By 2015, the airport needed to undergo its first terminal
expansion to support the growing demand. The expansion included an enlarged customs and
immigration facility, two domestic baggage claim belts, and an expanded security checkpoint on
the ticketing level.
21
In 2017 the Airport began a master planning process, and by 2019, published the AUS 2040
Master Plan, which envisioned the future of the airport including the anticipated doubling of
enplanements that would accompany continued population growth in the area. Since the Master
Plan was developed prior to the COVID-19 pandemic, the airport took a renewed look at the
original expansion plan to meet the changing needs and frequency of post-pandemic travel. The
airport established the Airport Expansion Development Program which includes initiatives and
developments that are scalable to meet a range of forecasted growth profiles post-pandemic.
Part of the redevelopment plans for the airport call for the removal of the existing South
Terminal (currently leased and managed by a third-party business operator) in order to make
room for a new Midfield Concourse.
22
The Austin region continues to experience significant and consistent socioeconomic growth. In
2021, Austin made headlines for being a hotspot for startup founders and venture capitalists to
settle. After years of targeted marketing and strategic development decisions, the city is now
considered a second Silicon Valley, operating as its own tech hub. There are several companies
in Austin that surpass a $1 billion valuation, and the city is also home to Tesla, who moved their
headquarters from Silicon Valley, as well as secondary offices for Google, Apple, Oracle,
Amazon, Facebook, and Space X.
23
One report indicates that 185 people are moving to Austin
each day.
24
21
https://www.prnewswire.com/news-releases/british-airways-begins-flying-from-austin-texas-marking-
the-first-transatlantic-.
22
https://www.kvue.com/article/money/economy/boomtown-2040/austin-bergstrom-international-airport-
extensive-improvement-plan/269-8fbaf3a7-8ee7-4dfa-b7ee-9a413542b79b.
23
https://www.kvue.com/article/money/economy/boomtown-2040/austin-tech-startups-raise-billions/269-
240d69af-8fc0-4cfb-932d-139edda4a73a.
24
https://techcrunch.com/2022/04/06/how-austin-texas-has-evolved-into-a-city-of-unicorns-and-tech-
giants/?guccounter=1&guce_referrer=aHR0cHM6Ly93d3cuZ29vZ2xlLmNvbS8&guce_referrer_sig=AQAA
AMrIGlPZxnKiyEHj39an8RIr_ykBqcRhMlEBvaN6X95_C32yl8tyY8editjCG6cJYd9DOiISwyD3wQ10ZBFta
4LRjrOgTyFshZYrxiox2yERHzaW971MurBb1fTr0j4vdyYEtK_-
clW0BMQe9kYKyutnw3PcNDPEUkhk5bnTU_i8.

38 | Page
Section 3. Airport Setting // November 2023
The surge of new population, thriving business markets, and the vacation appeal of the area
contribute to a growing demand for air travel at the airport. AUS has had to quickly respond to
changes in population and demand for services, and has done so by developing strategic
partnerships, making necessary “right-sizing” decisions, and using the momentum of the rapidly
growing population in the area to drive demand for the airport.
3.3.6. Summary
Table 3-13 presents a comparison of the population within the respective metropolitan areas of
each chosen airport and provides a comparison of airport activity, including enplanements,
landed cargo weight, the number of air carriers, and nonstop destinations offered. As shown,
the St. Louis metropolitan area has the largest population, and the Nashville area has the
smallest population. Despite serving the smallest metropolitan area population, BNA had the
most passenger enplanements in 2021, with approximately 7.6 million enplanements, and the
largest number of air carriers and nonstop destinations. The number of enplanements at St.
Louis Lambert International Airport sits within the middle of the enplanement range, with
approximately five million enplanements. While St. Louis Lambert International Airport had the
fewest air carriers, the Airport offers service to 70 destinations, which is the third most nonstop
destinations offered by the comparison airports. CVG supported the most landed air cargo,
which is to be expected due its large DHL and Amazon Air presence. Landed air cargo weight at
these airports ranged from approximately 474 million pounds to approximately 8.5 million
pounds, with St. Louis Lambert International Airport supporting approximately 590 million
pounds of landed cargo.
Table 3-13. Airport Summary Comparison
Airport
(FAA ID)
MSA
Population
Number of
Annual
Enplanements
Landed Cargo
Weight (lbs)
Number of
Air
Carriers
Number of
Nonstop
Destinations
STL 2,818,040 5,070,471 590,883,300 12 70
PIT 2,535,538 3,069,259 812,896,728 16 49
BNA 2,039,433 7,594,049 474,650,550 20 100
CVG 2,270,796 3,050,597 8,478,266,12 14 51
AUS 2,398,380 6,666,215 607,956,455 19 90
Sources: See Table 3-4 through Table 3-12 for sources for each airport.
When looking at socioeconomic and airport activity for these metropolitan areas and their
airports over a 10-year historic period (2009-2019), it is evident that the economic growth
occurring in Austin and Nashville exceeded the growth occurring in St. Louis, Cincinnati, and
Pittsburgh during that time. Table 3-14 presents the percent growth of four socioeconomic
indicators for the five metropolitan areas associated with the study airports. The socioeconomic
indicators evaluated were population, PCI, employment, and GRP. As shown, the percent
change for Austin and Nashville was higher than the others across all indicators, particularly
GRP with Austin’s metropolitan area experiencing a 57% increase and Nashville’s metropolitan
area experiencing a 47% increase in GRP. Percent changes in population and employment

39 | Page
Section 3. Airport Setting // November 2023
were minor across all locations but the metropolitan areas surrounding AUS and BNA still had
the highest percent change for both indicators.
Table 3-14. Historic Comparison of Socioeconomic Across Case Study Airports
Airport
(FAA ID)
Population
Percent Change
(2009 – 2019)
PCI Percent
Change
(2009 – 2019)
Employment
Percent Change
(2009 – 2019)
GRP Percent
Change
(2009 – 2019)
STL
0.04% 28% 0.06% 11%
AUS
0.08% 37% 0.16% 57%
BNA
0.07% 34% 0.13% 47%
CVG
0.05% 30% 0.09% 28%
PIT
0.04% 34% 0.08% 28%
Sources: Woods and Poole Economics, 2019; Kimley-Horn, 2023.
While St. Louis may have experienced the lowest percent growth across these indicators during
2009-2019, the region did have the highest overall population, GRP, and employment levels
consistently over the 10-year period compared to the other study metro areas, as shown across
the three charts presented in Figure 3-11. St. Louis did not have the highest consistent PCI so
that indicator is not presented in the following figure.

40 | Page
Section 3. Airport Setting // November 2023
1,500
1,700
1,900
2,100
2,300
2,500
2,700
2,900
2009 2010 2011 2012 2013 2014 2015 2016 2017 2018 2019
Population (in thouands)
Population (2009 – 2019)
STL AUS BNA CVG PIT
Sources: Woods and Poole Economics, 2019; Kimley-Horn, 2023
$80,000
$90,000
$100,000
$110,000
$120,000
$130,000
$140,000
$150,000
$160,000
2009 2010 2011 2012 2013 2014 2015 2016 2017 2018 2019
GRP (in millions of 2023 dollars)
Gross Regional Product (GRP) (2009 – 2019)
STL AUS BNA CVG PIT
900
1,000
1,100
1,200
1,300
1,400
1,500
1,600
1,700
1,800
2009 2010 2011 2012 2013 2014 2015 2016 2017 2018 2019
Employment (in thousands)
Employment (2009 – 2019)
STL AUS BNA CVG PIT
1,500
1,700
1,900
2,100
2,300
2,500
2,700
2,900
2009 2010 2011 2012 2013 2014 2015 2016 2017 2018 2019
Population (in thouands)
Population (2009 – 2019)
STL AUS BNA CVG PIT
Figure 3-11. Summary of Historic Socioeconomic Trends Across Study Airports

41 | Page
Section 3. Airport Setting // November 2023
St. Louis’s strong and steady economy over the 2009-2019 period created an environment for
aviation activity to remain steady and grow over the 10-year period, despite the challenges
associated with de-hubbing. The Airport’s growth during this period is presented in terms of
annual enplanements in Figure 3-12, which shows stable enplanements between 2010-2014,
before increasing at a rapid rate between 2015 and 2019. AUS and BNA also experienced a
steady and significant increase in annual enplanements during this period, which coincides with
the significant economic growth in those metropolitan areas, as presented previously in Table
3-14. PIT and CVG did not do as well during this period. CVG experienced a significant decline
in annual enplanements between 2009 and 2012 before experiencing some recovery, but still
not reaching former 2009 annual enplanements. PIT similarly experienced some decline in
annual enplanements between 2009 and 2013, before recovering to slightly more than 2009
enplanements by 2018/2019.
Figure 3-12. Historic Enplanements at Comparison Airports
Sources: 2022 FAA TAF; Kimley-Horn, 2022
The case examples presented for PIT, BNA, CVG, and AUS airports demonstrate that
fluctuations in regional and national economies, air service activity, and other external factors
can create challenges for airports to serve changing customer bases and regional stakeholders.
Major events, such as airlines changing their hubs, drastic decreases in air service demand
related to events outside of an airport or community’s control (e.g., pandemics, terrorist attacks,
economic recessions, etc.), significant population growth and associated air service demand
related to business growth and development, and other opportunities and challenges can
change a community’s need for air transportation.
2,000,000
3,000,000
4,000,000
5,000,000
6,000,000
7,000,000
8,000,000
9,000,000
2009 2010 2011 2012 2013 2014 2015 2016 2017 2018 2019
STL AUS BNA CVG PIT

42 | Page
Section 3. Airport Setting // November 2023
While most changes aren’t overnight, development at airports takes time from concept through
implementation and airports typically can’t make quick facility changes to adapt. In addition to
STL, the case example airports that experienced both growth and decline had to identify
strategic opportunities to maintain an airport that meets its community’s needs without over or
under developing. Forming partnerships with regional economic development organizations and
other local organizations proved effective for many of the case example airports in rebranding
and attracting new businesses, industries, population, and funding to a region, which in turn
positively impacted the airport. These case examples demonstrate that being flexible and
adaptable to changing environments and being proactive about forming strategic partnerships
can help an airport remain resilient and optimize performance over time.

43 | Page
Section 4. Economic Methodology and Modeling // November 2023
4. Economic Methodology and Modeling
The process of calculating the economic impact for St. Louis Lambert International Airport is
based on an industry-standard process that involves collecting data, calculating direct impacts,
modeling the multiplier impacts, and determining the total economic output. The direct,
multiplier, and total impacts are generated from measuring the impacts of core airport activities
including airport administration; airport tenants such as concessionaires, airlines, fixed-base
operators, and rental cars; as well as airport construction, aviation-reliant businesses, and
spending from commercial service and GA visitors. The following subsections define the key
terms necessary to understand economic impact and provide an overview of the data collection
and methodology required for the analysis.
4.1. Key Terms
Several key terms are used to present economic impact, and it is important that these terms are
well understood to accurately interpret the findings of this study. The following subsections
define these key terms.
4.1.1. Economic Impact Categories
Three categories are used to describe the economic impact generated from an airport’s activity.
These terms are defined in Table 4-1, and include direct impacts, as well as the multiplier
impacts comprised of indirect and induced impacts. The multiplier impacts are determined
through use of IMPLAN, an industry-accepted economic modeling program. A detailed
description of IMPLAN and the way that it was used to model economic impacts, including the
multiplier impacts, is presented in Section 4.3.
Table 4-1. Defining Economic Impact Categories
Impact Category Definition
Direct
Initial effects that occur on- and off-airport, including airport operations,
airport and tenant construction, as well as by spending from visitors and by
companies using air transportation services.
Multiplier
Effects
Indirect
Portions of direct revenues used to purchase goods and services from
businesses in the St. Louis MSA. This is sometimes referred to as “supplier
sales.”
Induced
Income earned by workers from direct and supplier sales transactions that
are then spent in the St. Louis MSA. This is sometimes referred to as
“income re-spending.”
Source: Kimley-Horn, 2023.

44 | Page
Section 4. Economic Methodology and Modeling // November 2023
The direct impacts are generated by activity stemming from the following activities:
On-Airport
Airport Administration and Operations
Airport Tenants
Cargo
Capital Improvements
Visitor Spending
Commercial Service Visitors
GA Visitors
Off-Airport
Aviation-related Businesses (Including Parking Operators)
Aerospace Manufacturing
Each one of these direct impacts generates indirect (supplier sales) and induced impacts
(income re-spending). The sum of these three categories of impact results in the total economic
impact.
4.1.2. Economic Impact Measures
The direct, indirect, induced, and total impact of activity occurring on- and off-airport is
presented using four distinct measures of impact which include: jobs, payroll, value added, and
business revenues. Table 4-2 provides a definition of these measures.
Table 4-2. Defining Economic Impact Measures
Measure Definition
Jobs
Total number of persons employed that are associated with
business revenues and payroll, regardless of whether they are full-
or part-time.
Payroll
Total employment compensation, including wages and benefits.
Payroll is a subset of value added and is also referred to as “labor
income” or “total compensation.”

45 | Page
Section 4. Economic Methodology and Modeling // November 2023
Measure Definition
Value Added
Measures the economic productivity of aviation-related businesses
in the study area, calculated as business revenues earned minus
the cost of purchasing foods and services from other businesses.
Value added is a company’s or industry’s contribution to the Gross
Regional Product and includes all labor compensation, profits, and
business taxes paid.
Business
Revenues
Incorporates expenditures needed to administer airports, sales of
goods and services by airport tenants, budget expenditures by
public sector agencies located on airports, cost of capital
expenditures, visitor spending, and sales enabled by air cargo
services. This is sometimes called “output” or even “economic
impact.”
Sources: EBP, Kimley-Horn, 2023,
Jobs are the only measurement not presented in terms of dollars, and instead simply present
the number of employed people. Payroll, value added, and business revenues are presented in
terms of a 2019-dollar value; however it is important to note that these dollar amounts are not
simply summed together to generate total business revenues, also referred to as output. The
reason these measures cannot be added together is because value added is a component of
business revenues and payroll is a further component of value added; therefore, these
measures nest inside one another, as shown in Figure 4-1.
Figure 4-1. Relationship of Payroll, Value Added, and Business Revenues
Source: Kimley-Horn, 2023.
Business
Revenues
Value
Added
Payroll

46 | Page
Section 4. Economic Methodology and Modeling // November 2023
The economic impact categories described in Section 4.1.1 are the foundation for the Airport’s
total economic impact, which is then presented through the four economic impact measures
defined in Table 4-2. A graphic representation of how the categories and measures work
together to present economic impact is shown in Figure 4-2.
Figure 4-2. St. Louis Lambert International Airport Economic Impact Calculation
Process
Source: Kimley-Horn, 2023
4.2. Data Collection
The accuracy of the St. Louis Lambert International AEIS study relies on collecting a
comprehensive dataset from both primary and secondary sources. The data collected from
primary sources were provided by the Airport, whereas FAA, ESRI Business Analyst, and
IMPLAN were used for the secondary sources. A brief overview of how data was collected for
each component of the study is presented in the following subsections.
4.2.1. On-Airport Activity
As mentioned previously, on-airport activity includes several different components and the data
associated with each component is presented as follows:
Airport Administration: Airport administration data includes employment and payroll
information for airport management staff, staff required to perform airport business operations,
airport maintenance and operations staff, and other staff. In addition to the data collected for St.

47 | Page
Section 4. Economic Methodology and Modeling // November 2023
Louis Lambert International Airport employees, information related to contractors who perform
work for the Airport that receive IRS Form 1099-MISC or those that are contracted for
administrative tasks were also included. St. Louis Lambert International Airport staff provided
this information via financial reports and through airport badge counts.
Airport Tenants: Airport tenants is a broad component of on-airport activity and includes
airlines, FBOs, concessionaires, retailers, rental car operators, government agencies, and other
businesses located on-airport. St. Louis Lambert International Airport provided a comprehensive
list of tenant employment via airport badge counts. It was also necessary to identify the industry
types for each airport tenant. Research into each business and coordination with the Airport was
conducted to ensure that industry types assigned to each business were accurate. A close
review of badge information was conducted to remove any duplication between airport
administration and airport tenant employment.
Construction: Construction costs, or capital expenditures, are incurred by the Airport and other
on-airport tenants and were therefore collected for both. St. Louis Lambert International Airport
provided five years of historic capital expenditures data, from 2015 to 2019. The five years of
data were averaged to represent an average year of capital spending, as opposed to reflecting
either an annual high or low outlier caused by schedule, weather, financing, or other factors.
This provides a more even estimate of annual economic impact generated as a result of
construction spending.
It was important that the capital expenditures provided by the Airport represented actual costs
incurred, not simply planned expenses that may not have occurred. The average annual capital
expenditures were treated as direct business revenues because these costs are revenues
received by the companies that perform the work. Then, regional relationships between
construction revenues and jobs, payroll, and value added were used to develop the full profile of
direct impacts resulting from capital expenditures on construction. As discussed in Section 4.3,
IMPLAN is used to identify these regional relationships.
Aerospace Manufacturing: The aerospace manufacturing industry has a significant presence
at the Airport, with two major aerospace manufacturing firms located at the Airport in 2019.
25
The economic impact of these firms is ultimately included in the final economic impact results;
however, these results are presented separately from other St. Louis Lambert International
Airport impacts to indicate the impact of these businesses alone. Representatives from the
Airport and the aerospace firms were coordinated with directly to collect the necessary data,
which was the number of employees and capital expenditures incurred by the firms during the
study year.
25
One of the aerospace firms included in this analysis announced plans to close their plant by the end of
2023, however, because they were active on the airfield during the base year of this study, they were
included in the 2019 economic impacts analysis.

48 | Page
Section 4. Economic Methodology and Modeling // November 2023
4.2.2. Off-Airport Activity
Off-airport activity included identifying aviation-related businesses within 10 miles of the Airport
and determining the impact of visitors arriving to the area via commercial service or GA. Details
regarding both data collection processes are presented in the following subsections.
4.2.2.1. Aviation-Reliant Businesses
In addition to the businesses located on Airport property at St. Louis Lambert International
Airport, there are other businesses located off-airport that support or rely on the aviation
services provided at St. Louis Lambert International Airport to conduct their business activities.
To identify these off-airport aviation-reliant businesses, a 10-mile buffer around the general
property line of the Airport was established wherein the businesses were assessed for their
likelihood to support aviation activity at the Airport, or otherwise rely on the Airport to carry out
their business operations.
A series of North American Industry Classification System codes and industry types were used
to identify businesses related to or potentially reliant on the aviation industry within the study
area using geographic information systems, as listed in Table 4-3. It is important to note that
while all of these NAICS codes were researched in the analysis, there were not off-airport
businesses identified for each code within the study area.
Table 4-3. NAICS Codes Used in Off-Airport Business Assessment
NAICS Title NAICS Code
Examples of Aviation-Related
Elements within the NAICS Code
Airline Offices 561599
All Other Travel Arrangement and
Reservation Services
Airport Parking 812930 Parking Lots and Garages
Freight Forwarding 488150 Freight Transportation Arrangement
Warehousing 493110 General Warehousing and Storage
Warehousing 493120 Refrigerated Warehousing
Electrical Contractors and Other Wiring
Installation Contractors
238210 Airport Runway Lighting Contractors
Search, Detection, and Navigation 334511
Navigational and Guidance Instruments
Manufacturing
Other Electronic Parts and Equipment
Merchant Wholesalers
423690
Electronic Aircraft Instruments
Merchant Wholesalers
Transportation Equipment and Supplies
(Except Motor Vehicle) Merchant
Wholesalers
423860
Aerospace Equipment and Supplies
Merchant Wholesalers
Petroleum and Petroleum Products
Merchant Wholesalers (Except Bulk
Stations and Terminals)
424720
Fuel, Aircraft, Merchant Wholesalers
(Except Bulk Stations, Terminals)
Motorcycle, ATV, and All Other Motor
Vehicle Dealers
441228 Aircraft Dealers

49 | Page
Section 4. Economic Methodology and Modeling // November 2023
NAICS Title NAICS Code
Examples of Aviation-Related
Elements within the NAICS Code
Scheduled Freight Air Transportation 481112 Scheduled Freight Air Transportation
Nonscheduled Chartered Freight Air
Transportation
481212
Nonscheduled Chartered Freight Air
Transportation
All Other Transit and Ground Passenger
Transportation
485999
Airport Limousine Services (i.e.,
Shuttle)
Other Airport Operations 488119 Other Airport Operations/Services
Other Support Activities for Air
Transportation
488190 All Aviation Related
Couriers and Express Delivery Services 492110
Air Courier Services (Except
Establishments Operating Under A
Universal Service Obligation)
Commercial Air, Rail, and Water
Transportation Equipment Rental and
Leasing
532411
Aircraft Rental or Leasing; Airplane
Rental or Leasing
Travel Agencies 561510 Travel Management Services
Flight Training 611512 Flight Simulation Training
Other Technical and Trade Schools 611519 Air Traffic Control Schools
Ambulance Services 621910 Air Ambulance Services
Other Electronic and Precision Equipment
Repair and Maintenance
811219
Navigational Instruments and
Maintenance Services
Reupholstery and Furniture Repair 811420 Aircraft Upholstery Repair
Aircraft Engine and Parts Manufacturing 336412 Aircraft Engine Overhauling
Aircraft Manufacturing 336411 Aircraft Rebuilding
Other Aircraft Parts and Auxiliary
Equipment
336413
Aircraft Propellers and Parts
Manufacturing
Sources: NAICS Association, 2023; Kimley-Horn, 2023
Businesses that were identified with these NAICS codes and within the 10-mile buffer were
reviewed and adjusted to avoid duplicate or inaccurate entries with those identified as on-airport
through previous analysis. To supplement this assessment, other industry reports were provided
by GSL from CoStar and D & B Hoovers to identify businesses that might be aviation-reliant or
aviation-related, and not on the Airport, using a comprehensive list of aviation-related NAICS
and Standard Industrial Classification codes and a targeted key-word search for reports that
didn’t include NAICS or SIC codes. Once the reports were filtered for aviation-related
businesses, an additional review was conducted to remove entries that were duplicative, no
longer valid based on further research, were located on the Airport property (and therefore
already captured as tenants at St. Louis Lambert International Airport), or were businesses
located at other surrounding airports. This analysis resulted in the identification of almost 250
businesses within 10 miles of the Airport that are aviation-reliant or related.

50 | Page
Section 4. Economic Methodology and Modeling // November 2023
4.2.2.2. Commercial Service and GA Visitors
Developing estimates for visitor spending impacts required two separate but similar processes
for commercial service and GA visitor impacts. It is important to note that only “true” visitors are
accounted for in the analysis. A true visitor is one who is visiting from outside of the study region
and therefore bringing new money into the community and is assumed to have left the airport
property to spend money beyond the airport. For these true visitors, the actual spending occurs
after they arrive, but inbound activity was examined to focus on those visitors outside the area.
It is important to note that a connecting passenger from outside the study region (one that is
traveling on an airline that stops at the Airport and “connects” to their final destination) would
likely only spend money at the airport and these expenditures are already included in the tenant
impacts (such as concessionaires) and therefore not double-counted as visitor impacts.
Commercial Service: To model the spending impacts of true visitors departing from St. Louis
via scheduled air service at the Airport, two inputs were required. First was identifying the
number of passengers on inbound flights who are true visitors, and the second was estimating
how much each of those visitors spent during their time in the area. According to the Airline
Data Inc. report that was acquired for this analysis, there were 2,447,564 passengers departing
from the Airport (via domestic and international flights) who were considered true visitors in
2019. To estimate the amount being spent by the average visitor, a review of AEISs from five
peer airports was conducted. The average per commercial visitor spending amount based on
review of peer airports was $692, which was selected for use as the commercial per visitor
spend for the Airport.
GA: To model the spending impacts of GA visitors departing from St. Louis via the Airport, the
same inputs needed for the commercial service analysis were required, which were, identifying
the number of passengers on inbound flights considered true visitors (even though the focus is
on departing passengers, after they spent money), and the second is estimating how much
each of those visitors spent during their time in the area. To identify the number of GA visitors
departing from the area via the Airport, a 2019 dataset was purchased from Flight Aware which
includes information on GA operations, including the aircraft tail number, type, owner, origin,
destination, departure, and arrival time. This information was filtered several times to arrive at
the number of true visitors departing via GA to St. Louis Lambert International Airport:
1. Only departing flights were considered so visitors were not double counted in the
assessment. (Note: visitors arrive, spend money, then depart so we can only look at
either departures or arrivals, not total operations.)
2. Each aircraft type was assigned a seating capacity based on the make and model.
3. A load factor was applied to reflect industry averages for private GA activity.
This resulted in an estimate of 42,024 visitors departing from the area via GA at the Airport in
2019. As mentioned earlier, a review of recently published AEISs from peer airports was
conducted to determine an average spending amount per commercial service visitor. This same
analysis was conducted to determine the average spending amount per visitor departing via GA.
This review identified an average spend per GA visitor of $252, which was selected for use as
the GA per visitor spend for St. Louis Lambert International Airport.

51 | Page
Section 4. Economic Methodology and Modeling // November 2023
4.2.3. Tax Impacts
Included in this analysis is also a presentation of the tax impacts generated from both on- and
off-airport activity, including airport administration, tenants, capital expenditures, aerospace
manufacturing, visitor spending, and off-airport reliant businesses. It is important to note that St.
Louis Lambert International Airport is an Enterprise Fund Department of the City of St. Louis. It
is wholly supported by airport user charges. No general fund revenues are used for the
operation, administration, promotion, or maintenance of airport facilities. Tax impacts were
determined at the city, special district, county, state, and federal level, considering the 15-county
study region. Special districts refer to school districts, fire districts, utility districts, and other. No
data specific to tax impacts were collected from the Airport or other primary sources. Instead,
the data collected related to other activities presented in Sections 4.2.1 and 4.2.2, is used to
estimate tax impacts based on the results determined by IMPLAN. IMPLAN is explained in more
detail in Section 4.3.1. More information regarding the types of taxes included in the tax
analysis is presented in Section 5.3.
4.2.4. Supplier Diversity Program
In addition to the on- and off-airport activity data described in Sections 4.2.1 and 4.2.2, the St.
Louis Lambert International AEIS included economic impact evaluations related to the Airport’s
Supplier Diversity Program in 2019. It is important to note that the impacts of the Supplier
Diversity Program are not in addition to other impacts; instead, the results of this analysis
demonstrate the amount, or percentage, of impact that can be attributed to the Supplier
Diversity Program.
The program is divided into two main categories that make up the diverse business enterprise
activity. Those categories are women’s business enterprises and minority business enterprises,
and expenditures for each category include capital expenditures, professional services, and
service contracts. Annual reports developed by St. Louis Lambert International Airport were
used to identify the amount of and percent of the Airport’s output that is attributable to
businesses within the Supplier Diversity Program. A percentage breakdown of Supplier Diversity
Program award or revenue amounts by industry was also provided by the Airport.
4.3. Economic Modeling Process
As previously noted, the economic impact comprises direct, indirect, and induced impacts.
Determining the indirect and induced impacts of the Airport’s direct economic activity requires
an economic modelling process, as it is not feasible to collect data from primary sources for all
suppliers that support the Airport, nor is it feasible to collect data from every individual being
paid wages that are a result of spending by those employed at St. Louis Lambert International
Airport or providing supplies to businesses and activities at the Airport. IMPLAN, the most
widely used input-output economic model in the United States, was used for the economic
modelling process. IMPLAN is built using data from the Bureau of Economic Analysis, Bureau of
Labor Statistics, U.S. Census, and U.S. Department of Commerce. More information regarding
the use of the IMPLAN model and the industry sectoring process required to determine the
economic impact of the Airport is presented in the following subsections.

52 | Page
Section 4. Economic Methodology and Modeling // November 2023
4.3.1. Use of IMPLAN Model
IMPLAN Version 6.4 was used to calculate the annual economic impact of the Airport in 2019.
The model reflects the current economic measures, such as jobs, payroll, value added, and
business revenues, for 546 industry classifications. These IMPLAN industry classifications
roughly correspond to two- and five-digit industry groups recognized in the NAICS. The IMPLAN
model was built to incorporate indirect and induced effects for the 15-county region that makes
up the St. Louis MSA. The data collected from primary sources is input into the IMPLAN model,
and then the IMPLAN model can be used to complete the following four steps:
1. Fill in data gaps to estimate direct impacts: IMPLAN estimates payroll and business
revenues for the airport administration, tenants, and budget expenditures when only
employment data was provided. IMPLAN was also used to determine employment and
payroll values using visitor spending amounts and total capital expenditure spending. The
payroll, business sales, and expenditures per worker ratios are derived primarily from
county-specific U.S. Department of Commerce and Department of Labor data sets
calibrated in the model. These ratios reflect a measure of productivity (business output per
employee) and income levels based on the number of jobs for each industry on-airport,
including capital expenditures, and in hospitality sectors (for visitor spending). Payroll was
calculated for tenants or contractors using IMPLAN and was calculated based on average
payroll per worker by industry and average of the 15 counties included in the Airport’s
region.
2. Calculate value added: This step is described in more detail in Section 4.1.2.
3. Apply retail margining: While spending on retail reflects the value of an item sold, only a
portion is actual revenue for the retail store. This portion, referred to as margin costs,
reflects the “mark-up” value that retail stores add to the price of goods to cover their
operating costs and profit. Only the mark-up produces revenue and economic activity for
local retailers. Revenue generated by that mark-up supports employee payroll and
operating costs of the business (e.g., rents, utilities, capital, and other expenses), not the
gross revenue collected by the retail business or industry. To isolate the revenues that
accrue to retailers, the margin percentage was applied to the value of all retail goods sold.
It is important to note that, for the purpose of this analysis, retail margining only occurred
for visitor spending impacts and retail tenant impacts, when either the number of
employees or sales revenue data was available. Applying retail margining to visitor
spending impacts and retail tenant impacts allows for a more accurate estimate of the jobs
and payroll estimates, which would be overinflated if output was not adjusted to account
for retail margining.
4. Derive multiplier impacts: IMPLAN’s input/output model traces the flows of money in an
economy of varying sizes by the patterns of industry purchases and sales with other
industries (for indirect impacts) and householding spending (for induced effects). These
patterns help explain how revenues earned in direct transactions have additional impacts
in an economy. At each level, IMPLAN is used to trace the circulation of business

53 | Page
Section 4. Economic Methodology and Modeling // November 2023
revenues to calculate the extent that supplier purchases and income respending support
jobs and payroll for the people in the St. Louis region, additional revenues for businesses,
and additional value added.
Multiplier impacts begin with businesses on-airport or those engaged directly with visitors (i.e.,
hospitality services) that use part of their gross revenues to purchase goods and services from
other businesses. For example, a restaurant serving airport users may buy produce from
farmers, dry goods from wholesalers, office equipment at stores or manufacturers, and pay for
accounting services. To the extent that these purchases stay in the study region, they provide
business revenues to other businesses in the St. Louis region or beyond. These revenues are
then used by businesses in the supply chain in part to hire workers and pay them wages, and to
purchase additional business supplies. Successive rounds of supplier sales occur until the
dollars are expelled out of the region, then the dollars are lost and no longer part of the
multiplier impacts. Similarly, workers at directly affected businesses or those part of the supply
chain of the direct businesses use their wages to purchase goods and services in the St. Louis
MSA. Purchases run the full gamut of consumer spending, ranging from furniture to health care
and groceries, providing business revenues from income re-spending if the dollars used for the
purchases stay in the region.

54 | Page
Section 5. 2019 Airport Economic Contributions and Community Benefits
// November 2023
5. 2019 Airport Economic Contributions and Community
Benefits
This section presents the findings of the annual economic impact of St. Louis Lambert
International Airport based on 2019 information and is considered to reflect current economic
contributions of the Airport given the near return of activity to 2019 levels. The results are
presented by direct, multiplier, and total impacts for on-airport activity, off-airport activity, and
combined or total impacts of both on- and off-airport activity. This section also presents the
findings of the tax impact analysis and presents examples of how area businesses rely on the
Airport, demonstrating the social value of the Airport to the region. Beyond the economic
contributions, the community benefits of the Airport to three specific businesses in the region
are outlined. These businesses offered their input on the importance of the Airport to their
operation, including how they utilize and rely upon the Airport.
5.1. 2019 On-Airport Impacts
As presented in Section 4.2.1 on-airport impacts are generated by the economic activity
occurring at St. Louis Lambert International Airport, such as airport-sponsored employment;
tenant employment, including airlines, FBOs, concessionaires, and other on-airport businesses;
and capital expenditures incurred by the Airport or tenants. In addition, while presented
separately, on-airport impacts also include the aerospace manufacturing industry that is present
onsite at the Airport.
5.1.1. 2019 On-Airport Direct Impacts
In 2019, the Airport employed just under 500 individuals that are responsible for maintaining
operations and supporting other business activities occurring at the Airport, resulting in
approximately $39.1 million in payroll. Outside of the Airport-sponsored employment, the Airport
also supports over 250 additional jobs due to the services they contract out, such as for
mechanical services, janitorial services, maintenance needs, and other professional services.
Beyond Airport staff and contract employment, the Airport has more than 300 tenants, from
airlines to FBOs, and concessionaires to manufacturers. These tenants contribute more than
6,250 employees at St. Louis Lambert International Airport, generating approximately $405.0
million in payroll. It is important to note that the impacts of airport tenants also include their
capital expenditure impacts. Moreover, the on-airport construction projects, also referred to as
capital expenditures, conducted by the Airport generated an additional 166 jobs.
As shown in Table 5-1, the combined direct impacts of St. Louis Lambert International Airport
employment, contract services, tenant employment and construction, and on-airport
construction employment resulted in a total of 7,160 jobs, which generated approximately
$466.3 million in payroll. These activities also generated $943.7 million in value-added impacts
and nearly $1.7 billion in business revenues. Additional direct impacts generated from the on-
airport aerospace manufacturing industry resulted in over 16,800 additional jobs, generating
approximately $2.7 billion in payroll. When combined, activity from St. Louis Lambert
International Airport and tenant employment, on-airport construction, and aerospace

55 | Page
Section 5. 2019 Airport Economic Contributions and Community Benefits
// November 2023
manufacturing results in nearly 24,000 direct jobs and approximately $3.2 billion in
payroll. In 2019 these combined on-airport activities contributed nearly $3.2 billion of
value added to the region’s GRP and generated $14.9 billion in business revenues.
Table 5-1. 2019 On-Airport Direct Impacts
Category Jobs Payroll Value Added
Business
Revenues
Airport Administration 741 $50,363,000 $85,850,000 $170,700,000
Airport Employees 487 $39,064,000 $71,835,000 $144,194,000
Airport Contracted Services 254 $11,299,000 $14,015,000 $26,506,000
Airport Tenants* 6,254 $405,024,000 $845,434,000 $1,483,838,000
Airport Capital Expenditures 166 $10,901,000 $12,437,000 $25,190,000
Subtotal Direct On-Airport 7,160 $466,288,000 $943,721,000 $1,679,728,000
Aerospace Manufacturing** 16,803 $2,722,682,000 $2,239,067,000 $13,234,609,000
2019 Total On-Airport Direct
Impacts
23,964 $3,188,970,000 $3,182,788,000 $14,914,337,000
Notes: *Employment and capital expenditure impacts exclude the major on-airport aerospace firms. **Impacts generated from the
major on-airport aerospace firms. Totals may not sum due to rounding. Dollar values were rounded to the nearest thousand. Dollars
are presented in 2019 dollars. Sources: IMPLAN V6.4, 2023; St. Louis Lambert International Airport, 2019; Kimley-Horn, 2023.
5.1.2. 2019 On-Airport Multiplier Impacts
Multiplier impacts are generated because of the distribution and recirculation of direct impacts
from the on-airport activity presented in Section 5.1.1. The 2019 indirect and induced impacts
(multiplier impacts) of on-airport activity are presented in Table 5-2. The induced impacts are
higher than the indirect impacts across all on-airport categories. Activities related to airport
administration, airport tenants, and airport capital expenditures generated over 4,000 jobs from
indirect impacts and more than 4,400 jobs from induced impacts, totaling almost 8,500 jobs from
multiplier impacts. These jobs supported approximately $490.3 million in payroll and
approximately $1.6 billion in business revenues, which added $848.1 million in value to the
GRP. The multiplier impacts of the aerospace manufacturing activity occurring on-airport
supported over 36,500 jobs and approximately $2.3 billion in payroll. When all the on-airport
activity is considered, including aerospace manufacturing, there are more than 45,000
jobs that are attributable to the multiplier impacts of activity occurring at the Airport,
which corresponds with $2.8 billion in payroll, $4.6 billion in value added, and almost
$8.4 billion in business revenues.

56 | Page
Section 5. 2019 Airport Economic Contributions and Community Benefits
// November 2023
Table 5-2. 2019 On-Airport Multiplier Impacts
Category Impact Jobs Payroll Value Added
Business
Revenues
Airport Administration
Indirect 358 $25,977,000 $55,752,000 $105,761,000
Induced 413 $24,844,000 $65,977,000 $114,421,000
Airport Employees
Indirect 283 $21,323,000 $48,603,000 $93,245,000
Induced 314 $19,643,000 $56,460,000 $97,923,000
Airport Contracted
Services
Indirect 75 $4,654,000 $7,018,000 $12,576,000
Induced 100 $5,201,000 $9,153,000 $15,874,000
Airport Tenants*
Indirect 3,644 $225,751,000 $350,424,000 $682,773,000
Induced 3,933 $205,536,000 $361,767,000 $627,384,000
Airport Capital
Expenditures
Indirect 53 $3,505,000 $5,925,000 $11,335,000
Induced 90 $4,715,000 $8,286,000 $14,362,000
Subtotal On-Airport
Indirect Impacts
N/A 4,055 $255,233,000 $412,101,000 $799,869,000
Subtotal On-Airport
Induced Impacts
N/A 4,437 $235,095,000 $436,030,000 $756,167,000
Subtotal On-Airport
Multiplier Impacts
N/A 8,492 $490,328,000 $848,131,000 $1,556,036,000
Aerospace
Manufacturing**
Indirect 12,908 $1,077,851,000 $1,580,892,000 $3,048,919,000
Induced 23,657 $1,235,914,000 $2,176,511,000 $3,774,631,000
Total On-Airport
Indirect Impacts
N/A 16,963 $1,333,084,000 $1,992,993,000 $3,848,788,000
Total On-Airport
Induced Impacts
N/A 28,094 $1,471,009,000 $2,612,541,000 $4,530,798,000
2019 Total On-Airport
Multiplier Impacts
N/A 45,057 $2,804,093,000 $4,605,534,000 $8,379,586,000
Notes: *Employment and capital expenditure impacts exclude the major on-airport aerospace firms. **Impacts generated from the
major on-airport aerospace firms. Totals may not sum due to rounding. Dollar values were rounded to the nearest thousand. Dollars
are presented in 2019 dollars. Sources: IMPLAN V6.4, 2023; Kimley-Horn, 2023.
5.1.3. 2019 Total On-Airport Activity Impacts
The total economic impact of St. Louis Lambert International Airport’s on-airport activity is a sum
of the direct and multiplier impacts previously presented. Table 5-3 presents the total 2019
impacts of on-airport activity at the Airport by category. More than 15,600 jobs are attributable to
airport administration, airport tenants, and airport capital expenditures, generating almost $1.0
billion in payroll. As shown, there are more than 69,000 jobs attributable to the direct and
multiplier impacts of all on-airport activity, including the aerospace manufacturing
activity at the Airport. When the aerospace manufacturing activity is included, on-airport
activity supports approximately $6.0 billion in payroll, generating approximately $23.3

57 | Page
Section 5. 2019 Airport Economic Contributions and Community Benefits
// November 2023
billion in business revenues, which resulted in approximately $7.8 billion in value added
to the GRP.
Table 5-3. 2019 On-Airport Total Impacts
Category Jobs Payroll Value Added
Business
Revenues
Airport Administration 1,512 $101,184,000 $207,578,000 $390,882,000
Airport Employees 1,083 $80,030,000 $177,392,000 $335,926,000
Airport Contracted Services 428 $21,154,000 $30,186,000 $54,956,000
Airport Tenants* 13,831 $836,310,000 $1,557,626,000 $2,793,995,000
Airport Capital Expenditures 309 $19,121,000 $26,647,000 $50,887,000
Subtotal On-Airport 15,652 $956,615,000 $1,791,851,000 $3,235,764,000
Aerospace Manufacturing** 53,368 $5,036,447,000 $5,996,471,000 $20,058,159,000
2019 Total On-Airport Impacts 69,021 $5,993,062,000 $7,788,322,000 $23,293,923,000
Notes: *Employment and capital expenditure impacts exclude the major on-airport aerospace firms. **Impacts generated from the
major on-airport aerospace firms. Totals may not sum due to rounding. Dollar values were rounded to the nearest thousand. Dollars
are presented in 2019 dollars. Sources: IMPLAN V6.4, 2023; St. Louis Lambert International Airport, 2019; Kimley-Horn, 2023.
5.2. 2019 Off-Airport Impacts
As presented in Section 4.2.2, off-airport impacts include economic activity associated with
businesses that are aviation-reliant located away from the Airport as well as activity from visitors
travelling from out of the area into St. Louis Lambert International Airport and spending money
in the community. These visitors may travel via GA or commercial service. The follow
subsections present the 2019 direct, multiplier, and total impacts associated with these activity
categories, which are presented both separately and combined.
5.2.1. 2019 Off-Airport Direct Impacts
5.2.1.1. Aviation-Reliant Businesses
The 247 businesses identified in the St. Louis metropolitan region that rely on the Airport or
support its activities employ approximately 3,500 people, which generate approximately $227.1
million in payroll, as shown in Table 5-4. The business revenues generated from the off-
airport aviation-reliant businesses is slightly less than $759.0 million, contributing
approximately $273.6 million in value added to the region’s GRP.

58 | Page
Section 5. 2019 Airport Economic Contributions and Community Benefits
// November 2023
Table 5-4. 2019 Off-Airport Aviation-Reliant Businesses Direct Impacts
Category Jobs Payroll Value Added
Business
Revenues
Total Aviation-Reliant
Businesses Direct Impacts
3,518 $227,073,000 $273,623,000 $758,852,000
Notes: Dollar values were rounded to the nearest thousand. Dollars are presented in 2019 dollars. Sources: IMPLAN V6.4, 2023;
NAICS Association, 2023; CoStar, 2023; D&B Hoovers, 2023; ESRI Business Analyst, 2023; Kimley-Horn, 2023
5.2.1.2. Commercial Service and GA Visitors
As shown in Table 5-5, the nearly 2.5 million commercial service visitors and 42,000 GA visitors
supported just over 18,000 and 110 jobs, respectively. The jobs associated with the commercial
service visitors generated approximately $537.9 million in payroll, $793.9 million in value added, and
almost $1.4 billion in business revenues. The jobs associated with GA visitors generated
approximately $3.4 million in payroll, almost $5.0 million in value added, and $8.6 million in business
revenues. When combined, the total direct visitor spending impacts generated slightly less
than $1.4 billion in business revenues for the St. Louis metropolitan region, which is
associated with over 18,100 jobs, $541.2 million in payroll, and $798.9 million in value-added
benefits.
Table 5-5. 2019 Off-Airport Visitor Spending Direct Impacts
Category Jobs Payroll Value Added
Business
Revenues
Commercial Service 18,001 $537,854,000 $793,908,000 $1,376,990,000
GA 113 $3,363,000 $4,964,000 $8,610,000
2019 Total Visitor Spending
Direct Impacts
18,114 $541,217,000 $798,872,000 $1,385,600,000
Notes: Totals may not sum due to rounding. Dollar values were rounded to the nearest thousand. Dollars are presented in 2019
dollars. Sources: IMPLAN V6.4, 2023; Airline Data Inc, 2019; Flight Aware, 2019; Kimley-Horn, 2023
5.2.2. 2019 Off-Airport Multiplier Impacts
5.2.2.1. Aviation-Reliant Businesses
As shown in Table 5-6, the indirect impacts of the off-airport aviation-reliant businesses contribute
nearly 1,600 jobs to the St. Louis metropolitan region, which is slightly less than the induced impacts of
this off-airport activity, which generated nearly 2,100 jobs. When combined, the multiplier impacts
of aviation-reliant businesses support over 3,600 jobs and approximately $212.0 million in
payroll. The multiplier impacts of these aviation-reliant businesses also produced almost
$626.5 million in business revenues, which corresponds with approximately $346.5 million in
value added to the GRP.

59 | Page
Section 5. 2019 Airport Economic Contributions and Community Benefits
// November 2023
Table 5-6. 2019 Off-Airport Aviation-Reliant Businesses Multiplier Impacts
Category Impact Jobs Payroll Value Added
Business
Revenues
Aviation-Reliant Businesses
Indirect 1,569 $104,106,000 $156,691,000 $297,243,000
Induced 2,064 $107,841,000 $189,848,000 $329,244,000
2019 Total Aviation Reliant
Businesses Multiplier
Impacts
N/A 3,633 $211,947,000 $346,539,000 $626,487,000
Notes: Totals may not sum due to rounding. Dollar values were rounded to the nearest thousand. Dollars are presented in 2019
dollars. Sources: IMPLAN V6.4, 2023; NAICS Association, 2023; CoStar, 2023; D&B Hoovers, 2023; ESRI Business Analyst, 2023;
Kimley-Horn, 2023
5.2.2.2. Commercial Service and GA Visitors
Table 5-7 presents the induced, indirect, and combined multiplier impacts related to commercial
service and GA visitor spending. Given that more visitors travel to St. Louis via scheduled air
service, the indirect and induced impacts of commercial service visitor spending is higher than
the indirect and induced impacts of GA visitor spending. When combined, the multiplier
impacts of visitors travelling into the Airport via commercial service or GA result in more
than 8,500 jobs, which generated $477.8 million in payroll. The visitor spending multiplier
impacts contributed $795.6 million in value-added benefits, resulting in business
revenues of approximately $1.4 billion.
Table 5-7. 2019 Off-Airport Visitor Spending Multiplier Impacts
Category Impact Jobs Payroll Value Added
Business
Revenues
Commercial Service
Indirect 3,792 $226,090,000 $352,371,000 $672,885,000
Induced 4,684 $248,702,000 $438,232,000 $757,789,000
GA
Indirect 24 $1,414,000 $2,203,000 $4,207,000
Induced 29 $1,555,000 $2,740,000 $4,738,000
Total Visitor Spending
Indirect Impacts
N/A 3,816 $227,504,000 $354,574,000 $677,092,000
Total Visitor Spending
Induced Impacts
N/A 4,713 $250,257,000 $440,972,000 $762,527,000
2019 Total Visitor
Spending Multiplier
Impacts
N/A 8,529 $477,761,000 $795,546,000 $1,439,619,000
Notes: Totals may not sum due to rounding. Dollar values were rounded to the nearest thousand. Dollars are presented in 2019
dollars. Sources: IMPLAN V6.4, 2023; Airline Data Inc, 2019; Flight Aware, 2019; Kimley-Horn, 2023
5.2.3. 2019 Total Off-Airport Impacts
The combined direct and multiplier impacts of off-airport activity, including aviation-
reliant businesses as well as commercial service and GA visitors, generated nearly

60 | Page
Section 5. 2019 Airport Economic Contributions and Community Benefits
// November 2023
33,800 jobs, with over 26,600 jobs attributable to visitor spending and approximately 7,200 jobs
attributable to aviation-reliant businesses (see Table 5-8). Approximately $4.2 billion in
business revenues were generated from these off-airport impacts, which is also
associated with $2.2 billion in value added and approximately $1.5 billion in payroll.
Table 5-8. 2019 Off-Airport Total Impacts
Category Jobs Payroll Value Added
Business
Revenues
Aviation-Reliant Businesses 7,151 $439,021,000 $620,162,000 $1,385,339,000
Commercial Service and GA
Visitors
26,643 $1,018,978,000 $1,594,418,000 $2,825,218,000
Commercial Service Visitors 26,477 $1,012,646,000 $1,584,511,000 $2,807,663,000
GA Visitors 166 $6,332,000 $9,907,000 $17,555,000
2019 Off-Airport Total Impacts 33,794 $1,457,999,000 $2,214,580,000 $4,210,557,000
Notes: Totals may not sum due to rounding. Dollar values were rounded to the nearest thousand. Dollars are presented in 2019
dollars. Sources: IMPLAN V6.4, 2023; Airline Data Inc, 2019; Flight Aware, 2019; NAICS Association, 2023; CoStar, 2023; D&B
Hoovers, 2023; ESRI Business Analyst, 2023; Kimley-Horn, 2023
5.3. 2019 Total Airport Impacts
The total impacts of St. Louis Lambert International Airport are the culmination of the on-airport
and off-airport activity, including the direct, indirect, and induced impacts which were presented
throughout Sections 5.1 and 5.2. As shown in Table 5-9, the total 2019 direct impacts of on-
and off-airport activity contributed almost 45,600 jobs, and the multiplier impacts contributed
more than 57,200 jobs, which results in a total impact of approximately 102,800 jobs. The total
direct impacts of on- and off-airport impacts generated a higher payroll and business revenues
than the multiplier impacts of on- and off-airport impacts. When the 2019 direct and multiplier
impacts are combined, more than 102,800 jobs from on- and off-airport impacts
generated approximately $7.5 billion in payroll, and $27.5 billion in business revenues,
contributing $10.0 billion in value added to the region’s economy, annually as of 2019.
Table 5-9. 2019 St. Louis Lambert International Airport Total Airport Impacts
Category Jobs Payroll Value Added
Business
Revenues
Total Direct Impacts 45,596 $3,957,260,000 $4,255,283,000 $17,058,789,000
Total Multiplier Impacts 57,219 $3,493,801,000 $5,747,619,000 $10,445,692,000
Total Indirect Impacts 22,348 $1,664,694,000 $2,504,258,000 $4,823,123,000
Total Induced Impacts 34,871 $1,829,107,000 $3,243,361,000 $5,622,569,000
2019 Total Airport Impacts 102,815 $7,451,061,000 $10,002,902,000 $27,504,480,000
Notes: Totals may not sum due to rounding. Dollar values were rounded to the nearest thousand. Dollars are presented in 2019
dollars. Sources: IMPLAN V6.4, 2023; St. Louis Lambert International Airport, 2019; Airline Data Inc, 2019; Flight Aware, 2019;
NAICS Association, 2023; CoStar, 2023; D&B Hoovers, 2023; ESRI Business Analyst, 2023; Kimley-Horn, 2023

61 | Page
Section 5. 2019 Airport Economic Contributions and Community Benefits
// November 2023
As shown in Table 5-10, almost 42,300 jobs will be supported by total airport impacts,
alone, which results in approximately $2.0 billion in total payroll. Activity associated with
airport impacts added approximately $3.4 billion in value to the GRP, resulting in
approximately $6.1 billion in total business revenues. Included within the category of
“airport impacts” is future airport administration, airport tenants, airport capital expenditures, and
visitor spending impacts. The aerospace manufacturing activity supported almost 53,400 total
jobs, which corresponds with approximately $5.0 billion in payroll, $6.0 billion in value added,
and almost $20.1 billion in business revenues. The impact of off-airport aviation-reliant business
activity resulted in 7,151 jobs added to the St. Louis region, generating $439.0 million in payroll,
and adding approximately $620.2 million in value to the GRP, which generated almost $1.4
billion in business revenues.
Table 5-10. 2019 St. Louis Lambert International Airport Total Impacts by Activty
Type
Activity Jobs Payroll Value Added Business Revenues
Airport Impacts* 42,295 $1,975,593,000 $3,386,269,000 $6,060,982,000
Aerospace Manufacturing 53,368 $5,036,447,000 $5,996,471,000 $20,058,159,000
Aviation-Reliant Businesses 7,151 $439,021,000 $620,162,000 $1,385,339,000
Total
102,815 $7,451,061,000 $10,002,902,000 $27,504,480,000
Notes: *Includes airport administration, airport tenants, airport capital expenditures, and visitor spending impacts. Totals may not
sum due to rounding. Dollar values were rounded to the nearest thousand. Dollars are presented in 2019 dollars. Sources: IMPLAN
V6.4, 2023; St. Louis Lambert International Airport, 2019; Airline Data Inc, 2019; Flight Aware, 2019; NAICS Association, 2023;
CoStar, 2023; D&B Hoovers, 2023; ESRI Business Analyst, 2023; Kimley-Horn, 2023
It is important to note that this AEIS, which presents the economic impact of the Airport based
on 2019 data is the first major update since the previous 2013 AEIS for the Airport. The 2013
study was conducted by another consulting firm and was prepared for the St. Louis Airport
Authority. When considering the airport impacts
26
only, the results of the 2019 study indicates
that total payroll has increased by approximately 100% (approximately $1 billion to $2 billion)
since 2013. The number of jobs that the airport supports has increased by 69% since 2013
(25,000 jobs to 42,295 jobs), according to the results of this current 2019 study. Overall, the
economic impact of the Airport, based on the airport impacts only, is 68% more than the total
impact reported in 2013 (approximately $3.6 billion to $6.1 billion). The impacts of aerospace
manufacturing and aviation-reliant businesses was not included, or accounted for differently, in
the 2013 study and is therefore not included in this comparison between the 2013 and 2019
results.
27
26
Airport impacts include the economic contributions made by airport administration, airport capital
expenditures, tenant employment and tenant capital expenditures, and visitor spending. These impacts
do not include contributions made by the on-airport aerospace manufacturing industry or the off-airport
aviation reliant businesses.
27
The 2013 impacts remained in 2013 dollars for the comparison with 2019 impacts.

62 | Page
Section 5. 2019 Airport Economic Contributions and Community Benefits
// November 2023
5.4. Supplier Diversity Program Impacts
As mentioned in Section 4.2.4, the Supplier Diversity Program creates opportunities for WBE
and MBE firms, which are both considered under the broader DBE umbrella. St. Louis Lambert
International Airport awards contracts to WBE and MBE businesses related to capital
expenditures, professional services, and service contracts. As such, the impacts of the Supplier
Diversity Program are nested within the airport administration and capital expenditures
activities. As a note, the professional services and service contracts expenditures are
associated specifically with the airport contracted services component of the overall airport
administration impacts. It is important to reiterate that the impacts of the Supplier Diversity
Program are not in addition to the impacts presented in Table 5-9, but rather are included as a
part of the Airport’s total impact, including the direct, indirect, and induced impacts.
Table 5-11 provides a breakdown of the total number of jobs, as well as payroll, value added,
and business revenues associated with the professional services and service contracts of the
WBE and MBE programs. As shown, of the Airport’s total airport contracted services impacts
(including direct, indirect, and induced impacts), nearly 70 jobs, $3.3 million in payroll, and $8.6
million in business revenues are attributable to WBE and MBE firms that participate in the 2019
Supplier Diversity Program.
Table 5-11. 2019 Airport Contracted Services Impacts Attributable to the Airport’s
Supplier Diversity Program
Service Type Program Jobs Payroll
Value
Added
Business
Revenues
Professional Services
WBE 4 $194,000 $277,000 $504,000
MBE 28 $1,400,000 $1,998,000 $3,637,000
WBE & MBE 32 $1,594,000 $2,275,000 $4,141,000
Contract Services
WBE 8 $414,000 $591,000 $1,075,000
MBE 26 $1,304,000 $1,861,000 $3,388,000
WBE & MBE 35 $1,718,000 $2,452,000 $4,463,000
Total for Professional
and Contract
Services
Total WBE 12 $608,000 $868,000 $1,579,000
Total MBE 55 $2,704,000 $3,859,000 $7,025,000
Total WBE &
MBE
67 $3,312,000 $4,727,000 $8,604,000
Notes: Totals may not sum due to rounding. Dollar values were rounded to the nearest thousand. Dollars are presented in 2019
dollars. Sources: St. Louis Lambert International Airport, 2019; Kimley-Horn, 2023.
As shown in Figure 5-1, the WBE and MBE firms on contract for professional services and
contract services account for 16% of the total business revenues associated with St. Louis
Lambert International Airport’s airport contracted services. WBE contracts account for 3% and
MBE contracts account for 13% of the total airport contracted services impacts. As a note, the
results of Figure 5-1 consider the direct, indirect, and induced impacts of airport contracted
services.

63 | Page
Section 5. 2019 Airport Economic Contributions and Community Benefits
// November 2023
Figure 5-1. 2019 MBE and WBE Contributions to Total Airport Contract Service
Impacts
Sources: St. Louis Lambert International Airport, 2019; Kimley-Horn, 2023.
The impact attributable to the WBE and MBE firms participating in the 2019 Supplier Diversity
Program specific to capital expenditures or construction is shown in Table 5-12. As shown,
approximately 120 of the total jobs associated with St. Louis Lambert International Airport’s
capital expenditure impacts are attributable to the Supplier Diversity Program. Approximately
$19.2 million in total business revenues of the airport capital expenditures impacts are
attributable to the WBE and MBE firms that participated in the 2019 Supplier Diversity Program.
It is important to note that the impacts presented in Table 5-12 account for WBE and MBE
share of direct, indicted, and induced impacts of airport capital expenditures.
Table 5-12. 2019 Airport Capital Expenditure Impacts Attributable to the Airport’s
Supplier Diversity Program
Service Type Program Jobs Payroll Value Added
Business
Revenues
Capital Expenditures
WBE 29 $1,783,000 $2,485,000 $4,746,000
MBE 88 $5,419,000 $7,552,000 $14,422,000
WBE & MBE 117 $7,202,000 $10,037,000 $19,168,000
Notes: Totals may not sum due to rounding. Dollar values were rounded to the nearest thousand. Dollars are presented in 2019
dollars.
Sources: St. Louis Lambert International Airport, 2019; Kimley-Horn, 2023.
84%
3%
13%
Non-Supplier Diversity Program Contrbutions to Total Airport Contract Services
WBE Contribution to Total Airport Contract Services
MBE Contribution to Total Airport Contract Services

64 | Page
Section 5. 2019 Airport Economic Contributions and Community Benefits
// November 2023
As shown in Figure 5-2, 37% of the Airport’s total airport capital expenditure impacts are
attributable to the Supplier Diversity Program. WBE firms account for 9% and MBE firms
account for 28% of the total impacts associated with on-airport construction. The results
presented in Figure 5-2 account for the direct, indirect, and induced airport capital expenditure
impacts.
Figure 5-2. 2019 MBE and DBE Contributions to Total Airport Capital Expenditure
Impacts
Sources: St. Louis Lambert International Airport, 2019; Kimley-Horn, 2023.
5.5. 2019 Tax Impacts
In addition to the 2019 on- and off-airport impacts presented in Sections 5.1, 5.2, and 5.3,
activity occurring on- and off-airport also generates tax revenues for all levels of government,
from the local level, which includes city, special districts and county, as well as at the statewide,
and federal level. The county tax impacts are inclusive of the 15-county study region and the
state taxes include impacts of the jurisdictions within Missouri and Illinois that are included in the
study region. Special districts include school, fire, and other such districts specific to the region,
although not identified separately in the analysis.
Tax revenues are generated from all the activities that created the impacts presented in Section
4.2.1 and 4.2.2, including airport administration, airport tenants, airport capital improvements,
aerospace manufacturing, off-airport reliant businesses, and visitor spending. The taxes
presented in Table 5-13 and Table 5-14 include taxes paid through employee compensation,
taxes on production and imports, other property income, and personal taxes. The tax impacts
63%
9%
28%
Non-Supplier Diversity Program Contrbutions to Total Airport Capital Expenditures
WBE Contribution to Total Airport Capital Expenditures
MBE Contribution to Total Airport Capital Expenditures

65 | Page
Section 5. 2019 Airport Economic Contributions and Community Benefits
// November 2023
presented in Table 5-13 and Table 5-14 are considerably higher than the tax impacts presented
in the previous 2013 AEIS developed for the Airport due to the type of taxes included in the
previous analysis, which only included sales tax and earnings tax. It is important to emphasize
that while the Airport is in the City of St. Louis, the taxes generated from its activity go far
beyond the boundaries of the city, and support public expenses at the city, special district,
county, state, and federal level. The City of St. Louis has a unique city earnings tax, which taxes
individuals who work within the City of St. Louis, including those that do not live within the city
boundaries. The revenues generated from the city earnings tax is included within the city tax
impacts presented in Table 5-13 and Table 5-14. It is important to note that different taxes are
levied at different levels of government and each level may or may not collect taxes within the
study region.
The tax impacts presented in Table 5-13 demonstrate tax revenues generated from the direct
impacts associated with employment and business activity associated with the on- and off-
airport activity included in this analysis. As shown, the airport impact category, which includes
the impacts of the airport administration, tenant activity (excluding aerospace manufacturing),
capital expenditures, and visitor spending generated a total of $483.9 million in tax revenues
across all jurisdictions. When combined, all direct airport activity generated approximately
$237.7 million in local tax revenues. Approximately $212.2 million and $762.9 million in tax
revenues were generated at the state and federal level.
Included within the state tax impacts is the tax revenue generated from the sale of jet fuel. The
State of Missouri applies a sales tax on the sale of jet fuel, as opposed to an excise tax. In 2019
alone, the State of Missouri paid approximately $6.8 million towards jet fuel taxes and jet fuel
sales at the Airport accounted for approximately 60% of that, which is approximately $4.1
million. More than $1.2 billion in tax revenue was generated in 2019 from direct on- and
off-airport activity, when considering all levels of taxation.
Table 5-13. 2019 Tax Revenues Generated from Direct On- and Off-Airport Activity
Activity Local State Federal Total
Airport Impacts* $156,529,000 $109,637,000 $217,686,000 $483,851,000
Aerospace Manufacturing $71,657,000 $92,482,000 $501,077,000 $665,216,000
Aviation- Reliant Businesses $9,524,000 $10,113,000 $44,105,000 $63,743,000
2019 Direct Tax Revenues $237,710,000 $212,232,000 $762,868,000 $1,212,810,000
Notes: *Includes airport administration, airport tenants, airport capital expenditures, and visitor spending impacts. Totals may not sum
due to rounding. Dollar values were rounded to the nearest thousand. Dollars are presented in 2019 dollars. Sources: IMPLAN V6.4,
2023; Kimley-Horn, 2023.
Table 5-14. Tax Revenues Generated from Total On- and Off-Airport Activity provides an
overview of the total tax revenue impacts related to on- and off-airport activity, which is inclusive
of direct, indirect, and induced impacts. When the multiplier impacts (indirect and induced
impacts) are considered, the tax revenue impacts are approximately doubled across each
activity and taxation level. Federal taxes have the highest tax revenue impacts from on- and off-
airport activity, at almost $1.5 billion. Tax revenues generated at the local level amount to

66 | Page
Section 5. 2019 Airport Economic Contributions and Community Benefits
// November 2023
approximately $487.7 million. Approximately $431.8 million in tax revenues were generated
at the state level. Approximately $2.4 billion in tax revenues were generated from total
on- and off-airport activity in 2019, which includes direct, indirect, and induced impacts.
Table 5-14. Tax Revenues Generated from Total On- and Off-Airport Activity
Total Impacts Local State Federal Total
Airport Impacts* $232,074,000 $173,927,000 $418,222,000 $824,222,000
Aerospace Manufacturing $231,144,000 $234,634,000 $980,107,000 $1,445,886,000
Aviation-Reliant Businesses $24,455,000 $23,322,000 $88,078,000 $135,855,000
2019 Total Tax Revenues
$487,673,000
$431,883,000 $1,486,407,000 $2,405,963,000
Notes: Impacts presented in Table 5-14 include direct, indirect, and induced impacts. **Includes airport administration, airport
tenants, airport capital expenditures, and visitor spending impacts. Totals may not sum due to rounding. Dollar values were rounded
to the nearest thousand. Dollars are presented in 2019 dollars. Sources: IMPLAN V6.4, 2023; Kimley-Horn, 2023.
5.6. Community Benefits
The impacts presented in this section are only one part of the story demonstrating the immense
value that St. Louis Lambert International Airport provides to the surrounding region because
behind those numbers are real people, working across many industries in the region, to provide
goods and services to the MSA. the Airport is a tremendous economic generator, supporting
jobs on and off the Airport, generating payroll, and contributing to the GRP. Moreover, the
Airport is a vital component of the region’s transportation system as it supports the movement of
goods and services and provides transportation opportunities for business and recreational
purposes.
Businesses from all over the country and the world rely on services provided by the Airport,
which is showcased in the business profiles of Bayer, Boeing, and Bunge presented in the
following subsections. These business profiles offer three examples of how the Airport is
supporting global companies that have headquarters in the St. Louis MSA. These examples
represent a few of many stories that could be shared about the way area businesses rely on the
Airport to successfully perform their business operations. Without the Airport, area businesses
would face many challenges related to longer wait times for goods or supplies and longer travel
days due to the loss of critical air service.
5.6.1. Bayer
Bayer is a multinational pharmaceutical and biotechnology company that is a world pioneer in
plant biotechnology and genomics. Bayer is a multifaceted firm, and the combined agriculture
business will have its global Seeds & Traits and North American commercial headquarters in St.
Louis, Missouri. Bayer employs nearly 6,000 people in the St. Louis area across multiple
functions including their Crop Science Division and corporate administration, including finance,
information technology, and communications. Worldwide, the company employs approximately
100,000 people, of which 40% (or 40,000) are in the Crop Science Division. This Division has
primary locations in St. Louis and in Monheim, Germany. The Bayer Crop Science Division
headquarters in St. Louis is responsible for the company’s North American business, which
represents approximately 40% of Bayer’s worldwide business. The St. Louis facility boasts the

67 | Page
Section 5. 2019 Airport Economic Contributions and Community Benefits
// November 2023
largest research site within the company’s entire network, accounting for 1,500 research and
development employees out of the company’s total 7,000 R&D employees. Bayer Crop Science
has major AgTech research & development operations in Greater St. Louis, investing $2 billion
annually.
Due to the global nature of Bayer’s Crop Science operation, approximately one-third of the St.
Louis staff (2,000) need to travel frequently for business—often to Germany. When asked about
Bayer’s relationship with the Airport, Bayer representatives said, “We are highly reliant on St.
Louis Lambert International Airport to provide both domestic and international service to get our
staff to major markets with thousands of our team members traveling through St. Louis every
year.”
Employees rely on both domestic and international air service provided by the Airport to reach
clients, other Bayer locations, and to bring vendors and clients to their St. Louis headquarters.
The need for efficient connections between St. Louis and Germany is so important that Bayer
financially supports the nonstop Lufthansa Airlines service to Frankfurt, Germany, in order to
meet the firm’s international travel needs. Recent demand spurred a request from Bayer to
increase existing nonstop service on Lufthansa from three to five days a week. Although some
challenges have prevented the increase in service frequency so far, the financial support of the
Lufthansa service offered at the Airport demonstrates how valuable it is to Bayer operations.
The Germany service frequently reduces travel duration by eliminating connections.
Outside of the Lufthansa service, Bayer also relies on other scheduled air service at the Airport
to access important markets in other parts of North America, South America, Africa, and
Europe. Looking to the future, Bayer is interested in nonstop scheduled service to São Paulo,
Brazil to reach their South American markets. In addition to using commercial service, some
Bayer employees travel via GA when staff need to reach areas without adequate commercial
service options. This minimizes the time needed away from headquarters and eliminates
unnecessary overnight stays.
Bayer’s reliance on the Airport will continue as the region’s economy grows and diversifies, and
their presence expands. The company relies on St. Louis Lambert International Airport to help
promote a well-connected urban environment that offers efficient scheduled air service and a
thriving community. This positions Bayer to recruit and acquire talent from all over the globe
who are willing to locate in St. Louis, knowing they can access air service to reach a variety of
locations to visit family, take vacations, and more. Bayer, along with the broader agriculture
industry in the region including corn and soybean commodity groups and the growing AgTech
industry, greatly depend on the air service offered at the Airport to thrive in their markets and be
resilient in the years to come.
5.6.2. Boeing
The Boeing Company is a U.S.-based multinational corporation that is involved in all aspects of
aerospace, including the manufacturing, designing, and selling of all types of aircraft, from fixed
wing to rotorcraft, and rockets to satellites. Boeing has approximately 16,000 employees in the
St. Louis region, and approximately half of them are engineers. It was reported that in 2022, an

68 | Page
Section 5. 2019 Airport Economic Contributions and Community Benefits
// November 2023
additional 900 jobs were added at the St. Louis location, with estimates indicating an additional
10,000 new employees will be added to the company, firmwide, in the next year.
28
The St. Louis Boeing location is co-located at the Airport. Boeing’s St. Louis location primarily
supports the production of the Boeing F/A-18E/F Super Hornet for the U.S. Navy, which is a
twin-engine, fighter aircraft that can operate from an aircraft carrier. Boeing also supports the
production of the Boeing F-15EX, which is an all-weather, multirole strike fighter produced for
the U.S. Air Force.
Boeing employs a variety of staff to support the production of aircraft. The staff positions at the
St. Louis location are aviation-related and include designers, sheet metal employees, engineers,
and administrative staff; only a small handful of staff, including the aircraft arresting system
specialists, require airside access. The Boeing facility in St. Charles primarily specializes in
weapons and missile production.
The economic impacts of Boeing are spread far across the region and state with more than 350
material and service suppliers across Missouri supporting the aircraft production occurring at the
Airport. In total, Boeing spent approximately $676 million at these suppliers in 2021, with most
of these suppliers located within a 70-mile radius of St. Louis Lambert International Airport.
Boeing is committed to its presence at the Airport, demonstrated by an investment of nearly
$700 million on capital improvements at their St. Louis Lambert International Airport facilities
between 2011 and 2021. Outside of their presence in St. Louis, Boeing’s impact continues to
grow in the region, with a $200 million expansion at the MidAmerica Airport in Illinois, which is
expected to finish by 2023. This facility will be used to develop the MQ-25, which is an
unmanned drone that refuels other aircraft midflight, allowing planes to launch from carriers and
travel further than they otherwise would. The Boeing investment at MidAmerica Airport is likely
to have a ripple effect throughout the region, including the St. Louis area, which is only 40 miles
away from MidAmerica Airport.
According to Boeing representatives, “Boeing’s presence in St. Louis is strong, with 16,000
employees in the St. Louis metropolitan area alone, and future investments being made at the
MidAmerica St. Louis Airport, expected to lead to more growth for the region in the future. Our
activity at St. Louis Lambert International Airport is important to the nation’s defense industry.”
Boeing’s two locations in the St. Louis region are significant drivers of economic impact at St.
Louis Lambert International Airport and beyond. Boeing’s operations are highly reliant on Airport
access for testing, development, and mass production. Continued partnership with the Airport is
key to their current and future success.
5.6.3. Bunge
Bunge is a global leader in agribusiness and food and ingredients. From humble beginnings in
1818, the company has grown into a global presence, with more than 300 facilities in over 40
28
Merrilees, A., “Boeing adds 900 St. Louis jobs, looks to its future. And a new fighter jet.”, St. Louis Dispatch, February
16, 2023. https://www.stltoday.com/business/local/boeing-adds-900-st-louis-jobs-looks-to-its-future-and-a-new-fighter-
jet/article_6bc556b4-5497-595d-808a-
a5b2fdf32ac4.html#:~:text=The%20company%20added%20900%20jobs,what%20those%20aircraft%20will%20be.
(Accessed April 2023).

69 | Page
Section 5. 2019 Airport Economic Contributions and Community Benefits
// November 2023
countries and 23,000 employees worldwide. The company started as an import-export trading
company in Amsterdam and over the next 200+ years continued growing their business and
today connect farmers to consumers to sustainably deliver essential food, feed, and fuel to the
world. Bunge is the world’s leader in oilseed processing and a leading producer and supplier of
specialty plant-based oils and fats. The company works with customers on both ends of the food
supply—partnering with farmers to bring quality products from where they’re grown to where
they’re consumed. At the same time, Bunge collaborates with food customers to develop
tailored and innovative solutions to meet evolving dietary needs and trends in every part of the
world. Bunge works in a variety of markets including animal feed and pet food, bakery and
cereals, beverages, confectionary and snacks, biofuels, nutrition, and more.29
St. Louis served as Bunge’s North America headquarters beginning in 1990. In 2019, the
company announced it was moving its global headquarters from White Plains, New York to St.
Louis to be closer to its operations. Today, St. Louis is home to about 800 Bunge employees –
approximately 750 at the headquarters and another 40 or so at the research and innovation
center located 15 minutes away. Of that, approximately 200 of them travel regularly in support
of business activities. Bunge employees travel for trainings to support operations in other
manufacturing and office locations, and to collaborate with colleagues across the globe. As the
headquarters, St. Louis frequently sends and receives employees from locations in Europe,
South America, Asia-Pacific, and other parts of North America. While the St. Louis headquarters
was designed to house large training sessions, in some instances, Bunge has moved meetings
to Miami, New York, or Toronto as these cities offer more direct international service. As St.
Louis Lambert International Airport continues to expand international commercial airline service
across Europe and South America, Bunge hopes there may be more opportunities to host those
events in St. Louis.
In addition to internal Bunge employee travel, the company also generates travel to the area
from potential and existing customers who often bring in executives to meet with Bunge
executives, tour facilities, test products, and more. These potential and existing customers are
also traveling from locations in other parts of North America, Europe, South America, and Asia-
Pacific. Bunge also recently announced a merger with another global agribusiness, which, if
approved, would add an additional 13,000 employees to the company worldwide. The company
being combined with Bunge complements Bunge’s existing footprint and will likely increase
demand for international air service. Between employees and customers, Bunge invests a
significant amount of money annually to support the travel needs of their company. Considering
that Bunge operates on a global scale, it is no wonder they are reliant on scheduled air service
to conduct their daily business operations.
Bunge has a small private corporate aviation contract; however, Bunge relies on traditional
scheduled airline service for most travel. While Bunge offers flexible work arrangements as part
of its effort to promote a healthy work/life balance and create the best work environment for their
employees, the company also values in-person interactions and the culture of collaboration and
belonging that it creates. Making sure employees have access to frequent and comprehensive
air service is essential to that mission of togetherness. Bunge executives located in St. Louis
29
Bunge.com

70 | Page
Section 5. 2019 Airport Economic Contributions and Community Benefits
// November 2023
believe it is a world-class city and feel the city deserves a world-class airport. Bunge would like
to see the Airport continue to expand nonstop international service to create a world-class
airport so that the company can continue to recruit world-class talent, as well as send and
receive employees and clients from all over the world in the most efficient manner possible.

71 | Page
Section 6. 2032 Projected Future Economic Contributions // November
6. 2032 Projected Future Economic Contributions
In addition to calculating the annual economic impact of St. Louis Lambert International Airport
based on activity from 2019, this study also estimates the future economic contributions of the
Airport for 2032 based on two future scenarios: 1) completion of the proposed airport
development plan identified in the recent Master Plan
30
and 2) increases to nonstop
international air service. These scenarios provide an opportunity to estimate the economic
impact of the Airport in 2032 based on increased capacity and demand at the Airport, which
includes additional staff to support more demand, more opportunities for future business
development, and the additional visitors traveling to St. Louis Lambert International Airport via
the expanded international service.
The following subsections provide information on the methodology and assumptions required for
calculating the future impact of the Airport based on the same on- and off-airport activities
presented in Section 5. Due to the increased activity anticipated at the Airport, there will also be
increases to the tax impacts in 2032, which are also presented. It is important to note that the
economic impacts presented in the following sections are based on estimates of activity
occurring on- and off-airport in 2032; however, to provide an even comparison to the results
presented in Section 5, the future impacts are presented in 2019 dollars.
6.1. 2032 On-Airport Impacts
As discussed in Section 4.2.1, on-airport activities include airport administration (including
airport employees and airport contracted services), airport tenants, airport capital expenditures,
and the major aerospace manufacturing presence at the Airport. By 2032 it can be assumed
that impacts associated with each of these activities will be higher than impacts in 2019 due to
growth associated with airport operations, airport tenants
31
, and on-airport construction. To
estimate the growth of airport administration and airport tenants several factors were
considered, including growth in passengers, operations, changes to industries, and Moody’s
Analytics growth rate projections for 2032. Moody’s Analytics is an industry-accepted financial
intelligence and analytics tool that develops estimates for future economic conditions. The future
impacts for the major on-airport aerospace industry presence were not developed based on
industry assumptions or trends, and instead, were developed based on publicly available
documentation regarding future employment levels as well as planned future expansion and
construction projects.
Impacts of airport capital expenditures in 2032 were developed based on the preferred airport
development plan that was developed as part of the recent St. Louis Lambert International
Airport Master Plan. The purpose of the preferred airport development plan is to identify the
capital improvements necessary for the Airport to meet projected future demand, as identified in
the Master Plan’s forecasting efforts. The preferred airport development plan was developed
using an alternatives analysis process that built upon the Master Plan’s FAA-approved forecast
and is intended to accommodate the long-term facility needs. The preferred airport development
30
Estimated 2032 impacts assume the completion of the Airport’s preferred airport development plan.
31
Capital expenditures incurred by tenants were included in this analysis.
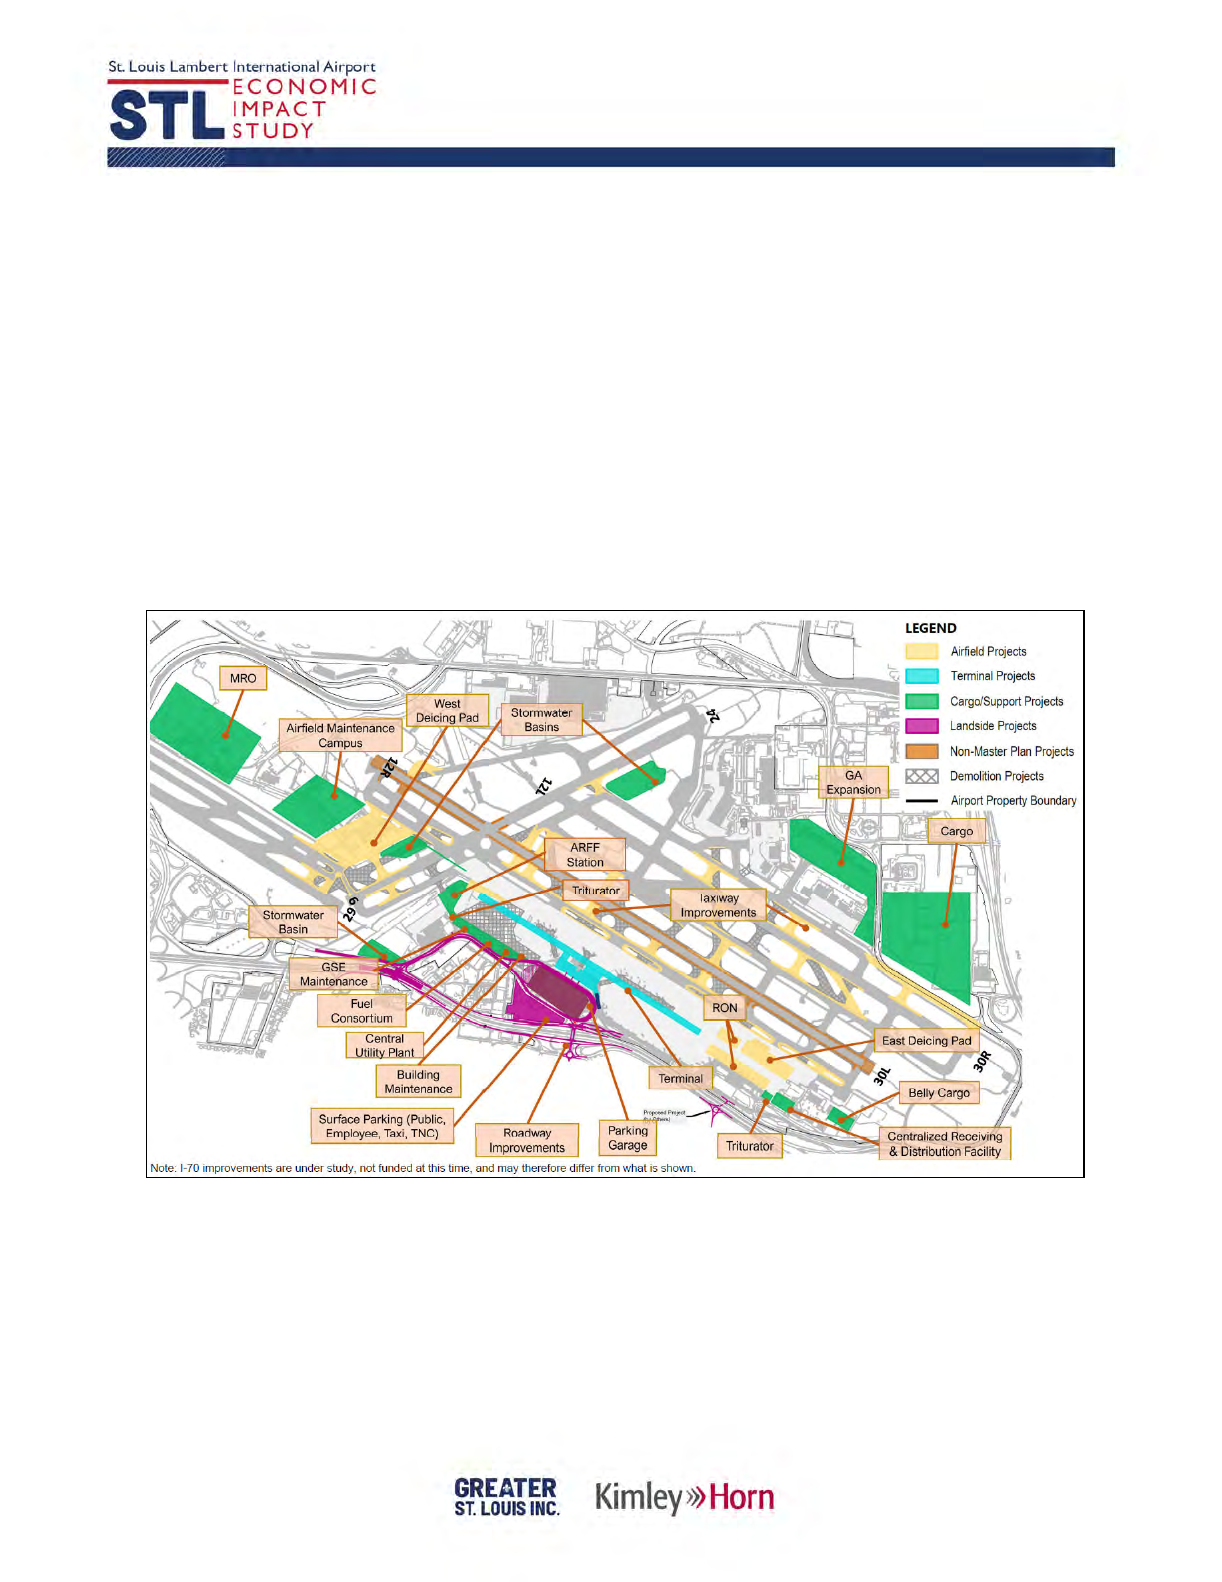
72 | Page
Section 6. 2032 Projected Future Economic Contributions // November
plan started with identifying airfield projects, then the terminal projects necessary to meet
passenger demand, then multimodal and landside projects were assessed, and finally cargo
facility needs were integrated.
As shown in Figure 6-1, the preferred airport development plan includes several large-scale
airside and landside capital improvements. This development is anticipated to occur over a 10-
year time frame; therefore, information was collected on the anticipated expenditures to be paid
out by the Airport annually over the 10-year time frame. For consistency in the process of
determining the 2019 capital expenditures analysis, an average annual capital expenditure
amount for 2032 was developed based on five years of spending data (2028-2032) for future
capital expenditure costs anticipated by the Airport as estimated by the Airport through the
Master Plan and subsequent evaluations.
Figure 6-1. Proposed Airport Development Plan
Sources: CMT, 2021 (basemap); WSP USA, 2022
6.1.1. 2032 On-Airport Direct Impacts
Table 6-1 presents the direct impacts of on-airport activity, estimated for the future year 2032.
As shown, it is anticipated that the Airport will employ approximately 700 people, and through
contracted services, support an additional nearly 370 jobs, resulting in more than 1,000 direct
airport administration jobs in 2032. These 2032 total airport administration jobs are projected to
support $72.4 million in payroll, contributing $123.4 million in value to the future GRP, and
$245.4 million in business revenues. Future impacts of airport tenants, including tenant capital

73 | Page
Section 6. 2032 Projected Future Economic Contributions // November
expenditures, are anticipated to support almost 8,000 jobs and approximately $498.2 million in
payroll.
The construction related to the Airport’s preferred airport development plan is anticipated to
generate more than 3,600 jobs and $236.7 million in payroll, ultimately generating
approximately $547.1 million in business revenues in 2032. The expansion of the major
aerospace manufacturing industry presence on the Airport is anticipated to generate more than
19,000 jobs, resulting in $2.9 billion in future 2032 payroll impacts. When all the on-airport
activities are considered, including the aerospace manufacturing industry, the Airport is
anticipated to support almost 32,000 jobs in 2032, which will generate almost $3.7 billion
in payroll, adding $3.8 billion in value to the GRP, and generating approximately $16.5
billion in business revenues.
Table 6-1. 2032 On-Airport Direct Impacts
Category Jobs Payroll Value Added
Business
Revenues
Airport Administration 1,065 $72,415,000 $123,440,000 $245,442,000
Airport Employees 700 $56,169,000 $103,288,000 $207,330,000
Airport Contracted Services 365 $16,246,000 $20,152,000 $38,112,000
Airport Tenants* 7,938 $498,225,000 $1,000,963,000 $1,770,587,000
Airport Capital Expenditures 3,612 $236,741,000 $270,094,000 $547,056,000
Subtotal Direct On-Airport 12,615 $807,381,000 $1,394,497,000 $2,563,085,000
Aerospace Manufacturing** 19,051 $2,918,258,000 $2,436,387,000 $13,893,182,000
2032 Total Direct On-Airport 31,666 $3,725,639,000 $3,830,884,000 $16,456,267,000
Notes: *Employment and capital expenditure impacts exclude the major on-airport aerospace firms. **Impacts generated from the
major on-airport aerospace firms. Totals may not sum due to rounding. Dollar values were rounded to the nearest thousand. Dollars
are presented in 2019 dollars. Sources: IMPLAN V6.4, 2023; St. Louis Lambert International Airport, 2019; Moody’s Analytics for
2032, 2023; Kimley-Horn, 2023.
6.1.2. 2032 On-Airport Multiplier Impacts
Table 6-2 presents the multiplier impacts of on-airport activity, estimated for the future year
2032. These estimates present both indirect and induced impacts. As shown, the indirect and
induced impacts of airport administration are projected to result in a total of over 1,100 jobs,
which includes impacts of both airport employees and airport contracted services. The multiplier
impacts of airport administration are projected to generate approximately $96.6 million in
payroll, $213.8 million in value added, and $394.2 million in business revenues. Activity
projected for airport tenants is anticipated to produce more than 9,000 jobs, $522.0 million in
payroll, $863.2 million in value added, and approximately $1.6 billion in business revenues,
when the indirect and induced impacts are combined. Excluding the multiplier impacts of the
aerospace manufacturing industry, the estimated 2032 multiplier impacts of on-airport
activity will support almost 13,400 jobs, generating approximately $797.1 million in
payroll, adding almost $1.4 billion in value to GRP, and generating $2.5 billion in
business revenues. When the aerospace manufacturing multiplier impacts are

74 | Page
Section 6. 2032 Projected Future Economic Contributions // November
considered, then it is anticipated that the multiplier impacts of future on-airport activity
will support more than 52,500 jobs, which results in $3.3 billion in payroll impacts,
adding $5.4 billion of value to the GRP, and generating $9.8 billion in business revenues.
Table 6-2. 2032 On-Airport Multiplier Impacts
Category Impact Jobs Payroll Value Added
Business
Revenues
Airport Administration
Indirect 515 $37,352,000 $80,163,000 $152,069,000
Induced 594 $59,219,000 $133,594,000 $242,082,000
Airport Employees
Indirect 406 $30,660,000 $70,072,000 $133,987,000
Induced 451 $51,741,000 $120,434,000 $219,258,000
Airport Contracted
Services
Indirect 108 $6,692,000 $10,091,000 $18,082,000
Induced 143 $7,478,000 $13,161,000 $22,824,000
Airport Tenants*
Indirect 4,375 $271,272,000 $421,828,000 $818,859,000
Induced 4,799 $250,741,000 $441,332,000 $765,365,000
Airport Capital
Expenditures
Indirect 1,149 $76,112,000 $128,667,000 $246,164,000
Induced 1,959 $102,402,000 $179,945,000 $311,897,000
Subtotal On-Airport
Indirect Impacts
N/A 6,039 $384,736,000 $630,658,000 $1,217,092,000
Subtotal On-Airport
Induced Impacts
N/A 7,351 $412,362,000 $754,871,000 $1,319,344,000
Subtotal On-Airport
Multiplier Impacts
N/A 13,390 $797,098,000 $1,385,529,000 $2,536,436,000
Aerospace
Manufacturing**
Indirect 13,849 $1,146,755,000 $1,690,196,000 $3,258,763,000
Induced 25,309 $1,322,243,000 $2,328,352,000 $4,037,878,000
Total On-Airport Indirect
Impacts
N/A 19,888 $1,531,491,000 $2,320,854,000 $4,475,855,000
Total On-Airport Induced
Impacts
N/A 32,660 $1,734,605,000 $3,083,223,000 $5,357,222,000
2032 Total On-Airport
Multiplier Impacts
N/A 52,547 $3,266,096,000 $5,404,077,000 $9,833,077,000
*Employment and capital expenditure impacts exclude the major on-airport aerospace firms. **Impacts generated from the major on-
airport aerospace firms. Totals may not sum due to rounding. Dollar values were rounded to the nearest thousand. Dollars are
presented in 2019 dollars. Sources: IMPLAN V6.4, 2023; 2023; Kimley-Horn, 2023.
6.1.3. 2032 Total On-Airport Activity Impacts
Table 6-3 presents the estimated 2032 total impacts of on-airport activity at the Airport. As
shown, the impacts estimated for 2032 on-airport activity, excluding impacts of the aerospace
industry, will support over 26,000 jobs, which in turn, will generate almost $1.6 billion in payroll,
adding approximately $2.8 billion to the GRP, and approximately $5.1 billion in business
revenues. The future total impact of the aerospace manufacturing industry will support more

75 | Page
Section 6. 2032 Projected Future Economic Contributions // November
than 58,200 jobs, resulting in almost $5.4 billion in payroll, approximately $6.5 billion in value
added, and almost $21.2 billion in business revenue impacts. When all on-airport activities
are considered, the total estimated 2032 impact of future on-airport activity is anticipated
to support more than 84,200 jobs, generating approximately $7.0 billion in payroll, and
producing approximately $26.3 billion in business revenues, while contributing over $9.2
billion to the GRP.
Table 6-3. 2032 On-Airport Total Impacts
Category Jobs Payroll Value Added
Business
Revenues
Airport Administration 2,173 $168,986,000 $337,197,000 $639,593,000
Airport Employees
1,557 $138,570,000 $293,793,000 $560,575,000
Airport Contracted Services 616 $30,416,000 $43,403,000 $79,018,000
Airport Tenants* 17,111 $1,020,238,000 $1,864,122,000 $3,354,811,000
Airport Capital Expenditures 6,720 $415,255,000 $578,707,000 $1,105,118,000
Subtotal On-Airport 26,005 $1,604,479,000 $2,780,025,000 $5,099,522,000
Aerospace Manufacturing** 58,208 $5,387,256,000 $6,454,936,000 $21,189,823,000
2032 Total On-Airport 84,213 $6,991,735,000 $9,234,961,000 $26,289,345,000
*Employment and capital expenditure impacts exclude the major on-airport aerospace firms. **Impacts generated from the major on-
airport aerospace firms. Totals may not sum due to rounding. Dollar values were rounded to the nearest thousand. Dollars are
presented in 2019 dollars. Sources: IMPLAN V6.4, 2023; St. Louis Lambert International Airport, 2019; Moody’s Analytics for 2032,
2023; Kimley-Horn, 2023.
6.2. 2032 Off-Airport Impacts
As discussed in Section 4.2.2, off-airport activities include both aviation-related or reliant
businesses located off the Airport’s property and impacts associated with visitors traveling to the
St. Louis region via either GA or commercial service operations at the Airport.
The estimated growth for the aviation-reliant business sectors included in this analysis were
developed based on Airport and socioeconomic factors, including Moody’s Analytics growth
projections for 2032.
To estimate impacts of visitor spending in 2032 it was necessary to determine an estimate for
the number of GA and commercial service visitors as well as an average per visitor spending
amount for both GA and commercial service visitors. These are the same two factors used to
determine 2019 visitor spending impacts, as discussed in Section 4.2.2.2. The estimate for the
future GA and commercial service visitors was developed based on the forecasts developed for
the recent St. Louis Lambert International Airport Master Plan.
According to the recent St. Louis Lambert International Airport Master Plan, it is anticipated that
2032 GA operations will remain consistent with 2019 operations. Therefore, the number of 2032
GA visitors will remain consistent with the estimate for 2019 GA visitors, as presented in
Section 4.2.2.2. Moreover, the per visitor spending amount for GA visitors was held constant at

76 | Page
Section 6. 2032 Projected Future Economic Contributions // November
the 2019 amount, which was $252. Therefore, it is anticipated that the direct spending by GA
visitors in 2032 will remain constant with direct GA visitor spending in 2019.
The recent St. Louis Lambert International Airport Master Plan was also referenced to
determine the number of commercial service passengers based on the projected number of
enplanements in 2032, which is approximately 9.2 million as presented in the St. Louis Lambert
International Airport Forecast Adjustment Memo submitted to the FAA. These 2032
enplanements were separated by domestic and international service, with international
enplanements accounting for 6% of the total enplanements (nearly 600,000) and the remaining
94% of enplanements (8.6 million) considered domestic. In 2019, only 2% of enplanements
were international; however, the share of international enplanements was increased to 6% to
account for forecasted growth of existing international service as well as the introduction of new
international service as estimated by the Airport. St. Louis Lambert International Airport
anticipates increases to the existing nonstop Lufthansa service, initiated after 2019 but before
2023, as well as the introduction of new nonstop international service to other destinations in
Europe via another European carrier, and new nonstop service to cities in South America, the
Caribbean, Canada, and Mexico. It is important to note that the 8,608,530 domestic
enplanements were decreased by 23% to isolate only the origin and destination enplanements,
which results in 6,628,568 O&D domestic enplanements being included in this analysis.
The number of domestic (6.6 million) and international enplanements (nearly 600,000)
estimated for 2032 were used to determine the estimate for true visitors, which are considered
non-local visitors. A percentage of true domestic and international visitors was calculated based
on information provided by Airline Data, Inc. and other growth factors, as it is assumed that the
number of true visitors will increase as the Airport expands their domestic and international
nonstop service destinations. It was assumed that 48% of domestic and 48% of international
passengers could be considered true visitors, resulting in approximately 3.2 million domestic
and 280,000 international visitors in 2032.
With an estimate for domestic and international visitors developed, it was then necessary to
determine an estimate for the amount of money each visitor will spend during their trip. The
2019 commercial service visitor per trip spending amount of $692 was held constant for
domestic visitors for the 2032 impact analysis. Due to the anticipated increase in overall
international visitors departing via the Airport in 2032, it was determined that a higher rate of
spending per visitor would be applied to international visitors because, on average, international
visitors typically spend more money per trip than domestic visitors.
32
Using estimates derived
from other future visitor spending analyses conducted in other major cities, it was determined
that international visitor’s spend, on average, approximately 58% more per trip than domestic
travelers. Therefore, the 2032 per visitor per trip spending amount for domestic visitor was
increased by 58%, resulting in an international visitor spending per trip amount of $1,093. As
was done to determine the direct visitor spending amounts for 2019 visitors, the total number of
32
This was not a factor for the 2019 analysis as such a small percentage of total true visitors were
international visitors.

77 | Page
Section 6. 2032 Projected Future Economic Contributions // November
true visitors was multiplied by the per visitor per trip spending amounts to determine an estimate
for 2032 domestic and international visitor spending.
The following sections present the results of the off-airport impact analysis for both off-airport
aviation-reliant businesses and commercial service and GA visitors. The impacts of future
international air service, specifically, is presented in Section 6.2.4.
6.2.1. 2032 Off-Airport Direct Impacts
The following subsections present the estimated 2032 direct impacts of off-airport aviation
reliant businesses and visitor spending separately. The combined total impacts of off-airport
activity are presented in Section 6.2.3.
6.2.1.1. Aviation-Reliant Business
As shown in Table 6-4, it is anticipated that 4,900 jobs will be supported by direct off-
airport aviation-reliant business activity in 2032. These jobs are projected to support
approximately $315.4 million in payroll, contributing almost $376.8 million in value
added, and overall generating approximately $1.1 billion in direct business revenue
impacts.
Table 6-4. 2032 Off-Airport Aviation-Reliant Businesses Direct Impacts
Category Jobs Payroll Value Added
Business
Revenues
2032 Total Aviation-Reliant
Businesses Direct Impacts
4,899 $315,433,000 $376,782,000 $1,059,857,000
Notes: Dollar values were rounded to the nearest thousand. Dollars are presented in 2019 dollars. Sources: IMPLAN V6.4, 2023;
NAICS Association, 2023; CoStar, 2023; D&B Hoovers, 2023; ESRI Business Analyst, 2023; Moody’s Analytics for 2032, 2023;
Kimley-Horn, 2023
6.2.1.2. Commercial Service and GA Visitors
As shown in Table 6-5, it is projected that over 26,600 direct jobs will be supported by
commercial service visitors traveling via the Airport in 2032, which will generate approximately
$796.5 million in direct payroll, adding $1.2 billion in value to the GRP, and $2.0 billion in
business revenue impacts. GA visitors traveling via the Airport in 2032 are anticipated to
support just over 110 direct jobs, generating approximately $3.4 million in payroll, almost $5.0
million in value added, and $8.6 million in business revenue impacts. When combined, the
activity stemming from direct impacts of commercial service and GA visitors in 2032 are
estimated to provide nearly 27,000 direct jobs, generating almost $800 million in payroll,
$1.2 billion in value added, and more than $2.0 billion in business revenues.

78 | Page
Section 6. 2032 Projected Future Economic Contributions // November
Table 6-5. 2032 Off-Airport Visitor Spending Direct Impacts
Category Jobs Payroll Value Added
Business
Revenues
Commercial Service 26,658 $796,491,000 $1,175,673,000 $2,039,140,000
GA 113 $3,363,000 $4,964,000 $8,610,000
2032 Total Visitor
Spending Direct Impacts
26,770 $799,854,000 $1,180,637,000 $2,047,750,000
Notes: Totals may not sum due to rounding. Dollar values were rounded to the nearest thousand. Dollars are presented in 2019
dollars. Sources: IMPLAN V6.4, 2023; Airline Data Inc, 2019; Flight Aware, 2019; St. Louis Lambert International Airport Master
Plan, 2022; Kimley-Horn, 2023
6.2.2. 2032 Off-Airport Multiplier Impacts
The following subsections present the estimated 2032 multiplier impacts of off-airport aviation-
reliant businesses and visitor spending separately. The combined total impacts of off-airport
activity are presented in Section 6.2.3.
6.2.2.1. Aviation-Reliant Businesses
Future 2032 multiplier impacts of off-airport aviation-reliant businesses are anticipated to
provide more than 5,000 jobs, as shown in Table 6-6. When indirect and induced impacts
are combined as total multiplier impacts for off-airport aviation-reliant businesses in
2032, the payroll multiplier impacts for future aviation-reliant businesses are projected to
be approximately $292.7 million, generating $479.1 million in value added, resulting in
$865.7 million in multiplier business revenues.
Table 6-6. 2032 Off-Airport Aviation-Reliant Businesses Multiplier Impacts
Category Impact Jobs Payroll Value Added
Business
Revenues
Aviation-Reliant Businesses
Indirect 2,154 $143,303,000 $216,132,000 $409,651,000
Induced 2,859 $149,381,000 $262,975,000 $456,062,000
2032 Total Aviation-Reliant
Businesses Multiplier
Impacts
N/A 5,013 $292,684,000 $479,107,000 $865,713,000
Notes: Totals may not sum due to rounding. Dollar values were rounded to the nearest thousand. Dollars are presented in 2019
dollars. Sources: IMPLAN V6.4, 2023; NAICS Association, 2023; CoStar, 2023; D&B Hoovers, 2023; ESRI Business Analyst, 2023;
Moody’s Analytics for 2032, 2023; Kimley-Horn, 2023
6.2.2.2. Visitor Spending
As shown in Table 6-7, the majority of the multiplier impacts associated with visitor spending in
2032 in terms of jobs and all other indicators are anticipated to come from commercial service
visitor spending with over 12,500 jobs. Commercial service visitors are anticipated to support
approximately $703.1 million in multiplier payroll impacts, which results in approximately $1.2
billion in value-added impacts, and $2.1 billion in business revenues in 2032. Estimates for

79 | Page
Section 6. 2032 Projected Future Economic Contributions // November
multiplier impacts related to future GA visitors indicates that just over 50 jobs will be supported
by this activity, resulting in multiplier payroll impacts of almost $3.0 million.
When all future visitor impacts are combined, it is anticipated that multiplier impacts
related to future 2032 visitor spending will support more than 12,605 jobs, generating
$706.1 million in payroll, which is anticipated to add almost $1.2 billion in value to the
regional economy, resulting in approximately $2.1 billion in multiplier business revenues
impacts.
Table 6-7. 2032 Off-Airport Visitor Spending Multiplier Impacts
Category Impact Jobs Payroll Value Added
Business
Revenues
Commercial Service
Indirect 5,615 $334,810,000 $521,815,000 $996,454,000
Induced 6,937 $368,295,000 $648,964,000 $1,122,185,000
GA
Indirect 24 $1,414,000 $2,203,000 $4,207,000
Induced 29 $1,555,000 $2,740,000 $4,738,000
Total Visitor Spending
Indirect Impacts
N/A 5,639 $336,224,000 $524,018,000 $1,000,661,000
Total Visitor Spending
Induced Impacts
N/A 6,966 $369,850,000 $651,704,000 $1,126,923,000
2032 Total Visitor
Spending Multiplier
Impacts
N/A
12,605 $706,074,000 $1,175,722,000 $2,127,584,000
Notes: Totals may not sum due to rounding. Dollar values were rounded to the nearest thousand. Dollars are presented in 2019
dollars. Sources: IMPLAN V6.4, 2023; Airline Data Inc, 2019; Flight Aware, 2019; St. Louis Lambert International Airport Master
Plan, 2022; Kimley-Horn, 2023
6.2.3. 2032 Total Off-Airport Multiplier Impacts
The total future off-airport impacts, for both aviation-reliant businesses and visitor spending, is
presented in Table 6-8. As shown, almost 10,000 jobs will be generated from future aviation-
reliant business impacts, resulting in total payroll impacts of approximately $608.1 million,
$855.9 million in value added, and $1.9 billion in total business revenue impacts. The total
impacts of commercial service and GA visitors in 2032 is anticipated to support nearly 39,400
jobs, which are projected to produce $1.5 billion in payroll, adding approximately $2.4 billion in
value to the GRP, and generating almost $4.2 billion in total business revenue impacts. When
considering the future 2032 impacts of all off-airport activity, there are an estimated
49,300 jobs attributable to total off-airport impacts, resulting in $2.1 billion in payroll
impacts, $3.2 billion in value added, and $6.1 billion in total business revenue impacts.

80 | Page
Section 6. 2032 Projected Future Economic Contributions // November
Table 6-8. 2032 Off-Airport Total Impacts
Category Jobs Payroll Value Added
Business
Revenues
Aviation-Reliant Businesses 9,912 $608,117,000 $855,888,000 $1,925,570,000
Commercial Service and GA
Visitors
39,375 $1,505,926,000 $2,356,359,000 $4,175,334,000
Commercial Service Visitors 39,209 $1,499,594,000 $2,346,452,000 $4,157,779,000
GA Visitors 166 $6,332,000 $9,907,000 $17,555,000
2032 Total Off-Airport Impacts 49,287 $2,114,043,000 $3,212,247,000 $6,100,904,000
Notes: Totals may not sum due to rounding. Dollar values were rounded to the nearest thousand. Dollars are presented in 2019 dollars. Sources: IMPLAN V6.4,
2023; Airline Data Inc, 2019; Flight Aware, 2019; St. Louis Lambert International Airport Master Plan, 2022; NAICS Association, 2023; CoStar, 2023; D&B Hoovers,
2023; ESRI Business Analyst, 2023; Moody’s Analytics for 2032, 2023; Kimley-Horn, 2023.
6.2.4. Impacts of Future International Air Service
As noted, in 2019 there was limited nonstop international air service offered at the Airport.
Therefore, the 2019 visitor spending impacts presented in Section 5.2 primarily comprise GA
and domestic commercial service visitors. Following 2019, the Airport introduced nonstop air
service to Europe via Lufthansa. This Lufthansa service was not only a welcome change for
those traveling to Europe on vacation but added immense value to the global corporate
headquarters located in St. Louis, as it provided an efficient and frequent connection overseas.
This service was generated as a result of the business community providing financial support to
ensure its success, supporting their own travel needs and providing more opportunities for the
region’s residents and other businesses to travel nonstop to Europe.
Initially, Lufthansa offered service three times a week; however, it is anticipated that in 2032
Lufthansa will increase their service to at least five times a week. Moreover, the Airport
anticipates that additional international service will be available at the Airport in 2032, including
nonstop service to locations in Europe, South America, as well as the Caribbean, Mexico, and
Canada, all occurring multiple times a week.
As discussed in Section 6.2, the number of international visitors anticipated in 2032 was
calculated based on the St. Louis Lambert International Airport Master Plan forecast data,
information provided by the Airport, and review of industry reports, such as Airline Data, Inc.
Using the number of international visitors, it was possible to determine the future potential
impact of international air service at the Airport, which is presented in Table 6-9. As shown,
direct impacts of visitors using future international service are anticipated to support more than
3,200 jobs, which will result in almost $100 million in payroll impacts, $143.6 million in value
added, and $249.1 million in direct business revenues. When considering the direct, indirect,
and induced impacts, it is anticipated that future visitors utilizing international air service
at the Airport will support nearly 4,800 total jobs, generating $183.2 million in payroll. The
total impact of future visitor impacts resulting from international air service is anticipated
to add approximately $286.7 million in value to the GRP, resulting in approximately half a
billion dollars of total business revenues for the St. Louis region. It is important to note that

81 | Page
Section 6. 2032 Projected Future Economic Contributions // November
the impacts presented here are not in addition to the impacts presented in Table 6-8, but rather
included within those impacts.
Table 6-9. 2032 Total Impacts of Future International Air Service at St. Louis
Lambert International Airport
Future International Air
Service Impacts
Jobs Payroll Value Added
Business
Revenues
Direct Impacts 3,257 $97,307,000 $143,632,000 $249,121,000
Indirect Impacts 686 $40,904,000 $63,750,000 $121,737,000
Induced Impacts 847 $44,995,000 $79,284,000 $137,097,000
2032 Total International Air
Service Impacts
4,790 $183,205,000 $286,666,000 $507,955,000
Notes: Totals may not sum due to rounding. Dollar values were rounded to the nearest thousand. Dollars are presented in 2019
dollars. Sources: IMPLAN V6.4, 2023; Airline Data Inc, 2019; S St. Louis Lambert International Airport Master Plan, 2022; Kimley-
Horn, 2023.
Figure 6-2 presents the percent share of total visitor spending impacts generated from future
international air service within the total, which also includes domestic commercial service and
GA impacts. As shown, future international air service visitor spending is anticipated to account
for approximately 12% of the total 2032 visitor spending impacts, with domestic commercial
service visitor spending impacts accounting for slightly more than 87% and GA visitor spending
impacts accounting for less than 1%.

82 | Page
Section 6. 2032 Projected Future Economic Contributions // November
Figure 6-2. Share of 2032 Total Visitor Spending Impacts by Type of Visitor
Notes: Totals may not sum due to rounding. Dollar values were rounded to the nearest thousand. Dollars are presented in 2019
dollars. Sources: IMPLAN V6.4, 2023; Airline Data Inc, 2019; St. Louis Lambert International Airport Master Plan, 2022; Kimley-
Horn, 2023.
It is important to note that there are several other factors that contribute to the economic impact
of new international flights that are not represented in the international visitor spending impacts
presented in Section 6.2.4. These factors include increases in airport landing fees as a result of
the actual flight operations and additional fuel sales, as well as impacts related to cargo and
freight activity. Impacts of cargo and freight activity are two-fold, as it would include the impact
of the overall weight of the goods as well as the value of the goods. Other factors that contribute
to the impact of international flights are associated economic development opportunities for the
region, as companies will often grow their impact as new international service becomes
available, bringing new money and new business opportunities to the region. Finally, there are
impacts associated with time-savings, as many firms prefer to fly non-stop and will travel to
airports within their region to access nonstop service. These additional benefits were not
calculated as part of this analysis given the lack of specificity of the future international air
service.
6.3. 2032 Total Airport Impacts
Table 6-10 presents the total future Airport impacts anticipated for the year 2032, inclusive of all
on- and off-airport activities. As shown, it is anticipated that in 2032, direct impacts of on- and
off-airport activity will generate more than 63,300 jobs in the St. Louis region, which will result in
almost $4.8 billion in payroll impacts, approximately $5.4 billion in value-added impacts, and
$19.6 billion in business revenues. The multiplier impacts of future 2032 on- and off-airport
87.4%
12.2%
0.4%
Future Domestic Commercial Service Visitor Spending Impacts
Future International Commercial Service Visitor Spending Impacts
Future GA Visitor Spending Impacts

83 | Page
Section 6. 2032 Projected Future Economic Contributions // November
impacts will support more than 70,000 jobs, $4.3 billion in payroll, approximately $7.1 billion in
value-added impacts, and $12.8 billion in business revenues. When combined, the direct and
multiplier impacts of on- and off-airport activity in 2032 are anticipated to provide just
over 133,500 jobs in the St. Louis region, which will result in almost $9.1 billion paid out
in payroll, adding $12.5 billion to the GRP, and generating almost $32.4 billion in total
business revenues.
Table 6-10. 2032 St. Louis Lambert International Airport Total Airport Impacts
Category Jobs Payroll Value Added
Business
Revenues
Total Direct Impacts 63,335 $4,840,926,000 $5,388,303,000 $19,563,874,000
Total Multiplier Impacts 70,166 $4,264,853,000 $7,058,906,000 $12,826,374,000
Total Indirect Impacts 27,681 $2,011,018,000 $3,061,004,000 $5,886,167,000
Total Induced Impacts 42,485 $2,253,836,000 $3,997,902,000 $6,940,207,000
2032 Total Airport
Impacts
133,501 $9,105,778,000 $12,447,209,000 $32,390,249,000
Notes: Totals may not sum due to rounding. Dollar values were rounded to the nearest thousand. Dollars are presented in 2019
dollars. Sources: IMPLAN V6.4, 2023; Airline Data Inc, 2019; Flight Aware, 2019; St. Louis Lambert International Airport Master
Plan, 2022; NAICS Association, 2023; CoStar, 2023; D&B Hoovers, 2023; ESRI Business Analyst, 2023; Moody’s Analytics for
2032, 2023; St. Louis Lambert International Airport, 2019; Kimley-Horn, 2023.
As shown in Table 6-11, it is anticipated that 65,380 jobs will be supported by total airport
impacts, alone, in 2032. These total airport impact jobs are anticipated to support
approximately $3.1 billion in payroll, generating $5.1 billion in value-added benefits, and
approximately $9.3 billion in total business revenues. Included within the category of
“airport impacts” is future airport administration, airport tenants, airport capital expenditures, and
visitor spending impacts. The aerospace manufacturing activity anticipated for 2032 is projected
to support 58,208 total jobs, which corresponds with approximately $5.4 billion in payroll, $6.5
billion in value added, and almost $21.2 billion in business revenues. The future impact of off-
airport aviation-reliant businesses is anticipated to result in almost 10,000 jobs added to the St.
Louis region in 2032, resulting in $608.1 million in payroll, adding $855.9 million in value to the
GRP, which will generate $1.9 billion in business revenues.

84 | Page
Section 6. 2032 Projected Future Economic Contributions // November
Table 6-11. 2032 St. Louis Lambert International Airport Total Impacts by Activty
Type
Activity Jobs Payroll Value Added
Business
Revenues
Airport Impacts* 65,380 $3,110,405,000 $5,136,385,000 $9,274,856,000
Aerospace Manufacturing 58,208 $5,387,256,000 $6,454,936,000 $21,189,823,000
Aviation Reliant Businesses 9,912 $608,117,000 $855,888,000 $1,925,570,000
Total
133,501 $9,105,778,000 $12,447,209,000 $32,390,249,000
Notes: *Includes airport administration, airport tenants, airport capital expenditures, and visitor spending impacts. Totals may not
sum due to rounding. Dollar values were rounded to the nearest thousand. Dollars are presented in 2019 dollars. Sources: IMPLAN
V6.4, 2023; Airline Data Inc, 2019; Flight Aware, 2019; St. Louis Lambert International Airport Master Plan, 2022; NAICS
Association, 2023; CoStar, 2023; D&B Hoovers, 2023; ESRI Business Analyst, 2023; Moody’s Analytics for 2032, 2023; St. Louis
Lambert International Airport, 2019; Kimley-Horn, 2023.
When comparing the results of the current 2019 airport impact economic contributions to the
estimated future 2032 airport impact economic contributions, it is anticipated that total payroll
impacts will increase by 56% ($2.0 billion to $3.1 billion) between 2019 and 2032. The number
of jobs that the airport impacts support is anticipated to grow 55% (42,295 to 65,380) between
2019 and 2032. When looking at the total contributions of the airport impacts, there is an
anticipated 53% increase ($6.1 billion to $9.3 billion) in total airport impact between 2019 and
what is estimated for 2032. The growth of airport impacts anticipated between 2019 and 2032 is
comparable to the growth identified between the previous 2013 study and this study.
6.4. 2032 Tax Impacts
Tax impacts for 2032 were developed using the same process as tax impacts for the 2019
analysis. IMPLAN provides tax estimates at the city, special district, county, state, and federal
level for each category of impact, whether on- or off-airport. As with the 2019 tax impacts, the
2032 tax impacts represent taxes paid by employee compensation, taxes of production and
imports, other property income, and personal taxes.
As shown in Table 6-12, the local tax impacts related to the anticipated direct on- and off-airport
activity is projected to reach approximately $287.3 million, with airport impacts, including airport
administration, airport tenants (excluding aerospace manufacturing), capital expenditures, and
visitor spending, contributing the most to this. The total direct tax impacts across all on- and
off-airport activity anticipated in 2032 is almost $1.5 billion, with most of those tax
impacts coming from federal tax impacts.

85 | Page
Section 6. 2032 Projected Future Economic Contributions // November
Table 6-12. 2032 Tax Revenues Generated from Direct On- and Off-Airport Activity
Direct Impacts Local State Federal Total
Airport Impacts* $199,617,000 $146,409,000 $333,047,000 $679,072,000
Aerospace Manufacturing $75,190,000 $98,513,000 $536,836,000 $710,540,000
Aviation-Reliant Businesses $12,478,000 $13,623,000 $61,089,000 $87,189,000
2032 Direct Tax Revenues $287,285,000 $258,545,000 $930,972,000 $1,476,801,000
Notes: *Includes airport administration, airport tenants, airport capital expenditures, and visitor spending impacts. Totals may not
sum due to rounding. Dollar values were rounded to the nearest thousand. Dollars are presented in 2019 dollars. Sources: IMPLAN
V6.4, 2023; Kimley-Horn, 2023.
The total tax impacts (including direct and multiplier impacts), across all jurisdictions,
anticipated for on- and off-airport activity projected in 2032 is approximately $2.9 billion,
as shown in Table 6-13. Most of these tax impacts are associated with federal taxes, with federal
taxes accounting for $1.8 billion of the total 2032 estimate. Approximately $528.3 million in state
taxes, and $596.7 million in local taxes are estimated to make up the remainder of the total future
tax impacts for all on- and off-airport activity anticipated to occur in 2032.
Table 6-13. 2032 Tax Revenues Generated from Total On- and Off-Airport Activity
Total Impacts Local State Federal Total
Airport Impacts* $316,188,000 $245,045,000 $637,559,000 $1,198,790,000
Aerospace Manufacturing $247,529,000 $251,422,000 $1,048,437,000 $1,547,389,000
Aviation-Reliant Businesses $33,016,000 $31,822,000 $121,823,000 $186,661,000
2032 Total Tax Revenues $596,733,000 $528,289,000 $1,807,819,000 $2,932,840,000
Notes: Impacts presented in Table 6-13 include direct, indirect, and induced impacts. *Includes airport administration, airport
tenants, airport capital expenditures, and visitor spending impacts. Totals may not sum due to rounding. Dollars were rounded to the
nearest thousand. Dollars are presented in 2019 dollars. Sources: IMPLAN V6.4, 2023; Kimley-Horn, 2023.

86 | Page
Section 7. Conclusion // November 2023
7. Conclusion
The St. Louis Lambert International Airport has a long history of serving the air transportation
needs of the St. Louis region and will continue to do so long into the future. The Airport provides
a critical transportation link for the region, and many businesses in the region are reliant upon
the Airport for job creation and support, as well as transporting people and goods.
As demonstrated in this report, St. Louis Lambert International Airport is a thriving hub
for economic activity, generating economic activity on and off the Airport, with more than
300 businesses on-site and nearly 250 reliant upon it. Moreover, the on-airport and off-
airport activity presented in this report generated $27.5 billion in economic impact for the
region in 2019 and is anticipated to generate $32.4 billion by 2032.
