
A TrendLabs
SM
Research Paper
US Cities Exposed:
Industries and ICS
A Shodan-Based Security Study of Exposed Systems
and Infrastructure in the US
Numaan Huq, Stephen Hilt, and Natasha Hellberg
Trend Micro Forward-Looking Threat Research (FTR) Team

TREND MICRO LEGAL DISCLAIMER
The information provided herein is for general information
and educational purposes only. It is not intended and
should not be construed to constitute legal advice. The
information contained herein may not be applicable to all
situations and may not reect the most current situation.
Nothing contained herein should be relied on or acted
upon without the benet of legal advice based on the
particular facts and circumstances presented and nothing
herein should be construed otherwise. Trend Micro
reserves the right to modify the contents of this document
at any time without prior notice.
Translations of any material into other languages are
intended solely as a convenience. Translation accuracy
is not guaranteed nor implied. If any questions arise
related to the accuracy of a translation, please refer to
the original language ofcial version of the document. Any
discrepancies or differences created in the translation are
not binding and have no legal effect for compliance or
enforcement purposes.
Although Trend Micro uses reasonable efforts to include
accurate and up-to-date information herein, Trend Micro
makes no warranties or representations of any kind as
to its accuracy, currency, or completeness. You agree
that access to and use of and reliance on this document
and the content thereof is at your own risk. Trend Micro
disclaims all warranties of any kind, express or implied.
Neither Trend Micro nor any party involved in creating,
producing, or delivering this document shall be liable
for any consequence, loss, or damage, including direct,
indirect, special, consequential, loss of business prots,
or special damages, whatsoever arising out of access to,
use of, or inability to use, or in connection with the use of
this document, or any errors or omissions in the content
thereof. Use of this information constitutes acceptance for
use in an “as is” condition.
Contents
Exposed Critical Sectors
4
Exposed ICS Devices
26
Defensive Strategies
35
Conclusion
37
Appendix
38

The primary goal of this research paper is to build public awareness about exposed cyber assets and
highlight problems and issues associated with their exposure. We dene “exposed cyber assets” as
Internet-connected devices and systems that are discoverable on Shodan or similar search engines
and can be accessed via the public Internet.
Several research papers and conference talks have been published and presented that explore these
problems and issues, but in this paper, we studied exposed cyber assets from the macroscopic
perspective of cities. We proled exposed cyber assets in critical sectors that are integral to the daily
functioning of cities (i.e., government, emergency, healthcare, utilities, nancial services, and education
sectors). We also proled exposed industrial control systems (ICS) that are used to control operations
such as building automation, trafc system management, manufacturing processes, power generation,
and so on.
Some of the highlights from our research are:
• In the emergency services sector, Houston, Texas and Lafayette, Louisiana had the highest number
of exposed cyber assets.
• In the nancial services sector, New York City, the nancial hub of the US, had the highest number
of exposed cyber assets.
• In the utilities sector, exposed cyber assets are mostly located in small cities and towns; not in big
cities.
• In the education sector, there are a lot of exposed cyber assets; Philadelphia alone had more than
65,000 exposed devices.
We found that the top 4 exposed ICS protocols were MODBUS®, BACnet, EtherNet/IP, and Tridium
Fox. We also found screenshots of exposed Human Machine Interfaces (HMIs) used in industrial
environments, some of which were outside the US. The exposed cyber assets proled in this research
are critical to the daily functioning of cities and can impact many if not all residents. This is a follow-up
research to “Exposed US Cities in Shodan”
1
where we proled “all manners of” exposed cyber assets
in the top 10 US cities by population.
With the proliferation of cyberterrorism by rogue nations and terrorist groups, exposed cyber assets
pose serious threats to both national security and the daily functioning of cities. Important questions
that need answers include “Who is responsible for safeguarding and policing exposed cyber assets?”;
“And how?”; and “What awareness campaigns do we run to better protect city cyber infrastructure?”
In this paper, we will also provide some helpful security guidelines to protect critical infrastructure
networks.
DISCLAIMER: At no point during this research did we perform any scanning or attempt to access any of the Internet-connected devices and
systems. All published data, including screenshots, were collected via Shodan. Note that any mention of brands in this research does not suggest
any issue with the related products but only that they are searchable in Shodan.
As the Internet of Things (IoT) becomes the new norm, enterprises are taking advantage of the speed, convenience, and richness of data offered by
Internet-connected devices, from simple smart light controllers to machine-to-machine communication and automation technologies. This enables
different organizations, including industrial environments, to identify problems and inefciencies sooner and streamline processes, which in turn
allows them to deliver faster and better services. But, truth be told, today’s society is adopting connected technologies at a faster rate than we are
able to secure them. Caution dictates that in addition to exploring new opportunities with IoT, we also examine the implications and repercussions
of an all-devices-online world. There is a strong likelihood that some of the Internet-connected devices and systems running daily operations may
be inadvertently exposing sensitive information, which could potentially jeopardize everyone’s safety and security.

4 | US Cities Exposed: Industries and ICS
Exposed Critical Sectors
Today, 54% of the world’s population lives in urban areas, a proportion that is expected to increase to
66% by 2050.
2
According to the 2010 US Census, that number is even higher in the US, with 81% of the
country’s population living in urban areas.
3
The largest metropolitan statistical areas in the US are home to
between 5 and 20 million residents.
4
Big cities require an extensive array of goods, services, and facilities
for the daily operations of nancial service providers, healthcare facilities, educational institutions (primary,
secondary, and tertiary), government ofces (federal, state, and municipal), retail networks, agricultural
suppliers, utilities (power, water, gas, sanitation, etc.) providers, transportation networks, manufacturing
facilities, communication infrastructure, security and policing service providers, and so on. These critical
sectors are the organs of the modern metropolis.
There is a signicant overlap between a city’s critical and national critical infrastructure. Instead of
studying exposed cyber assets from a national critical infrastructure perspective, we chose to focus on
exposed cyber assets that can impact daily city operations. Whether we are studying the problem from
a national or municipal level, what remains constant are the mutual interdependencies between critical
infrastructure, which guarantee that any disruption in one will have several orders of impact in others. For
instance, a computer intrusion in the energy sector causing service disruption will likely impact several
other sectors, which may eventually impact the delivery of life-sustaining services in hospitals. Mutual
interdependencies between critical infrastructure is a very important and complex topic that is not very
well understood and can have a perceptible effect on many if not all residents. A detailed discussion of
critical infrastructure dependencies can be found in the Appendix.
In this paper, we examined the Shodan US scan data for February 2016. The data set contains a total
of 178,032,637 records generated from scanning 45,597,847 unique IPv4 and 256,516 unique IPv6
addresses. The raw scan data was indexed using Elasticsearch and queried using Kibana, which allowed
us to search more than 550 elds versus 40 elds using Shodan’s Web interface.
In this section, we proled exposed cyber assets in organizations from six critical sectors—government,
emergency services, healthcare, utilities, nancial, and education. The results presented here are for all
US cities. The critical sectors are essential in daily city operations and can perceptibly affect many if not
all residents.

5 | US Cities Exposed: Industries and ICS
One of the data elds populated by Shodan is org: (organization name). We did keyword searches on the
org: data eld to identify organizations that belong to our target critical sectors. There are many more
sectors in addition to the six sectors we proled that were not included in this report. These include
transportation, communications, food, energy, and others.
We excluded cloud service providers such as Amazon, Azure, Akamai, CloudFlare, and others from the
queries so we can focus on “actual” connected versus online virtual devices. It is also worth noting
that not all of the elds in every scan record were populated (e.g., not every record has the device eld
populated).
Government
Organizations that belong to the government sector were identied in the Shodan US scan data using
keywords such as “city of,” “county of,” “government,” “bureau of,” “executive ofce,” and so on. Please
note that it is not possible to get 100% coverage of all organizations that belong to the target sector using
keyword search alone. Our observations on exposed cyber assets in the government sector are:
• Lafayette, Louisiana and Saint Paul, Minnesota have more exposed cyber assets than Washington
DC.
• Wireless access points (WAPs), printers, rewalls, and webcams make up the bulk of exposed devices.
• Windows® (7, 8, and XP) is the most commonly used OS.
• Organizations in the government sector prefer using Microsoft Internet Information Server (IIS) Web
server instead of Apache.
• Web servers that communicate over ports 80 (HTTP) and 443 (HTTPS) are commonplace.
• Shodan found multiple unpatched vulnerable servers running in these organizations.
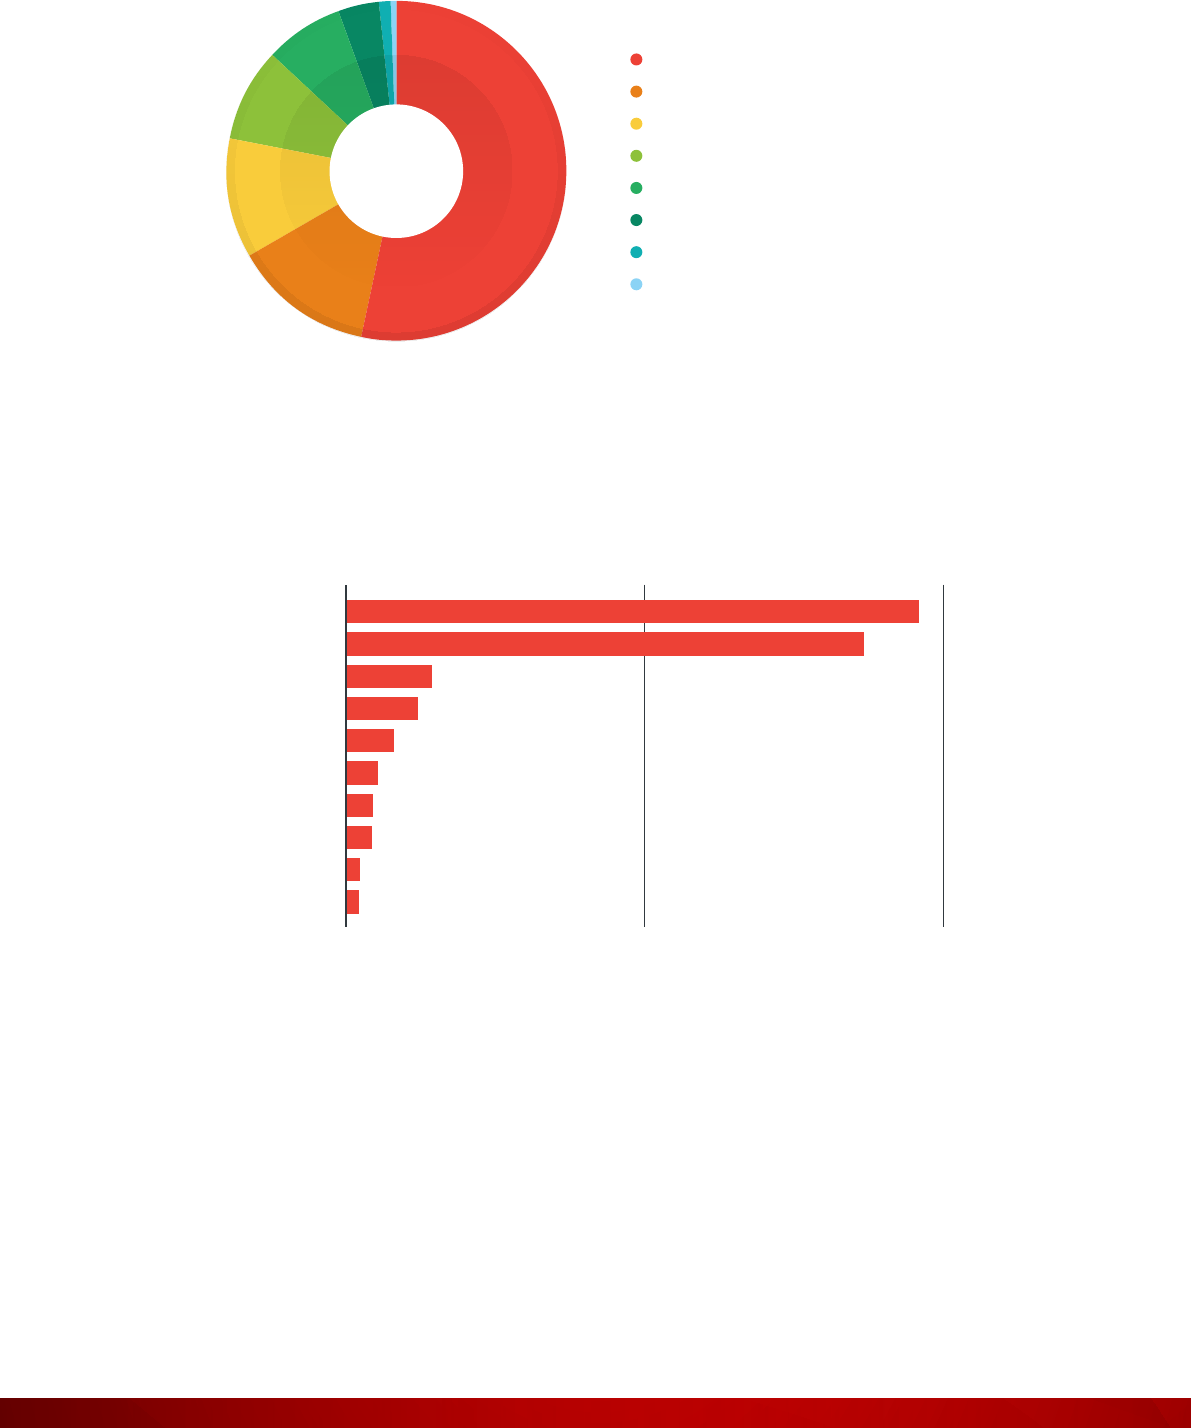
Firewall
WAP
Specialized device
Webcam
Router
Miscellaneous
security device
Printer
Switch
VoIP phone
Print server
48.72%
13.22%
9.38%
7.07%
6.87%
6.22%
4.12%
2.98%
0.71%
0.71%
TOTAL
9,576
Figure 1: Exposed device types in the government sector

6 | US Cities Exposed: Industries and ICS
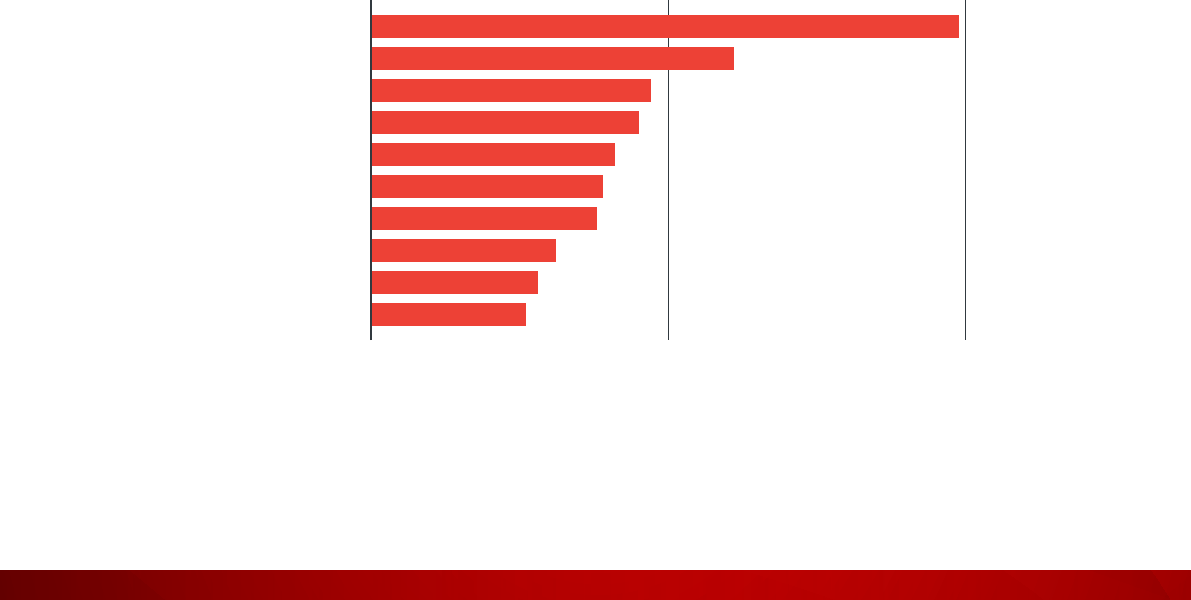
Figure 2: Cities with the highest number of exposed cyber assets in the government sector
12K6K0
Lafayette
Saint Paul
Washington
Bismarck
Denver
Raleigh
Clarksville
Huntsville
Athens
Fargo
Figure 3: Exposed OSs in the government sector
Windows 7/8
Linux 3.x
Linux 2.6.x
Windows XP
Linux 2.4−2.6
HP-UX 11.x
FreeBSD 8.x
Linux 2.4.x
FreeBSD 9.x
Mac OS X 10.x
51.56%
16.64%
15.63%
8.75%
2.58%
1.80%
1.17%
1.09%
0.47%
0.31%
TOTAL
1,280

7 | US Cities Exposed: Industries and ICS
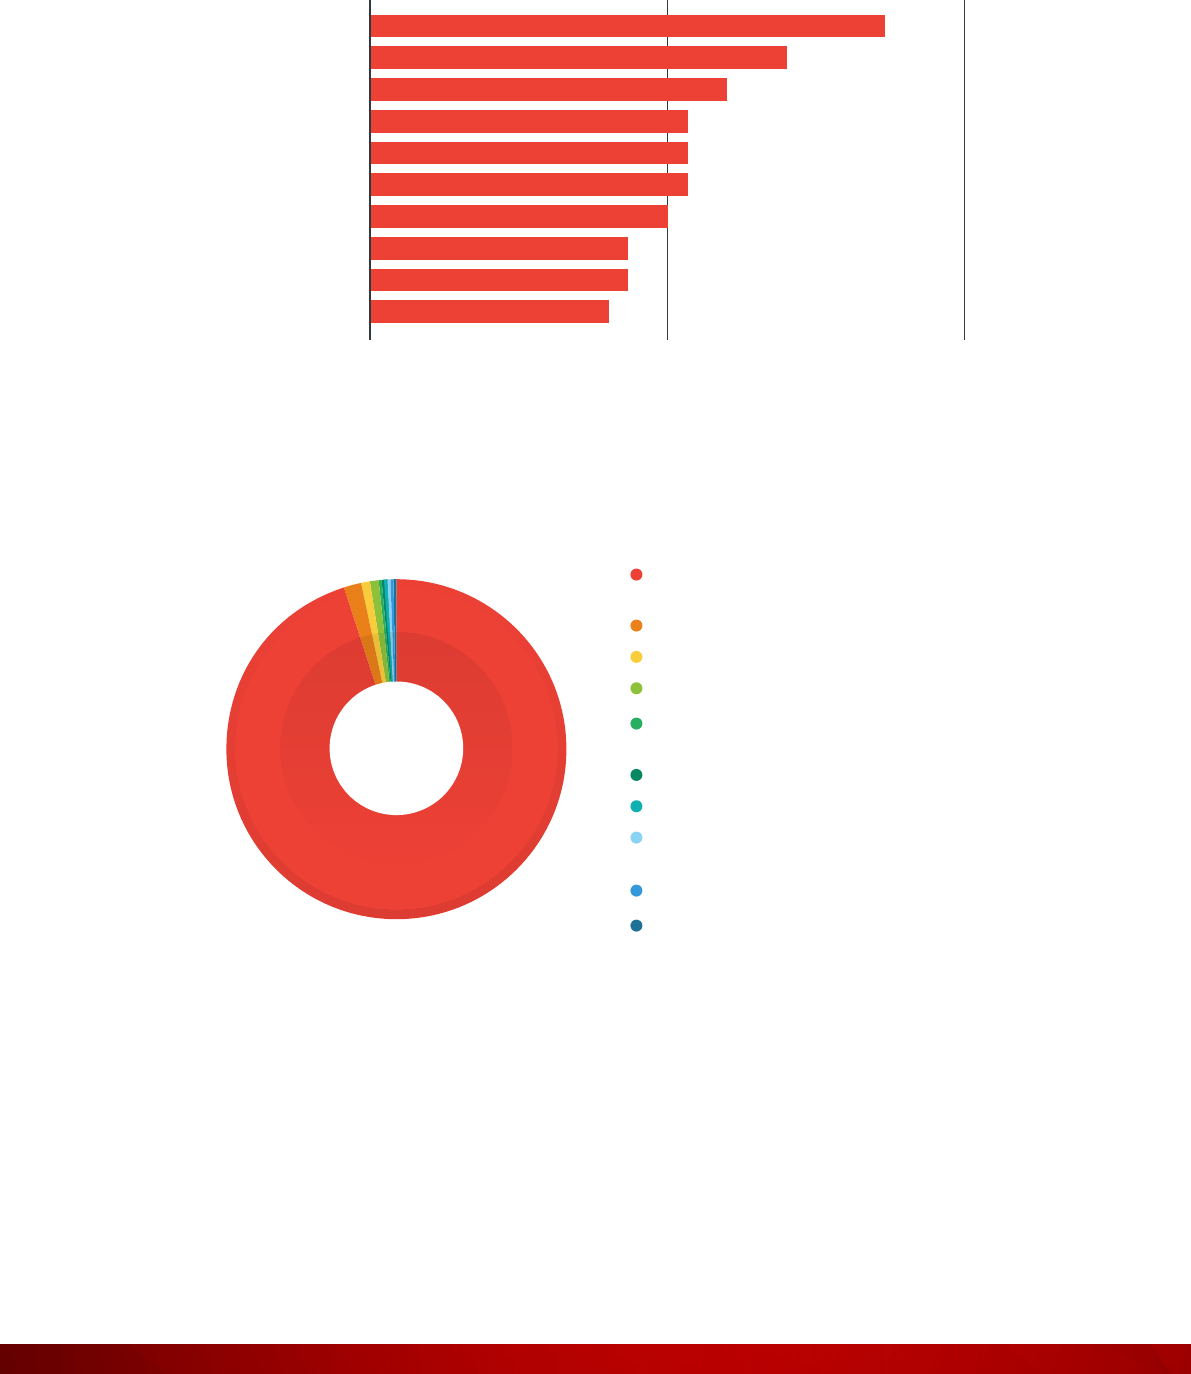
Figure 4: Exposed ports in the government sector
Microsoft IIS HTTPD
Apache HTTPD
Microsoft HTTPAPI
HTTPD
Apache Tomcat/
Coyote JSP engine
Cisco IOS HTTP config
OpenSSH
SonicWALL firewall
HTTPD config
Microsoft IIS
Dropbear SSHD
NGINX
45.10%
22.36%
9.17%
5.48%
4.74%
3.43%
3.13%
2.90%
1.86%
1.83%
TOTAL
99,547
120K60K0
Port:80
Port:443
Port:500
Port:4500
Port:22
Port:23
Port:8080
Port:21
Port:25
Port:3389
Figure 5: Exposed products in the government sector

8 | US Cities Exposed: Industries and ICS
Figure 6: Exposed vulnerable products in the government sector
Emergency Services
Organizations that belong to the emergency services sector were identied in the Shodan US scan data
using keywords such as “emergency,” “rescue,” “re,” “police,” “ambulance,” and others. Please note
that it is not possible to get 100% coverage of all organizations that belong to the target sector using
keyword search alone. Our observations on exposed cyber assets in the emergency services sector are:
• Houston, Texas and Lafayette, Louisina had the highest number of exposed cyber assets.
• Printers and rewalls make up the bulk of exposed devices.
• Shodan retrieved only eight banners with OS names—four Linux
®
and four Windows.
• Organizations in the emergency services sector prefer using Microsoft IIS instead of Apache.
• Web servers that communicate over ports 80 (HTTP) and 443 (HTTPS) are commonplace.
• Shodan did not nd any vulnerable server running in these organizations.
2001000
Apache Tomcat/Coyote JSP engine
Microsoft IIS HTTPD
Apache HTTPD
SonicWALL firewall HTTP config
MiniServ
Oracle HTTP Server Powered by Apache
EZproxy Web proxy
Microsoft IIS
WatchGuard Firewall HTTP config
Allegro RomPager

9 | US Cities Exposed: Industries and ICS
Figure 7: Exposed device types in the emergency services sector
Figure 8: Cities with the highest number of exposed cyber assets in the emergency services sector
Firewall
Printer
Router
Webcam
WAP
Switch
Miscellaneous security
device
Specialized device
PBX
Terminal server
55.65%
25.00%
6.45%
3.23%
2.42%
2.42%
1.61%
1.61%
0.81%
0.80%
TOTAL
124
5002500
Houston
Lafayette
Bolingbrook
Milwaukee
North Attleboro
Waynesboro
Romeoville
Pacific
New York
Sacramento

10 | US Cities Exposed: Industries and ICS
Figure 9: Exposed OSs in the emergency services sector
Linux 2.6.x
Linux 3.x
Windows 7/8
Windows XP
25%
25%
25%
25%
TOTAL
8
8004000
Port:80
Port:443
Port:500
Port:4500
Port:21
Port:22
Port:23
Port:2000
Port:3389
Port:8080
Figure 10: Exposed ports in the emergency services sector

11 | US Cities Exposed: Industries and ICS
Figure 11: Exposed products in the emergency services sector
Healthcare
Organizations that belong to the healthcare sector were identied in the Shodan US scan data using
keywords such as “health,” “hospital,” “medical,” “medicine,” “pharmacy,” and so on. Please note that it
is not possible to get 100% coverage of all organizations that belong to the target sector using keyword
search alone. Our observations on exposed cyber assets in the healthcare sector are:
• Not many cyber assets were exposed in the healthcare sector, which is good news.
• Firewalls make up the bulk of exposed devices. Printer and webcam exposure numbers were small.
• Windows (7, 8, and XP) is the most commonly used OS.
• Organizations in the healthcare sector prefer using Microsoft IIS instead of Apache.
• Web servers that communicate over ports 80 (HTTP) and 443 (HTTPS) are commonplace.
• Shodan found multiple unpatched vulnerable servers running in these organizations.
Microsoft IIS HTTPD
SonicWALL firewall
HTTPD config
Apache HTTPD
MikroTik bandwidth-test
server
Apache Tomcat/Coyote
JSP engine
Allegro RomPager
Microsoft HTTPAPI
HTPPD
OpenSSH
Cisco IOS HTTP config
NGINX
51.78%
7.92%
7.10%
5.74%
5.60%
5.46%
4.78%
4.23%
3.70%
3.69%
TOTAL
732

12 | US Cities Exposed: Industries and ICS
Figure 12: Exposed device types in the healthcare sector
Figure 13: Cities with the highest number of exposed cyber assets in the healthcare sector
Firewall
Miscellaneous
security device
Router
Specialized device
Printer
Switch
WAP
Webcam
PBX
Miscellaneous
storage device
69.10%
11.26%
5.66%
5.25%
3.95%
2.24%
1.18%
0.65%
0.36%
0.35%
TOTAL
1,696
2.5K1.25K0
Cambridge
New York
Collegeville
Houston
Detroit
Phoenix
Ann Arbor
Bethesda
Waukegan
Rockville
13 | US Cities Exposed: Industries and ICS
Figure 14: Exposed OSs in the healthcare sector
Windows 7/8
Linux 3.x
HP-UX 11.x
Windows XP
Linux 2.6.x
Linux 2.4−2.6
FreeBSD 8.x
Mac OS X 10.x
53.43%
13.43%
11.43%
8.86%
7.43%
4.00%
1.14%
0.29%
TOTAL
350
40K20K0
Port:80
Port:443
Port:500
Port:4500
Port:22
Port:3389
Port:25
Port:23
Port:8443
Port:8080
Figure 15: Exposed ports in the healthcare sector

14 | US Cities Exposed: Industries and ICS
Figure 16: Exposed products in the healthcare sector
Microsoft IIS HTTPD
Apache HTTPD
Microsoft HTTPAPI
HTTPD
Apache Tomcat/Coyote
JSP engine
Microsoft IIS
OpenSSH
NGINX
Cisco IOS HTTP config
SonicWALL firewall
HTTP config
IBM HTTP Server
46.21%
27.41%
7.38%
4.99%
4.66%
4.07%
1.81%
1.54%
1.07%
0.86%
TOTAL
46,292
Figure 17: Exposed vulnerable products in the healthcare sector
100500
Apache Tomcat/Coyote JSP engine
Apache HTTPD
Microsoft IIS HTTPD
Microsoft IIS
Squid HTTP proxy
Jetty
Bomgar Remote Access Portal
EZproxy Web proxy
Microsoft HTTPAPI HTTPD

15 | US Cities Exposed: Industries and ICS
Utilities
Organizations that belong to the utilities sector were identied in the Shodan US scan data using keywords
such as “power,” “water,” “electricity,” and so on. Please note that it is not possible to get 100% coverage
of all organizations that belong to the target sector using keyword search alone. Our observations on
exposed cyber assets in the utilities sector are:
• Exposed cyber assets are mostly located in small cities and towns; not in big cities.
• Firewalls, WAPs, webcams, and routers make up the bulk of exposed devices.
• Linux is the most commonly used OS.
• Organizations run a wide variety of Web servers; most are probably embedded.
• Web servers that communicate over ports 80 (HTTP) and 443 (HTTPS) are commonplace.
• Shodan found multiple unpatched vulnerable servers running in these organizations.
WAP
Firewall
Webcam
Router
Miscellaneous
security device
Specialized device
Miscellanous
storage device
Printer
PBX
VoIP phone
39.60%
37.06%
8.20%
7.32%
3.34%
1.45%
1.03%
0.70%
0.66%
0.64%
TOTAL
5,121
Figure 18: Exposed device types in the utilities sector

16 | US Cities Exposed: Industries and ICS
Figure 19: Cities with the highest number of exposed cyber assets in the utilities sector
6K3K0
Clarksville
Hopkinsville
Braintree
Ocala
Bismarck
Muscatine
Tahlequah
Shrewsbury
Fairfield
Granby
Figure 20: Exposed OSs in the utilities sector
Linux 2.6.x
Linux 3.x
Windows 7/8
Windows XP
Linux 2.4–2.6
HP-UX 11.x
Linux 2.4.x
OpenBSD 5.x
36.08%
23.92%
23.92%
6.67%
5.10%
2.35%
1.57%
0.39%
TOTAL
255

17 | US Cities Exposed: Industries and ICS
Figure 21: Exposed ports in the utilities sector
25K12.5K0
Port:80
Port:443
Port:22
Port:500
Port:23
Port:8080
Port:4500
Port:161
Port:21
Port:53
Microsoft IIS HTTPD
Apache HTTPD
Dropbear SSHD
micro_httpd
SonicWALL firewall
HTTPD config
Microsoft HTTPAPI
HTTPD
OpenSSH
Linksys wireless-G WAP
HTTP config
DD-WRT milli_httpd
Apache Tomcat/Coyote
JSP engine
25.44%
23.65%
15.20%
13.51%
6.31%
5.41%
2.96%
2.92%
2.39%
2.21%
TOTAL
23,979
Figure 22: Exposed products in the utilities sector

18 | US Cities Exposed: Industries and ICS
Figure 23: Exposed vulnerable products in the utilities sector
Financial
Organizations that belong to the nancial sector were identied in the Shodan US scan data using
keywords such as “bank,” “nancial,” “pension,” “insurance,” “mortgage,” and so on. Please note that it
is not possible to get 100% coverage of all organizations that belong to the target sector using keyword
search alone. Our observations on exposed cyber assets in the nancial sector are:
• New York City, the nancial hub of the US, has the highest number of exposed cyber assets.
• Firewalls make up the bulk of exposed devices. Printer and webcam exposure numbers are small.
• Windows (7, 8, and XP) is the most commonly used OS.
• Organizations in the nancial sector prefer to use Apache instead of Microsoft IIS.
• Web servers that communicate over ports 80 (HTTP) and 443 (HTTPS) are commonplace.
• Shodan found very few unpatched vulnerable servers running in these organizations.
157.50
Apache Tomcat/Coyote JSP engine
Apache HTTPD
DD-WRT milli_httpd
Microsoft IIS HTTPD
Sun GlassFish Open Source Edition
ChipPC Extreme HTTPD
Jetty
SonicWALL firewall HTTP config

19 | US Cities Exposed: Industries and ICS
Figure 24: Exposed device types in the nancial sector
Firewall
Miscellaneous
security device
Router
PBX
WAP
Switch
Specialized device
Printer
VoIP phone
Webcam
77.05%
16.42%
3.27%
0.92%
0.67%
0.50%
0.42%
0.34%
0.25%
0.16%
TOTAL
1,194
Figure 25: Cities with the highest number of exposed cyber assets in the nancial sector
15K7.5K0
New York
Austin
Concord
Dallas
Cleveland
Parsippany
Chicago
Omaha
Northbrook
Englewood

20 | US Cities Exposed: Industries and ICS
Figure 26: Exposed OSs in the nancial sector
Figure 27: Exposed ports in the nancial sector
Windows 7/8
Linux 3.x
Linux 2.6.x
Linux 2.4–2.6
HP-UX 11.x
Windows XP
FreeBSD 8.x
Linux 2.4.x
53.85%
29.49%
5.13%
3.85%
2.99%
2.99%
1.28%
0.42%
TOTAL
234
50K25K0
Port:80
Port:443
Port:500
Port:4500
Port:22
Port:21
Port:81
Port:25
Port:3306
Port:53

21 | US Cities Exposed: Industries and ICS
Figure 28: Exposed products in the nancial sector
Apache HTTPD
Microsoft IIS HTTPD
Microsoft HTTPAPI
HTTPD
Apache Tomcat/Coyote
JSP engine
OpenSSH
MySQL
ProFTPD
Microsoft IIS
NGINX
Fortinet FortiGate 50B/
FortiWiFi 80C firewall
HTTP config
44.25%
36.22%
5.96%
3.22%
2.19%
2.17%
1.99%
1.77%
1.32%
0.92%
TOTAL
44,441
157.50
Microsoft IIS HTTPD
Apache Tomcat/Coyote JSP engine
Apache HTTPD
SonicWALL firewall HTTP config
Figure 29: Exposed vulnerable products in the nancial sector

22 | US Cities Exposed: Industries and ICS
Education
Organizations that belong to the education sector were identied in the Shodan US scan data using
keywords such as “education,” “university,” “college,” “school,” “research,” and so on. Please note that it
is not possible to get 100% coverage of all organizations that belong to the target sector using keyword
search alone. Our observations on exposed cyber assets in the education sector are:
• There are a lot of exposed cyber assets in the education sector. Philadelphia alone has more than
65,000 exposed devices.
• Printers, rewalls, and webcams make up the bulk of exposed devices.
• Windows (7, 8, and XP) is the most commonly used OS.
• Organizations in the education sector prefer to use Apache instead of Microsoft IIS.
• Web servers that communicate over ports 80 (HTTP) and 443 (HTTPS) are commonplace.
• Shodan found multiple unpatched vulnerable servers running in these organizations.
Figure 30: Exposed device types in the education sector
Printer
Firewall
Specialized device
Webcam
Print server
Router
Switch
Media device
WAP
VoIP phone
43.90%
20.89%
9.26%
8.71%
4.95%
3.51%
2.80%
2.47%
2.15%
1.36%
TOTAL
49,592

23 | US Cities Exposed: Industries and ICS
Figure 31: Cities with the highest number of exposed cyber assets in the education sector
80K40K0
Philadelphia
Seattle
Chicago
Los Angeles
Ann Arbor
Austin
Stillwater
Minneapolis
Highland
Buffalo
Windows 7/8
Linux 2.6.x
Linux 3.x
Windows XP
Linux 2.4–2.6
Linux 2.4.x
HP-UX 11.x
FreeBSD 8.x
FreeBSD 8.x–9.x
FreeBSD 9.x
55.01%
15.70%
15.55%
8.43%
1.71%
1.49%
0.63%
0.59%
0.49%
0.40%
TOTAL
12,960
Figure 32: Exposed OSs in the education sector

24 | US Cities Exposed: Industries and ICS
Figure 33: Exposed ports in the education sector
800K400K0
Port:80
Port:443
Port:22
Port:3389
Port:8080
Port:500
Port:1900
Port:5900
Port:21
Port:137
Figure 34: Exposed products in the education sector
Apache HTTPD
Microsoft IIS HTTPD
OpenSSH
Virata-EmWeb
Apple remote desktop
VNC
Microsoft HTTPAPI
HTTPD
Apache Tomcat/Coyote
JSP engine
NGINX
MySQL
Cisco IOS HTTP config
35.39%
21.05%
16.09%
6.91%
5.20%
5.18%
4.82%
2.87%
1.34%
1.15%
TOTAL
803,288

25 | US Cities Exposed: Industries and ICS
Figure 35: Exposed vulnerable products in the education sector
3501750
Apache Tomcat/Coyote JSP engine
Apache HTTPD
Microsoft IIS HTTPD
Fortinet FortiGate 50B
Allegro RomPager
SonicWALL firewall HTTP config
EZproxy Web proxy
Fnord HTTPD
Jetty
WatchGuard Firewall HTTP config

26 | US Cities Exposed: Industries and ICS
Exposed ICS Devices
ICS devices are used by municipalities and corporations to operate and maintain critical infrastructure that
provides essential services such as power generation, wastewater management, trafc control system
management, and others. “ICS devices are operated by means of an interconnected network of devices to
make automated and human-assisted decisions affecting the operation of attached mechanical actuators
and sensors. The critical nature of these systems, combined with lack of security focus, makes ICS
networks interesting and vulnerable targets for hackers.”
5
A short overview of ICS devices can be found
in the Appendix.
In this section, we present our ndings on exposed ICS devices that are essential to daily operations and
can perceptibly impact many if not all city residents.
Exposed ICS Protocols in Shodan
The list of communication protocols used in the ICS environment is very large. Most of these protocols
were designed for specic purposes (process, building, and power systems automation, etc.) and
developed by industry working groups so devices from different manufacturers can interoperate using
standardized communication protocols. Some proprietary protocols only work with equipment from the
manufacturers who designed them.
Communication protocols, sometimes called “eldbus,” describe a set of rules for device communication.
The eldbus approach eliminates the need for point-to-point wiring of the eld controllers with the
sensors and actuators. Fieldbus also has additional functionality such as eld device diagnostics and
control algorithms that reduce signal routing to the eld controller for every operation. The cornerstone
of interoperability is a standard communication protocol. EtherNet was the perfect solution in the early
1980s, but that alone was not sufcient to support the complexities of modern industrial networks.
6
Application layer functions such as data formatting were also required, which is why many ICS
communication protocols now use the Open Systems Interconnection (OSI) seven-layer protocol model.
Communication protocols vary mostly in terms of application layer features, although the physical layer
often determines performance. Fieldbus protocols that were originally developed for ICS devices include
Process Field Bus (PROFIBUS), DeviceNet, ControlNet, CANopen, Interbus, and Foundation Fieldbus.
27 | US Cities Exposed: Industries and ICS
Higher-level networking protocols that use the OSI seven-layer protocol model to work with many eldbus
protocols including Process Field Net (PROFINET), EtherNet/IP, EtherNet Powerlink, EtherNet for Control
Automation Technology (EtherCAT), MODBUS-IDA, and Sercos III.
To date, the Shodan crawler understands 15 ICS communication protocols
7
and scans for Internet-
exposed ICS devices that communicate using these. Shodan does this by scanning for the dedicated
port numbers assigned to the ICS protocols and searching for specic keywords in the returned banner
data. In this section, we present statistics on the top 4 ICS protocols (search hits >1,000) and the devices
that use these protocols discovered in the February 2016 Shodan US scan data. The results presented
are for all cities in the US.
MODBUS
MODBUS is one of the oldest ICS protocols. It was rst introduced in 1979 and uses serial communications
to interact with programmable logic controllers (PLCs). Simple and robust, it has since become the de
facto communication protocol in ICS environments. MODBUS is an application layer protocol based
on a client-server or request-reply architecture. There are two types of MODBUS implementations—
MODBUS Serial, which uses the High-Level Data Link Control (HDLC) standard for data transmission,
and MODBUS Transmission Control Protocol/Internet Protocol (TCP/IP), which uses the TCP/IP protocol
stack to transmit data.
8
MODBUS is an ideal protocol for Remote Terminal Unit (RTU) applications that
does wireless communications. For this reason, it is used in many oil and gas, and substation applications.
But MODBUS is not exclusively an industrial protocol; building, infrastructure, transportation, and energy
applications also make use of its features.
9
Devices manufactured by Modicon and Schneider Electric
make up the bulk of the MODBUS-enabled devices discovered by Shodan.
Figure 36: Top 10 locations where exposed MODBUS were found
100500
Fort Lauderdale
Houston
New York
Princeton
San Bruno
Los Angeles
Brooklyn
Philadelphia
Rochester
Petersburg

28 | US Cities Exposed: Industries and ICS
Figure 37: Exposed products that use MODBUS
BACnet
BACnet is a communication protocol for building automation and control (BAC) networks. It was designed
for communication by applications for heating, ventilating, and air-conditioning control (HVAC), lighting
control, building access control, and re detection.
10
BACnet is based on a “client-server” model of the
world; BACnet messages are called “service requests.” A client machine sends a service request to a
server machine that then performs the service and reports the result to the client. BACnet rules dene
everything from what kind of cable to use to how to form a particular request or command in a standard
way. The rules specically relate to the needs of building automation and control equipment (i.e., they
cover things such as how to ask for the value of a temperature, dene a fan operating schedule, or send
a pump status alarm).
11
Devices manufactured by Tridium and Trane make up the bulk of the BACnet-
enabled devices discovered by Shodan.
BMX P34 2020
BMX NOE 0100
171 CBU 98090
HMIGTO4310
SAS 140 NOE 771 01
SAS TSXETY4103
BMX NOE 0110
BMX PRA0100
BMX NOR 0200
PM5560
45.75%
24.76%
20.04%
2.08%
1.89%
1.70%
1.13%
1.13%
0.95%
0.57%
TOTAL
529
Figure 38: Top 10 locations where exposed BACnet were found
100500
Houston
Chicago
Miami
Minneapolis
Seattle
Pleasanton
San Jose
Los Angeles
New York
Boston

29 | US Cities Exposed: Industries and ICS
Figure 39: Exposed products that use BACnet
EtherNet/IP
The Common Industrial Protocol (CIP) is a set of services and messages for control, security,
synchronization, conguration, information, and so forth, which can be integrated into EtherNet networks
and the Internet. CIP has a number of adaptations providing intercommunication and integration for
different network types, namely, EtherNet/IP, an adaptation of CIP to TCP/IP; ControlNet, an integration
of CIP with Concurrent Time Domain Multiple Access (CTDMA) technologies; DeviceNet, an adaption
of CIP with Controller Area Network (CAN); and CompoNet, a version adapted to Time Division Multiple
Access (TDMA) technologies. EtherNet/IP is very versatile and PLCs that use it were found to be operating
wastewater systems, manufacturing and oil and gas equipment, food and beverage manufacturing lines,
chillers and cooling systems, sawmills, assembly and packaging lines, boilers and ovens, pumps and
valves, alarm notication systems, building automation controllers, conveyors, silo elevators, and bridge
operation systems. PLCs manufactured by Allen-Bradley make up the bulk of the devices discovered by
Shodan.
NiagaraAX Station
Tracer SC
LGR25
MACH-ProWebCom
DSM_RTR
MACH-ProCom
WC17
CV17
BASRT-B
PV17
38.57%
14.18%
9.41%
7.54%
6.43%
5.81%
5.71%
5.26%
3.84%
3.25%
TOTAL
2,891
30 | US Cities Exposed: Industries and ICS
Figure 40: Top 10 locations where exposed EtherNet/IP were found
30150
Perryton
Minneapolis
Pukwana
Lake Ariel
Lexington
Williston
Grant Park
Cambridge
Cape Girardeau
Akron
Figure 41: Exposed products that use EtherNet/IP
Rockwell
Automation/Allen-Bradley
OPTO-22
Red Lion Controls
Prosoft Technology
Real Time Automation
(C&ID)
Cisco Systems
Control Technology
Frick Controls (Division of
York International)
HMS Industrial Networks
Yokogawa Electric
95.06%
1.74%
0.87%
0.78%
0.39%
0.35%
0.30%
0.17%
0.17%
0.17%
TOTAL
2,302

31 | US Cities Exposed: Industries and ICS
Tridium Fox
Fox is a proprietary protocol that is part of the Niagara Framework developed by Tridium. The Niagara
Framework is a universal software infrastructure that allows building control integrators and mechanical
contractors to build custom Web-enabled applications for accessing, automating, and controlling smart
devices in real-time via a LAN or the Internet.
12
Tridium and BACnet are the two major building automation
control systems. Because Fox is used to communicate between devices without a driver, third-party
systems cannot communicate with Tridium systems. Architecturally, Fox sits at the application or transport
level of the TCP/IP stack. Fox uses ports 1911 and 4911 to communicate with fellow Tridium devices.
13
The Shodan crawler did not nd any product names for devices that use Fox but we can easily guess that
Tridium will be their primary manufacturer.
Figure 42: Top locations where exposed Tridium devices were found
Exposed HMIs in Shodan
Shodan has an image search database
14
for browsing screenshots it has collected. Screenshots are
collected from three different sources—Virtual Network Computing (VNC) devices, Real Time Streaming
Protocol (RTSP) systems, and webcams. We searched Shodan Images for examples of HMIs (from
around the world, not US only) that were exposed on the Internet. In this section, we present some of the
more interesting HMI screenshots that we collected. An important consideration to keep in mind is that
an exposed HMI does not mean the system was compromised, rather it was poorly congured. On the
ipside, by virtue of being exposed on the Internet, the system is vulnerable to compromise.
5002500
Houston
Denver
Chicago
Seattle
Indianapolis
Columbia
Minneapolis
Charlotte
Lincoln
Salt Lake City

32 | US Cities Exposed: Industries and ICS
Figure 43: Exposed HMIs discovered in Shodan Images
The screenshots show exposed HMIs for a milling machine, a roller press, a water treatment plant, a
conveyor belt, a power converter, and an air-handling system. Shodan explicitly searches for exposed
ICS devices by looking for ports and other metadata unique to ICS communication protocols. Given
that Shodan is a public search engine, anyone can access information about exposed ICS devices on it.
Someone with nefarious intentions can easily abuse this information to attack exposed ICS devices.
Attacks Against Exposed ICS Devices
Kyle Wilhoit wrote two research papers in 2013 that studied attacks against Internet-exposed ICS devices.
Kyle created both virtual and physical ICS/supervisory control and data acquisition (SCADA) honeypots
and studied attacks against them. We present Kyle’s ndings here to show that Internet-exposed ICS
devices are under constant threat of cyber attacks.
15, 16

33 | US Cities Exposed: Industries and ICS
The current state of SCADA deployments has not varied much from 30 years ago; they have not improved
in terms of information security. From software development to server deployment, information security
is often an afterthought in SCADA environments. Security in an ICS/SCADA network is often considered
“bolt-on” or thought of “after the fact.” Early on, physical isolation addressed the need for security, but
modern Internet-connected devices have made physical isolation obsolete.
Controllability Observability Operability
Inability to bring the process or
system into a desired state
Inability to measure state and
maintain situational awareness
Inability of a device to achieve
acceptable operations
Examples
Control network not in a
controllable state
Inability to monitor sensors
(data integrity loss and/or loss of
availability)
Inability to maintain optimal
operations while under attack
There is no longer a control
sequence that can bring a system
to an intended state
Untrustworthy measurement (data
has lost veracity)
The physical device has been
damaged (e.g., motor burnt out,
gear teeth ground down, pressure
vessel burst, etc.)
The sequence of control
commands is unknown to an
operator (because it has been
altered or potentially altered)
Measurement of all necessary
quantities at the right locations is
no longer possible
Inability to safely shut down
The actuator has lost connectivity
or power
Inability to interpret
measurements (e.g., changing the
language of alerts)
Multiple operators working
against each other through the
same control channel
Table 1: Major setbacks that can result from a cyber attack against ICS devices
17
(from “From Ukraine to
Pacemakers! The Real-World Consequences of Logical Attacks”)
Majority of the risks for SCADA/ICS environments lie with HMIs and Data Historians. Traditional Web
application vulnerabilities such SQL injections and cross-site scripting (XSS) bugs can plague HMIs. They
are also affected by traditional server-side vulnerabilities (from Windows operating environments). HMI
threats are likely to be introduced via connections from insufciently secured demilitarized zones (DMZs)
or business networks to ICS environments. Accessing a Data Historian (that sits in the DMZ or business
network) can grant access to many systems. In some environments, Data Historians also function as
“clearinghouses” for commands issued to PLCs. Hackers can issue man-in-the-middle (MitM) commands
that modify PLC commands. While many ICS attacks have been publicized, many more have not been
disclosed, and even those that have been made public are not clearly understood. Many attacks remain
undisclosed because engineers are unable to differentiate between a cyber attack and a hardware or
software failure.
Hackers who targeted Kyle’s honeynet (a network of honeypots) rst searched on Shodan for specic
search terms. Apart from Shodan, hackers can also run numerous port scans for reconnaissance purposes.

34 | US Cities Exposed: Industries and ICS
These port scans are typically run on the rst 1,024 ports. Depending on their interests, hackers can then
expand their port scans to all 65,535 ports or scan dedicated ICS ports. In most cases, hackers do not
perform “slow scans” (i.e., scanning at a very slow rate to avoid drawing unwanted attention). Many
hackers also cluster their port scans. They do not get noticed because IT administrators do not closely
monitor rewall logs. Hackers also share their ICS device discoveries in text-based sharing platforms
such as Pastebin.
ICS attacks can be compared with traditional targeted attacks. Hackers perform reconnaissance on IP
addresses (targets and scans the netblock in which the device is located). This stage typically involves
port scanning of surrounding subnets. They ngerprint devices to nd out what OSs they run and other
relevant information. Hackers then attempt to identify unpatched vulnerabilities that can be exploited.
Once device access is gained, persistence and lateral movement are established. In the honeynet, hackers
attempted to exploit an HMI in addition to modifying MODBUS protocol trafc. The hackers attempted
to log in to secure areas using default credentials; failing this, they attempted dictionary attacks to guess
the password. HMIs implemented in the honeypot or honeynet had no built-in lockout mechanisms to
prevent repeated log-in attempts.
Figure 44: Country origin and attack targets from “The SCADA That Didn’t Cry Wolf:
Who’s Really Attacking Your ICS Equipment? (Part 2)”
In total, the honeynet observed 33,466 automated attacks from 1,212 unique IP addresses. Repeat
offenders (hackers) often came back at dedicated times on a 24-hour cycle and attempted to not only
exploit the same vulnerabilities present on the device, but also additional exploitation if they did not
succeed in prior attempts. It is not possible to determine how often attacks against true Internet-facing
ICS devices occur but we can safely assume that attacks against unprotected or semi-protected ICS
devices happen on a regular basis.

35 | US Cities Exposed: Industries and ICS
Defensive Strategies
Exposed cyber assets do not translate to compromise; rather, it means some device, system, or network
is poorly congured. On the ipside, by virtue of being exposed on the Internet, the device or system is
vulnerable to compromise. Cyber attack and data breach prevention strategies should be considered an
integral part of daily business operations. The key principle of defense is to assume compromise and take
countermeasures:
• Quickly identify and respond to ongoing security breaches
• Contain the security breach and stop the loss of sensitive data
• Preemptively prevent attacks by securing all exploitable avenues
• Apply lessons learned to further strengthen defenses and prevent repeat incidents
A strong security checklist includes:
• Securing the network infrastructure by:
º Segmenting networks according to function, department, geographic location, level of security,
or any other logical separation (taking contractors, third-party vendors, and others into account);
for ICS the Purdue Model for Control Hierarchy
18
identies different zones and levels of operations
that should be separated
º Implementing log analysis for threat detection and remediation, and building threat intelligence;
the data can be fed into Security Information and Event Management (SIEM) software and help
the response team understand ongoing attacks
º Properly congured user access proles, workstations, and servers, including Internet-connected
devices using the least-privilege model
• Protecting sensitive data via:
º Data classication by determining the sensitivity of data sets and establishing different access
and processing guidelines for each category
º Establishing endpoint-to-cloud protection through identity-based and cloud encryption

36 | US Cities Exposed: Industries and ICS
• Building a data protection infrastructure with multitiered access where sensitive tiers are in a
disconnected network, others require multifactor authentication, and others can remain on regular
le servers
• Building an incident response team consisting of technical, human resources, legal, public relations
personnel, and executive management
• Building internal and collecting external threat intelligence, acted upon by knowledgeable human
analysts who can determine through identifying patterns in attacker’s tools, tactics, and procedures
(TTPs) if an attack is ongoing inside the network
Ultimately, no defense is impregnable against determined adversaries. Having effective alert, containment,
and mitigation processes is critical. Companies should further look into fullling the Critical Security
Controls
19
best practice guidelines published by the Center for Internet Security. The CSC goes through
periodic updates to address new risks posed by an evolving threat landscape.
Public Safety Canada provides a recommended best practices guide for organizations using ICS devices.
20
A more detailed document on defensive strategies for ICS devices can also be found in the Trend Micro
Securing ICS Environments page.
21

37 | US Cities Exposed: Industries and ICS
Conclusion
By examining Shodan US scan data for February 2016, we proled exposed cyber assets in organizations
for six critical infrastructure sectors in the US—government, emergency services, healthcare, utilities,
nancial, and education. These sectors are essential to city operations and any disruption in one sector will
likely impact other sectors. There are many more critical sectors in addition to the six sectors we proled
that were not included in this report. Other critical sectors include transportation, communications, food,
and energy, among others. In the future, we aim to complete a comprehensive study that includes all of
the critical sectors and explores their interdependencies.
We found a lot of similarities in the exposed cyber-asset proles of the different critical sectors. Firewalls,
WAPs, webcams, and routers comprise the bulk of exposed devices. The exposed devices in our focus
sectors use Windows OS more than Linux. The top exposed server in the government, emergency
services, healthcare, and utilities sectors is Microsoft IIS while in the nancial and education sectors, it is
Apache HTTPD.
The cities with the highest number of exposed cyber assets are Lafayette, Louisiana for the government
sector; Houston, Texas for the emergency services sector; Cambridge, Massachusetts for the healthcare
sector; Clarksville, Tennessee for the utilities sector; New York City, New York by a huge margin for the
nancial sector; and Philadelphia, Pennsylvania for the education sector. This is a very interesting and
unpredictable mix of cities; while it is not surprising that New York City has the highest number of exposed
cyber assets in the nancial sector, one would assume Washington DC would logically trump Lafayette for
the highest number of exposed government assets. For the utilities sector, we found that exposed cyber
assets are mostly located in small cities and towns; not in big cities.
We also proled exposed ICS devices and found that the top 4 ICS protocols are MODBUS, BACnet,
EtherNet/IP, and Tridium Fox. We also discovered many exposed HMIs used for controlling ICS devices
from around the world, which means that they were improperly congured and not well protected. We
know from previous Trend Micro FTR research papers and real-world incidents that attacks against ICS
devices are a reality and ICS device owners should not be directly connecting these devices to the
Internet.
Overall, the large volume of exposed cyber assets from the different sectors suggests that even if it
is relatively easy to secure a connected device, many device owners still fail to do so. Organizations,
especially those considered to be part of critical infrastructure sectors, must always operate on the
assumption that they have already been compromised and take steps to both detect and defend against
threat actors.

38 | US Cities Exposed: Industries and ICS
Appendix
Critical Infrastructure Dependencies
As previously mentioned, there is a signicant overlap between a city’s critical infrastructure and national
critical infrastructure. Instead of studying exposed cyber assets from a national critical infrastructure
perspective, we chose to focus on exposed cyber assets that can impact daily city operations. Whether
we are studying the problem from a national or municipal level, what remains constant are the mutual
interdependencies between critical infrastructure. This is a very important and complex topic that is
not very well understood and yet can perceptibly affect many if not all people within the economy. To
better understand the potential risks associated with exposed cyber assets in critical sectors such as
government, healthcare, and nance, among others, we rst need to understand their interdependencies.
In this section, we present material from Tyson Macaulay’s book, “Critical Infrastructure—Understanding
Its Component Parts, Vulnerabilities, Operating Risks, and Interdependencies,” which explores critical
infrastructure interdependencies.
22
The book denes “critical infrastructure” as “organizations delivering goods and services in an economy
that is fundamental to the functioning of society and the economy.” Critical infrastructure have mutual
interdependencies; the impact on one will be felt by others. Information about interdependencies between
critical infrastructure is considered highly sensitive and not readily available to the public. Indicators of
interdependencies could be either econometric or data-dependency metrics—all sectors spend and
manage money; all sectors send and receive information. Money and data are the lowest common
denominators of modern economies and critical infrastructure sectors so it makes perfect sense to study
critical infrastructure interdependencies using these two metrics.
First-order impacts are the direct effects of an incident on an entity, whether this is physical (earthquake,
re, etc.) or logical (software bugs, data loss, network failure, etc.). Second-order impacts are the bread
and butter of interdependency analysis; they reect what happens as a cascading result of rst-order
impacts. How are the risks of the impact on the rst entity conducted outward to the client base or supply
chain? Second-order impacts are likely to arrive in the form of a completely distinct threat or risk from the
original rst-order impact. A tertiary impact is basically a second-order impact of a second-order impact.
For example, a re in a rst entity results in the failure of services to arrive at a second entity, which
slows down its production and forces cancellation of some just-in-time deliveries that ultimately results
in shortage of perishable hospital supplies. Some critical infrastructure are so interlinked with adjacent
ones within the same sector or different sectors that impacts can conduct from one to the other almost
seamlessly, disregarding national or state borders (e.g., oil production and oil transportation via pipelines,
electricity generation, and the transmission grid).

39 | US Cities Exposed: Industries and ICS
Using sector input (use or buying) and output (make or selling) dollar gures, input-output (I-O) ratios
have been calculated for nine critical infrastructure in the US (energy, communications, nancial,
health, food, water, transportation, safety or government, and manufacturing). Please refer to the book,
“Critical Infrastructure—Understanding Its Component Parts, Vulnerabilities, Operating Risks, and
Interdependencies,” chapter 2, Econometrics and Critical Infrastructure Interdependency, for raw data
and calculation details of the I-O ratios.
Energy Communications Financial Healthcare Food Water Transportation Government Manufacturing
Energy
1 1.845 1.185 ∞ 365.092 123.101 1.902 ∞ 6.5
Communications
0.542 1 1.055 11733.65 4648.75 0.051 1.788 ∞ 2.37
Financial
0.844 0.948 1 101300 168451.3 0.297 1.471 ∞ 2478.835
Healthcare
0 0 0 1 0 0 0.009 ∞ 0
Food
0.003 0 0 ∞ 1 0 0.026 ∞ 0.123
Water
0.008 19.757 3.367 ∞ 38024.09 1 0.026 ∞ 10.923
Transportation
0.526 0.559 0.649 109.494 38.144 38.29 1 ∞ 1.969
Government
0 0 0 0 0 0 0 ∞ ∞
Manufacturing
0.154 0.422 0 ∞ 8.103 0.092 0.508 ∞ 1
Table 2: US sector dependency I-O ratios from “Critical Infrastructure—Understanding Its Component
Parts, Vulnerabilities, Operating Risks, and Interdependencies,” chapter 2, page 83
• An I-O ratio of <0.5 means the sector in the adjacent column is strongly independent (i.e., sells much
more than it spends with a given sector in the adjacent row).
• An I-O ratio of >0.5 but <1.0 means the sector in the adjacent column is somewhat independent (i.e.,
sells more than it spends with a given sector in the adjacent row).
• An I-O ratio of >1.0 but <1.5 means the sector in the adjacent column is somewhat dependent (i.e.,
sells less than it spends with the sector in the adjacent row).
• An I-O ratio of >1.5 means the sector in the adjacent column is strongly dependent (i.e., sells much
less than it spends with the sector in the adjacent row).
• ∞ is indicated where the output to the sector is zero.

40 | US Cities Exposed: Industries and ICS
Using these econometric I-O ratios, the following critical infrastructure dependency graph was generated.
Figure 45: US critical infrastructure dependency ow according to I-O metrics from “Critical
Infrastructure—Understanding Its Component Parts, Vulnerabilities, Operating Risks, and
Interdependencies,” chapter 2, page 100
Relationships are organized starting with the sector with the lowest sum of I-O ratios while the strongest
dependency is indicated by arrows. One-to-one intensity is based on the sectors with the fewest negative
dependency relationships (an I-O ratio of >1), tracing according to which sectors have the strongest overall
I-O dependency with the top sector (an I-O ratio of <1). The graph indicates at least one important piece
of information about critical infrastructure interdependency and risks in the US—from an I-O assessment
perspective, energy is the top critical infrastructure. A failure in the energy sector will most likely directly
impact at least ve other sectors, and the other remaining three sectors through the possibility of cascading
failures.
Over 4,000 distinct data dependency metrics were gathered from nine critical infrastructure stakeholders
in the US (energy, communications, nance, health, food, water, transportation, safety or government,
and manufacturing) around interdependency within critical infrastructure sectors. These data dependency
metrics were used to calculate inbound-outbound data ratios similar to the econometric I-O ratios
discussed earlier. Please refer to the book, “Critical Infrastructure—Understanding Its Component Parts,
Vulnerabilities, Operating Risks, and Interdependencies,” chapter 3, Information and Data Dependency
Analysis, for raw data and calculation details of the inbound-outbound data ratios. Using the inbound-
outbound data ratios, the following critical infrastructure dependency graph was generated.
Energy
Comms
& IT
Healthcare
Food
Finance
Safety/
Government
Transport
Water
Manufacturing

41 | US Cities Exposed: Industries and ICS
Figure 46: US critical infrastructure dependency ow according to inbound-outbound data ratios from
“Critical Infrastructure—Understanding Its Component Parts, Vulnerabilities, Operating Risks, and
Interdependencies,” chapter 3, page 139
The graph shows potential routes of cascading impacts when the sector with the largest outbound rating
is placed at the top, and the sectors with the strongest relationship to the top sector are subsequently
placed beneath. Below those points are the sectors with the strongest relationships with the “second-
level” seconds. One-to-one intensity is based on the sectors with the fewest negative dependency
relationships (an inbound-outbound ratio of >1), tracing downward according to which sectors have the
most positive overall inbound-outbound dependency (an inbound-outbound ratio of <1). From the graph,
we observe that the government sector has no negative dependency relationships. The government and
nance sectors were among the top critical infrastructure sectors in terms of criticality of information and
data to other sectors.
The common threads that bind all critical infrastructure are money and information ows, both of which
are incubated in cyberspace. It thus follows that threats to the fabric of cyberspace conduct risks across
all sectors. These exposures precipitate both logical and physical impacts. Cyberspace threats to critical
infrastructure are exacerbated by the convergence of the globalization of supply chains, the introduction
of disruptive technologies, and the criminalization of cyberspace.
Healthcare
Safety
Government
FinanceTransport
Food
Energy
Water ManufacturingCommunications

42 | US Cities Exposed: Industries and ICS
Overview of ICS Devices
“ICS” is a general term that encompasses several types of control systems, including SCADA systems,
Distributed Control Systems (DCSs), and other control system congurations such as skid-mounted
PLCs often found in the industrial sector and critical infrastructure. ICS devices are typically used in
industries such as electrical, water and wastewater, oil and natural gas, mining, chemical, transportation,
pharmaceutical, pulp and paper, food and beverage, and discrete manufacturing (e.g., automotive,
aerospace, and durable goods).
23
The actual implementation of an ICS environment may be a hybrid of DCS and SCADA systems,
incorporating attributes from both. DCS and PLC controlled systems are generally found in factory or
plant-centric areas, whereas SCADA systems are geographically dispersed, often in remote locations.
DCS and PLC use high-speed LAN for communication whereas SCADA systems are designed for long-
distance communication and can handle transmission delays and data loss. DCS and PLC systems
employ a greater degree of closed-loop (feedback) control compared to SCADA systems because the
industrial processes they control need constant monitoring to reduce errors and prevent disruptions. The
basic operations of an ICS environment are shown in the following diagram.
Figure 47: Basic ICS operations from the
National Institute of Standards and Technology (NIST)’s“Guide to ICS Security”
Human Machine
Interface (HMI)
Remote Diagnostics
and Maintenance
Controller
Actuators Sensors
Process
Outputs
Process
Intputs
Controlled
Variables
Manipulated
Variables
Controlled Process
Disturbances
Set Points,
Control Algorithms,
Parameter Constraints,
Process Data

43 | US Cities Exposed: Industries and ICS
The main components are:
• Control loop: Consists of sensors for measurement; controller hardware such as PLCs; actuators such
as control valves, breakers, switches, and motors; and the communication of variables. Controlled
variables are transmitted to the controller from the sensors. The controller interprets these signals,
generates manipulated variables in response to the received set points, and transmits them to the
actuators.
• HMIs: Graphical user interface (GUI)-based applications for interacting with the controller hardware.
The operator uses an HMI to monitor and congure set points, control algorithms, and adjust and
establish parameters in controllers. The HMI also displays status information and historical data.
• Remote diagnostics and maintenance: Used to identify, prevent, and recover from abnormal
operations or failures.
Other important components of an ICS environment are:
• Control server: Hosts the DCS or PLC supervisory control software that communicates with lower-
level control devices. The control server accesses subordinate control modules over an ICS network.
• SCADA server or master terminal unit (MTU): Acts as the master in a SCADA system. Remote
terminal units and PLCs located in remote eld sites act as slaves.
• Remote terminal unit (RTU): A special-purpose data acquisition and control unit designed to support
SCADA remote stations. RTUs are often equipped with wireless radio interfaces to support remote
situations where wired communication is unavailable. Sometimes, PLCs are implemented as eld
devices to serve as RTUs.
• Intelligent Electronic Device (IED): A “smart” sensor or actuator containing the intelligence required
to acquire data, communicate with other devices, and perform local processing and control. The use
of IEDs in SCADA and DCS systems allows for automatic control at the local level.
• Data Historian: A centralized database for logging all process information within an ICS environment.
This data is used for process analysis, statistical process control, and enterprise level planning.
• I/O server: A control component responsible for collecting, buffering, and providing access to process
information collected from PLCs, IEDs, and RTUs. An I/O server can reside on the control server or a
separate machine. I/O servers are also used for interfacing with third-party control components such
as an HMI or a control server.

44 | US Cities Exposed: Industries and ICS
Wired, wireless, or hybrid (wireless-wired), is an important component of the ICS environment. ICS
environments use different network topologies, depending on the requirements of control systems.
Control networks are integrated with a corporate network to give enterprise-level decision-makers access
to production and operations data. ICS environments use Internet-based IT and enterprise integration
strategies to merge control and corporate networks. The main components of an ICS network are:
• Fieldbus network: Links sensors and actuators to a PLC or other controllers. Fieldbus networks
eliminate the need for point-to-point wiring between a controller and sensors or actuators. Devices
communicate with controllers using protocols such as Probus, MODBUS, ControlNet, P-Net, and
others.
• Control network: Connects the supervisory control to lower-level control modules.
• Communication routers: Network devices that forward data packets between computer networks.
Routers are used to connect MTUs and RTUs to long-distance network media for SCADA
communication, connect ICS servers to a LAN or a Wide Area Network (WAN), and others.
• Firewalls: Network devices that lter trafc between two or more networks. In an ICS environment,
rewalls are used to manage network segregation strategies.
• Modems: Network devices that enable computers to transmit data over telephone or cable connections.
The modem modulates and demodulates analog carrier signals for encoding and decoding digital
information. Modems are used in SCADA systems to enable long-distance serial communications
between MTUs and remote eld devices. They are also used in SCADA systems, DCS, and PLCs for
gaining remote access for operational and maintenance functions.
• Remote access points: Distinct devices, areas, and locations of a control network for remotely
conguring control systems and accessing process data.
Determining ICS Device Functions
Looking at exposed ICS devices in Shodan, it quickly becomes apparent that the platform has plenty
of device data but insufcient information about their functions (i.e., what is the device function?). For
completeness of the discussion, we present research done by Major Paul M. Williams for his MSc Thesis at
the Air Force Institute of Technology on a noninvasive method for distinguishing the function of ICS devices
based on returned PLC programming information.
The goal of Major Williams’s research was to devise a non-invasive method for distinguishing Internet-facing
ICS devices that control processes without impacting PLC task execution times. “Impact” is dened as a
statistically signicant increase in execution time. Collecting PLC code from Internet-facing ICS devices
must not impact their operations, as that might cause injury and damage. While no known serious attacks
to date have been attributed to Shodan, it can serve as an anonymous reconnaissance platform that can
facilitate targeting ICS devices for hackers with both the desire and capability to carry out attacks.

45 | US Cities Exposed: Industries and ICS
Figure 48: Process to distinguish Internet-facing ICS devices from “Distinguishing Internet-Facing ICS
Devices Using PLC Programming Information,” page 26
RSLogix 5000 is a software application from Allen-Bradley that provides programming, control, and
troubleshooting services for their PLCs. It communicates with PLCs using EtherNet/IP, which adapts
CIP to standard EtherNet. It uploads PLC code to a device by making several CIP requests for Class
and instance values for Task, Program, Routine, and Tag. By reverse-engineering CIP requests using
WireShark, it is possible to spoof CIP requests by replicating certain parts of the upload process and
obtain PLC code without using RSLogix. Once the PLC code is obtained, it is manually inspected and
each response is categorized based on attributes found in the code using a list of process control terms
commonly used across multiple critical infrastructure sectors. PLC code containing process control terms
indicate that the device likely controls a physical industrial process.
Yes
Yes
No
No
Yes
No
Retry Request
Request PLC Code
for Each Device
Parse CIP Data
Fields to Collect
PLC Code
List of Process
Control Terms
List of Internet-
Facing ICS Devices
Indeterminate
Device Pool
Process Control
Device Pool
Is Code
Returned?
Connection
Error?
Code and
Terms Match?

46 | US Cities Exposed: Industries and ICS
Of the 154 Internet-connected PLCs queried, 91 were identied as process control devices and 63 were
identied as indeterminate (refer to the owchart above). EtherNet/IP is very versatile and PLCs that use
it were found to be operating wastewater systems, manufacturing equipment, oil and gas equipment,
food and beverage manufacturing lines, chillers and cooling systems, sawmills, assembly and packaging
lines, boilers and ovens, pumps and valves, alarm notication systems, building automation controllers,
conveyors, silo elevators, and bridge operation systems. Lack of EtherNet/IP and CIP authentication
allows the scripts used in this research to send CIP commands to any Internet-connected PLC for
execution. An ICS application layer protocol with security features such as built-in authentication would
dramatically increase the security of any ICS device that are discoverable online via Shodan or similar
search engines. Future research can expand the scope of PLCs tested to determine if the results of this
research’s success translates to other manufacturers’ devices.
In our research on exposed ICS devices, we did not attempt to determine their functions because it would
be outside the scope of the study. We included Major Williams’s research in this write-up to demonstrate
that it is indeed possible to determine the functions of exposed ICS devices. Hackers targeting ICS
infrastructure can use these and similar techniques to determine functions so they can more effectively
exploit the devices.

47 | US Cities Exposed: Industries and ICS
References
1. Numaan Huq, Stephen Hilt, and Natasha Hellberg. (2017). Trend Micro Security News. “US Cities Exposed.” Last accessed on
15 February 2017, http://www.trendmicro.com/vinfo/us/security/news/internet-of-things/us-cities-exposed.
2. United Nations (UN). (10 July 2014). United Nations. “World’s Population Increasingly Urban with More Than Half Living in
Urban Areas.” Last accessed on 25 September 2016, http://www.un.org/en/development/desa/news/population/world-
urbanization-prospects-2014.html.
3. US Department of Commerce. (2017). US Census Bureau. “US Census Bureau: FAQs.” Last accessed on 25 September 2016,
https://ask.census.gov/faq.php?id=5000&faqId=5971.
4. Wikimedia Foundation Inc. (4 January 2017). Wikipedia. “List of Metropolitan Statistical Areas.” Last accessed on 25 September
2016, https://en.wikipedia.org/wiki/List_of_Metropolitan_Statistical_Areas.
5. Paul M. Williams. (28 May 2014). Air Force Institute of Technology. “Distinguishing Internet-Facing ICS Devices Using PLC
Programming Information.” Last accessed on 24 September 2016, https://www.hsdl.org/?view&did=757013.
6. Alexandra Dopplinger. (21 June 2007). EE Times. “Why So Many Industrial Network Protocols?” Last accessed on 26 April
2016, http://www.eetimes.com/document.asp?doc_id=1274052.
7. Shodan. (2013−2017). Shodan. “ICS.” Last accessed on 4 January 2017, https://www.shodan.io/explore/category/industrial-
control-systems.
8. Miguel Collantes and Antonio Padilla. (May 2015). INCIBE. “Protocols and Network Security in ICS Infrastructures.” Last
accessed on 26 April 2016, https://www.incibe.es/extfrontinteco/img/File/intecocert/ManualesGuias/incibe_protocol_net_
security_ics.pdf.
9. MODBUS. (2016). MODBUS. “MODBUS FAQ.” Last accessed on 5 October 2016, http://www.modbus.org/faq.php.
10. Wikimedia Foundation Inc. (12 April 2016). Wikipedia. “BACnet.” Last accessed on 26 April 2016, https://en.wikipedia.org/wiki/
BACnet.
11. BACnet. (October 1998). BACnet.org. “BACnet: Answers to Frequently Asked Questions.” Last accessed on 5 October 2016,
http://www.bacnet.org/FAQ/HPAC-3-97.html.
12. Wikimedia Foundation Inc. (4 November 2015). Wikipedia. “Tridium.” Last accessed on 27 September 2016,
https://en.wikipedia.org/wiki/Tridium.
13. Phil Zito. (12 May 2013). Building Automation Monthly. “What Is Tridium Part 1.” Last accessed on 5 October 2016.
http://buildingautomationmonthly.com/what-is-tridium/.
14. Shodan. (2017). Shodan Account. “Welcome.” Last accessed on 4 January 2017, https://account.shodan.io/
login?continue=http%3A%2F%2Fimages.shodan.io%2F.
15. Kyle Wilhoit. (15 May 2013). Trend Micro Security Intelligence. “Who Is Really Attacking Your ICS Devices?” Last accessed on
26 September 2016, http://www.trendmicro.com/cloud-content/us/pdfs/security-intelligence/white-papers/wp-whos-really-
attacking-your-ics-equipment.pdf.
16. Kyle Wilhoit. (27 August 2013). Trend Micro Security Intelligence. “The SCADA That Didn’t Cry Wolf: Who’s Really Attacking
Your ICS Equipment? (Part 2).” Last accessed on 26 September 2016, http://www.trendmicro.com/cloud-content/us/pdfs/
security-intelligence/white-papers/wp-the-scada-that-didnt-cry-wolf.pdf.
17. Éireann Leverett and Marie Moe. (March 2016). RSA Conference 2016. “From Ukraine to Pacemakers! The Real-World
Consequences of Logical Attacks.” Last accessed on 21 September 2016, https://www.rsaconference.com/writable/
presentations/le_upload/hta-f03-from_ukraine_to_pacemakers_the_real-world_consequences_of_logical_attacks.pdf.

48 | US Cities Exposed: Industries and ICS
18. Cisco. (10 December 2013). Cisco. “Converged Plantwide Ethernet (CPwE) Design and Implementation Guide.” Last accessed
on 7 January 2017, http://www.cisco.com/c/en/us/td/docs/solutions/Verticals/CPwE/CPwE_DIG/CPwE_chapter2.html.
19. CIS. (2016). CIS. “CIS Controls for Effective Cyberdefense.” Last accessed on 7 January 2017, https://www.cisecurity.org/
critical-controls/.
20. Public Safety Canada. (2 December 2015). Government of Canada. “ICS Cybersecurity: Recommended Best Practices.” Last
accessed on 4 May 2016, https://www.publicsafety.gc.ca/cnt/rsrcs/cybr-ctr/2012/tr12-002-en.aspx.
21. Numaan Huq. (15 February 2017). Trend Micro Security News. “Defensive Strategies for Industrial Control Systems.” Last
accessed on 15 February 2017, http://www.trendmicro.com/vinfo/us/security/news/cyber-attacks/defensive-strategies-for-
industrial-control-systems.
22. Tyson Macaulay. (2009). “Critical Infrastructure—Understanding Its Component Parts, Vulnerabilities, Operating Risks, and
Interdependencies.”
23. Keith Stouffer, Joe Falco, and Karen Scarfone. (June 2011). NIST. “Guide to ICS Security.” Last accessed on 24 September
2016, http://nvlpubs.nist.gov/nistpubs/SpecialPublications/NIST.SP.800-82.pdf.

©2017 by Trend Micro, Incorporated. All rights reserved. Trend Micro and the Trend Micro t-ball logo are trademarks or registered trademarks of
Trend Micro, Incorporated. All other product or company names may be trademarks or registered trademarks of their owners.
TREND MICRO
TM
Trend Micro Incorporated, a global cloud security leader, creates a world safe for exchanging digital information with its Internet content security and
threat management solutions for businesses and consumers. A pioneer in server security with over 20 years experience, we deliver top-ranked client,
server, and cloud-based security that ts our customers’ and partners’ needs; stops new threats faster; and protects data in physical, virtualized, and
cloud environments. Powered by the Trend Micro™ Smart Protection Network™ infrastructure, our industry-leading cloud-computing security technology,
products and services stop threats where they emerge, on the Internet, and are supported by 1,000+ threat intelligence experts around the globe.
For additional information, visit www.trendmicro.com.
Created by:
The Global Technical Support and R&D Center of TREND MICRO
www.trendmicro.com
