
1
Working from Home Around the Globe: 2023 Report
Cevat Giray Aksoy,
1
Jose Maria Barrero,
2
Nicholas Bloom,
3
Steven J. Davis,
4
Mathias Dolls
5
and Pablo Zarate
6
28 June 2023
Full-time employees worked from home 0.9 days per week, on average, looking across 34
countries in April-May 2023. This finding and other results in this report are based on data from
Wave 3 of the Global Survey of Working Arrangements (G-SWA).
1
As shown in Figure 1, work from home (WFH) levels are higher in English-speaking
countries. Full-time employees worked an average of 1.4 full paid days per week from home across
Australia, Canada, New Zealand, the UK and the US. By way of comparison, WFH levels average
only 0.7 days per week in the seven Asian countries covered by the G-SWA, 0.8 in the European
countries, and 0.9 for four Latin American countries and South Africa.
These averages hide some notable variation in WFH levels within the four country groups.
Among the English-speaking countries, average WFH days per week range from 1.0 in New
Zealand to 1.7 in Canada. In Europe, we find the lowest WFH incidence for Greece (0.5 WFH
days per week) and the highest values for Finland, Germany and the Netherlands (1.0 WFH days
per week). In Asia, WFH days range from 0.4 in South Korea to 0.9 in Singapore. In Latin
America, WFH days per week range from 0.8 in Mexico to 1.0 in Chile.
Figure 2 shows that 67 percent of full-time employees work five days per week on business
premises. 26 percent have hybrid arrangements, in which they split the workweek between home
and the employer’s premises. 8 percent of full-time employees work entirely from home.
We also asked our G-SWA respondents how often they would like to have paid workdays
at home (Figure 3), and how often their employer is planning for them to work full days at home
(Figure 4). There is a gap between the number of WFH days per week desired by employees and
planned by employers. While employees would like to work from on average 2.0 days per week
around the globe, employers only plan 1.1 WFH days per week. This gap is present in all 34
countries. It is largest in Latin America and South Africa, where employees would like to work on
average 1.3 days more from home than their employers plan for them. The gap is smallest in the
English-speaking countries, where it amounts to 0.7 days on average. The largest gaps are in
Argentina (1.6 days), Brazil (1.2) and Mexico (1.2), while the smallest ones are in Japan (0.2), the
Netherlands (0.3), and Denmark (0.4).
There is a gap between the desired and the actual number of WFH days among employees
with WFH experience (Figures 5 and 6). Figure 5 shows that 26 percent of respondents with WFH
experience during the COVID-19 pandemic would like to work from home 5 days per week. 56
percent would like to work in hybrid mode, that is, either 1 day per week from home (10 percent),
1
Aksoy et al. (2023ab) report results for Waves 1 and 2.

2
2 days (19 percent), 3 days (17 percent), or 4 days (9 percent). 19 percent prefer to work fully on
site. These numbers differ strongly from the actual number of WFH days among employees with
WFH experience. 46 percent currently work fully on site, 41 percent in hybrid mode, and 13
percent fully WFH.
We also asked our G-SWA respondents about the top benefits of working on their
employer’s business premises and of working from home, respectively (Figures 7 and 8).
Socializing with co-workers (named by 62 percent of respondents), face-to-face collaboration (54
percent) and clearer boundaries between work and personal time (43 percent) are perceived as the
top three benefits of working on the employer’s business premises. 60 percent of our G-SWA
respondents say that no commute is the top benefit of working from home. 44 percent of the
respondents view their savings on gas and lunch costs and 42 percent the flexibility over when
they work as top benefits of WFH.
The G-SWA is an online survey of full-time employees aged 20-64 who have completed
secondary or tertiary education. Sample sizes range from slightly more than 700 respondents in
New Zealand to more than 2,500 respondents in France, Germany, Italy, the UK and the US.
Conditional on the exclusion of persons who did not complete secondary school, our samples are
broadly representative of full-time employees in each country with respect to age, gender and
education. More information on the G-SWA including some summary statistics can be found in
the Appendix.
Acknowledgements: For the financial assistance that made it possible to conduct our Global
Survey of Working Arrangements (G-SWA), we gratefully acknowledge the European Bank for
Reconstruction and Development, the Asociación Mexicana de Cultura A.C., the Becker Friedman
Institute at the University of Chicago, the ifo Institute, King’s College London, the Smith
Richardson Foundation, and the Templeton Foundation. Views presented are those of the authors
and not necessarily of the European Bank for Reconstruction and Development (EBRD) or any
other organization.
Corresponding author: Mathias Dolls, ifo Institute [email protected]
1
European Bank for Reconstruction and Development and King’s College London
2
3
Stanford University [email protected],
4
University of Chicago Booth School of Business and
Hoover Institution [email protected],
5
ifo Institute [email protected], and
6
Princeton
University [email protected]
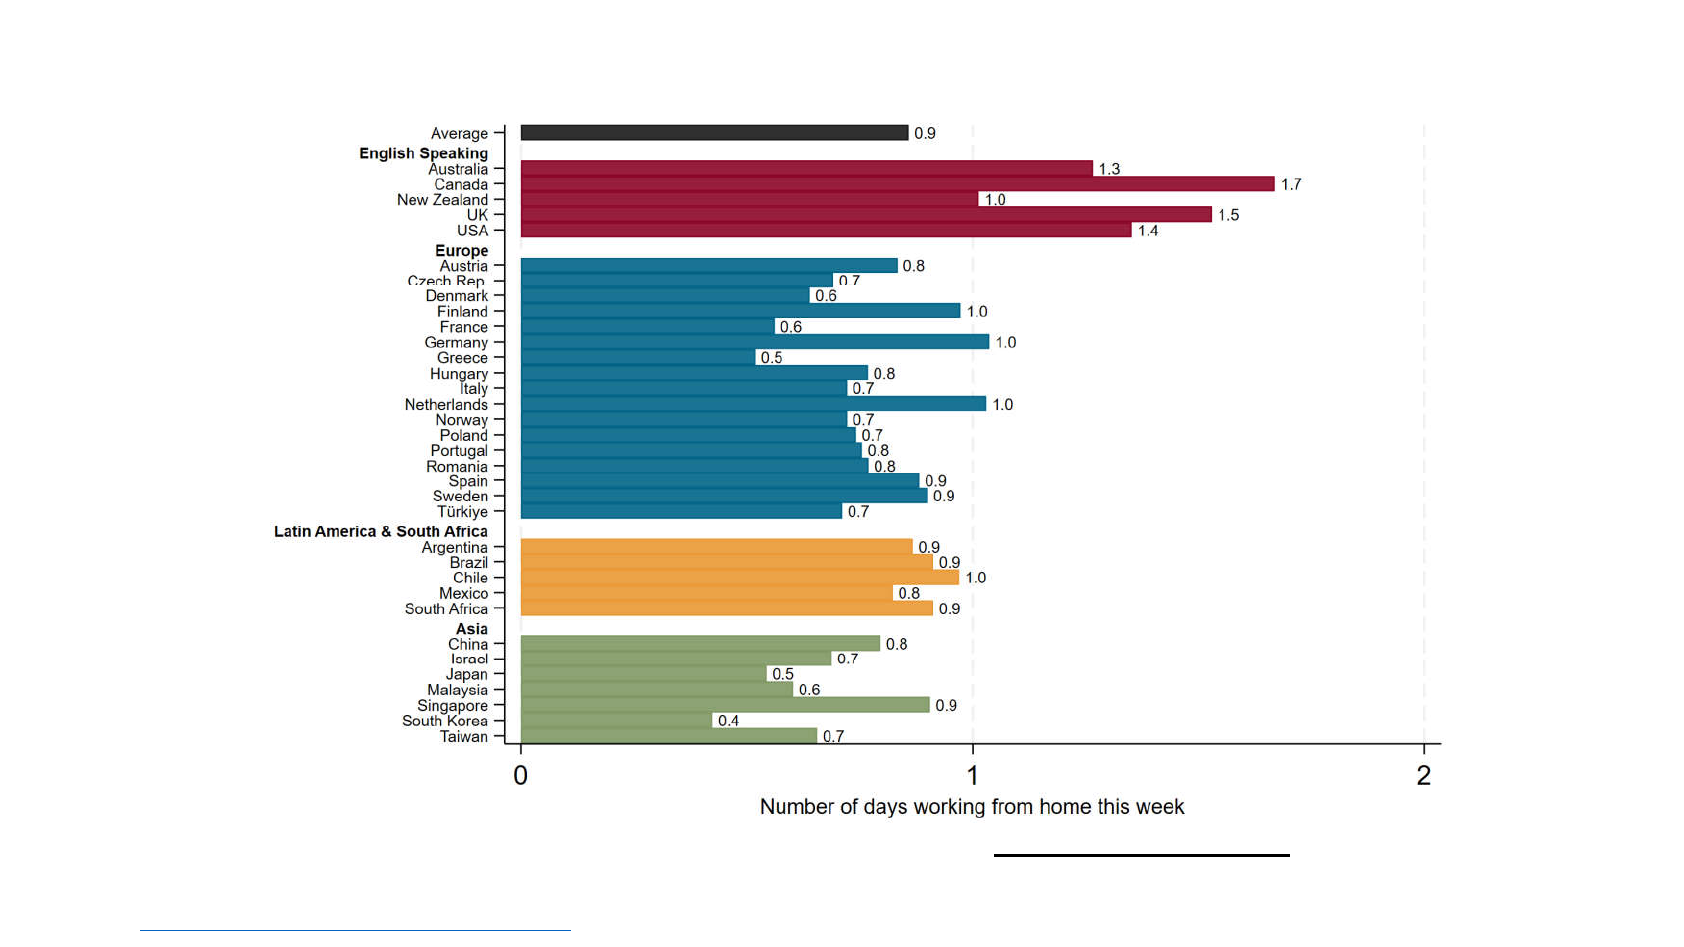
Figure 1: Paid Full Days Worked from Home per week (April-May 2023)
Note: Responses to the question “For each day last week, did you work 6 or more hours, and if so where?”.
Sample of N=42,426 workers in 34 countries surveyed in April-May 2023. All values are available at
https://bit.ly/Figures-GSWA-2023
3

Figure 2: Current Working Arrangement (April-May 2023)
Note: Among workers that worked 4 or more days during the survey reference week. Responses to the question
“For each day last week, did you work 6 or more hours, and if so where?”. Sample of N=39,021 workers in 34
countries surveyed in April-May 2023. All values are available at https://bit.ly/Figures-GSWA-2023
4
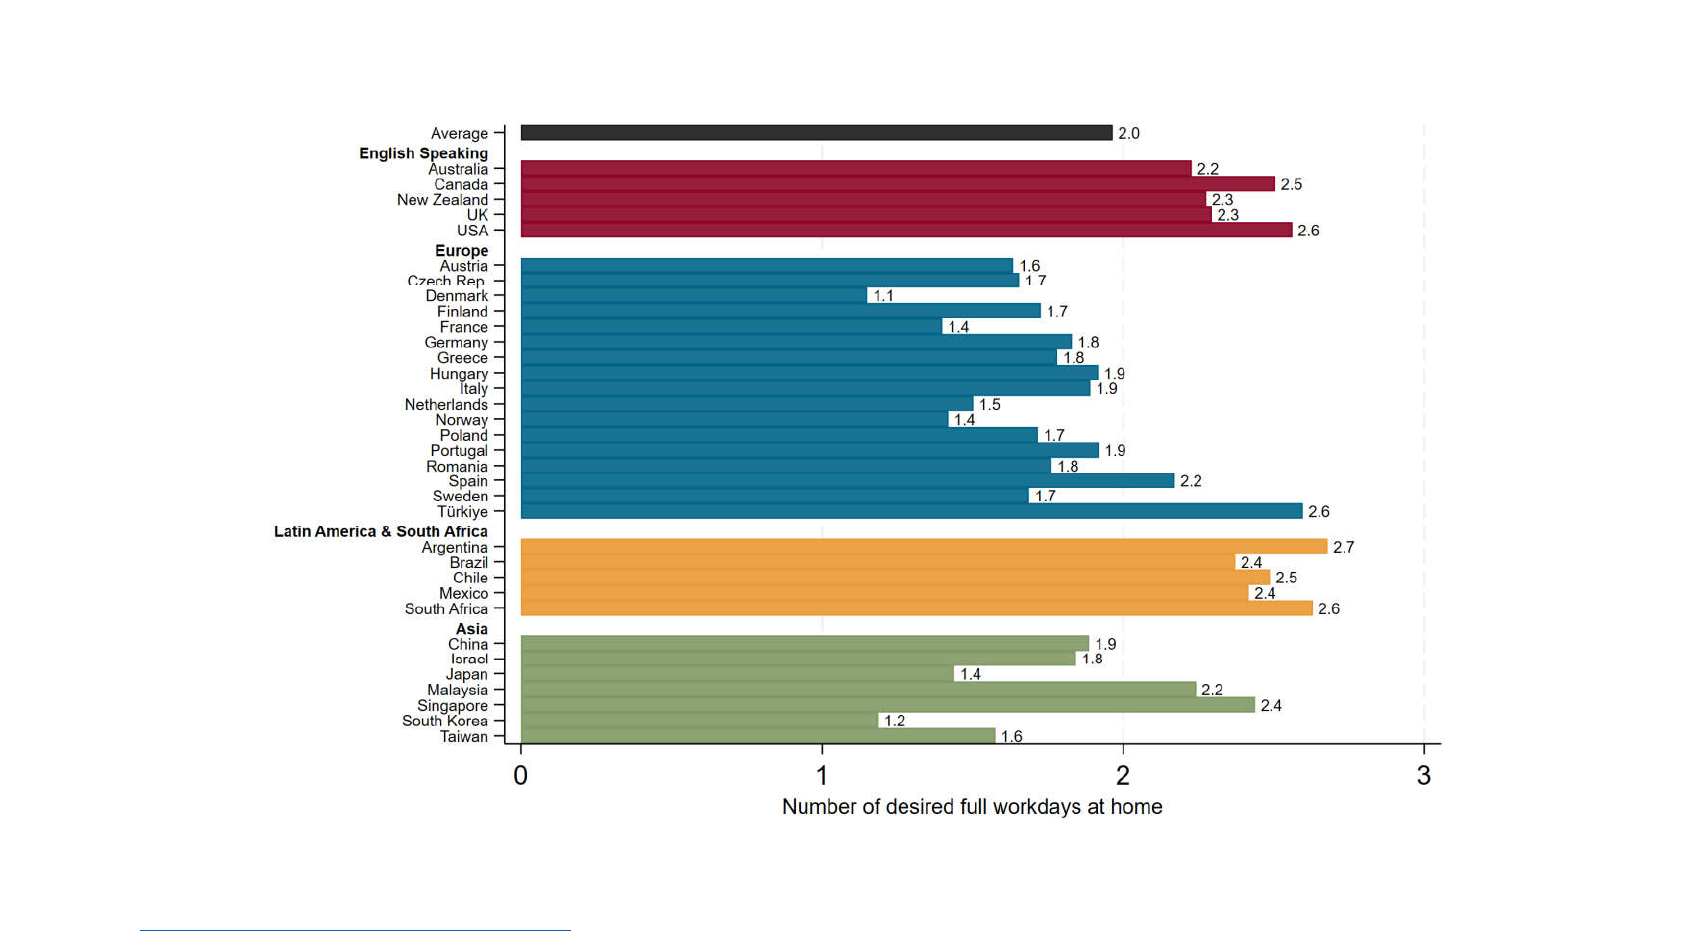
Figure 3: Average number of WFH days per week that employees desire
Note: Responses to the question “As the pandemic ends, how often would you like to have paid workdays at
home?”. Sample of N=42,426 workers in 34 countries surveyed in April-May 2023. All values are available at
https://bit.ly/Figures-GSWA-2023
5

Figure 4: Average number of WFH days per week that employers plan
Note: Responses to the question “As the pandemic ends, how often is your employer planning for you to
work full days at home?”. Sample of N=34,657 workers in 34 countries surveyed in April-May 2023. All
values are available at https://bit.ly/Figures-GSWA-2023
6

Figure 5: Workers desired number of post-COVID WFH days among
workers with WFH experience
Note: Among workers that have work-from home experience during the pandemic and worked 4 or more days
during the survey reference week. Responses to the question “As the pandemic ends, how often would you like to
have paid workdays at home?”. Sample of N=19,248 workers in 34 countries surveyed in April-May 2023.
Fully on site
Hybrid
Full WFH
7
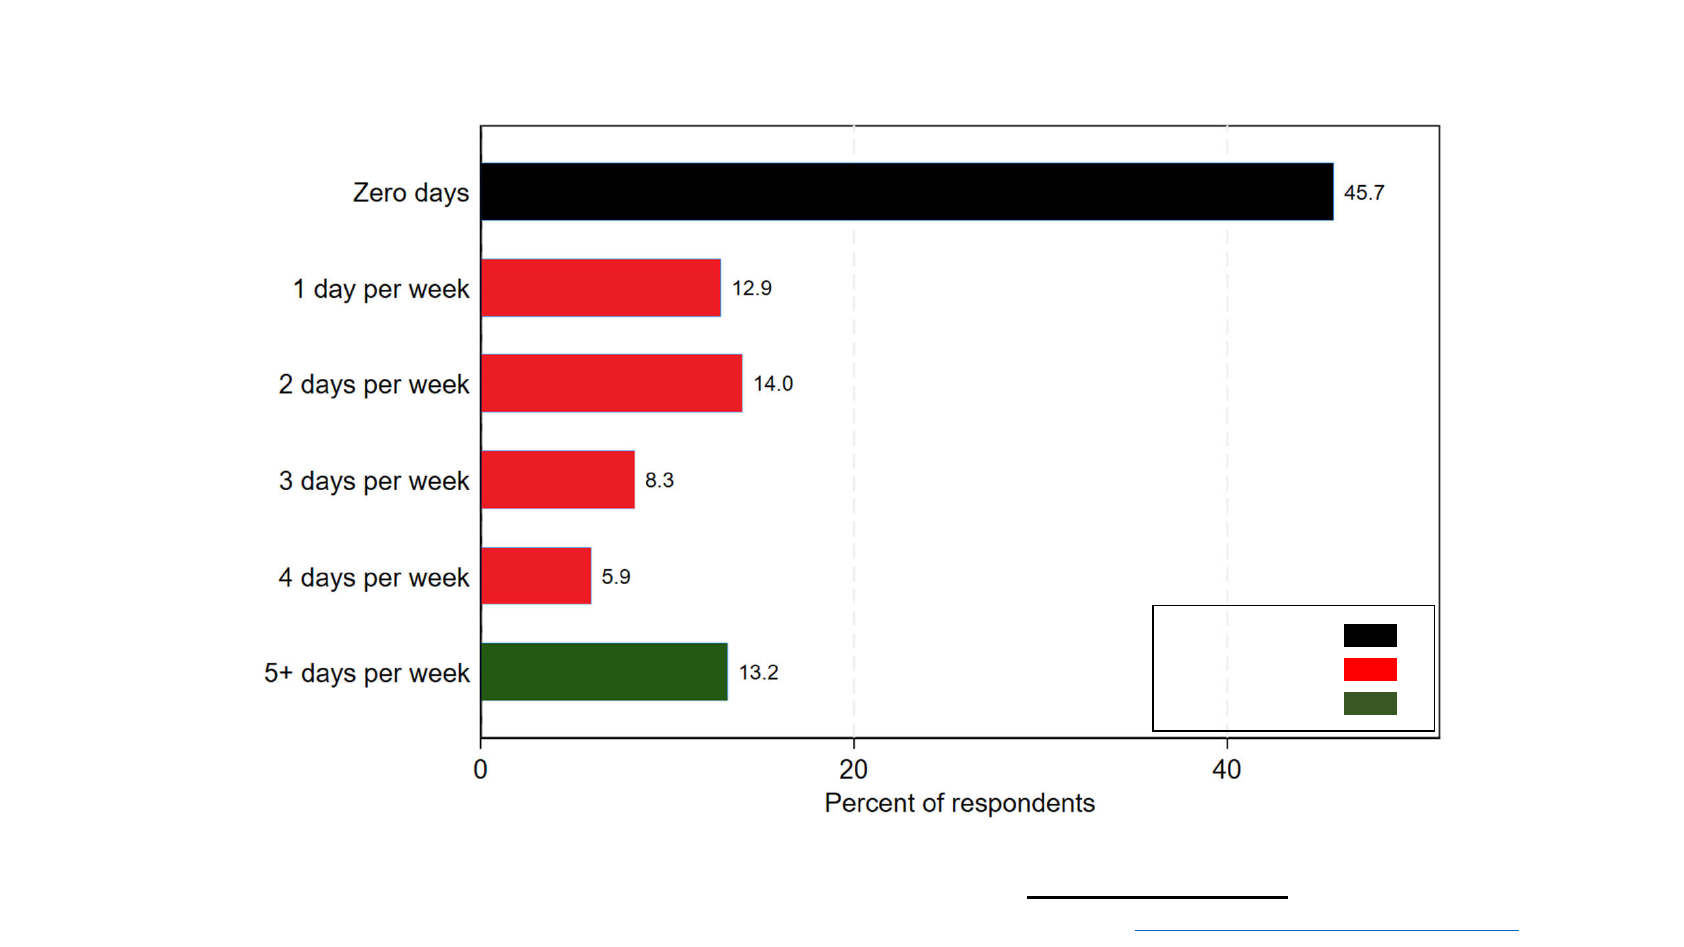
Figure 6: Current number of WFH days among workers with WFH
experience (April-May 2023)
Note: Among workers that have work-from home experience during the COVID-19 pandemic and worked 4 or more days during the
survey reference week. Responses to the question “For each day last week, did you work 6 or more hours, and if so where?”. Sample
of N=19,248 workers in 34 countries surveyed in April-May 2023. All values are available at https://bit.ly/Figures-GSWA-2023
.
Fully on site
Hybrid
Full WFH
8

Figure 7: Top benefits of working on employer’s business premises
Note: Among workers that have work-from home experience during the COVID-19 pandemic. Responses to the question “What
are the top benefits of working on your employer’s business premises? Please choose up to three”. Sample of N=20,732 workers
in 34 countries surveyed in April-May 2023. All values are available at https://bit.ly/Figures-GSWA-2023
9

Figure 8: Top benefits of working from home
Note: Among workers that have work-from home experience during the COVID-19 pandemic. Responses to the
question “What are the top benefits of working from home? Please choose up to three”. Sample of N=20,732
workers in 34 countries surveyed in April-May 2023. All values are available at https://bit.ly/Figures-GSWA-2023
10

11
Appendix
The Global Survey of Working Arrangements (G-SWA)
The third wave of the G-SWA has been fielded in 34 countries in April-May 2023 (see
Appendix Table 1).
1
It covers full-time workers, aged 20-64, with completed secondary or tertiary
education. Our samples are broadly representative with respect to age, gender and education (see
Appendix Table 2). In France, Germany, Italy, the UK and the US, sample sizes amount to more
than 2,500 respondents, respectively. In all other countries, samples consist of roughly 1,000 full-
time workers.
2
In addition to basic questions on demographics, employment status, earnings, industry,
occupation, marital status and living arrangements, the survey asks about current, planned and
desired WFH levels, and more. We screen out respondents who fail to answer an attention check
at the beginning of the survey.
3
We design the G-SWA instrument, adapting questions from the
U.S. SWAA developed by Barrero et al. (2021). We enlist professionals to translate our original
English-language questionnaire into the major languages of each country. To ensure high-quality
translations, we also enlist an independent third party with knowledge of the survey to review the
translations and revise as needed.
To field the G-SWA, we contract with Bilendi (a professional survey firm), which
implements the survey directly and in cooperation with its external partners. The survey effort taps
pre-recruited panels of people who previously expressed a willingness to take part in research.
4
Recruitment into these panels happens via partner affiliate networks, multiple advertising channels
(including Facebook, Google Adwords, and other websites), address databases, and referrals. New
recruits are added to the panel on a regular basis. When it is time to field a survey, Bilendi or its
partner issues email messages that invite panel members to participate. The message contains
information about compensation and estimated completion time but not about the survey topic.
1
Aksoy et al. (2023a, b) report results from the previous two waves that were conducted in July-August
2021 (1
st
wave) and January-February 2022 (2
nd
wave).
2
The sample size in New Zealand is somewhat smaller and amounts to 733 respondents.
3
The attention check reads: “What is 3+4?”
4
Bilendi and its external partners do not engage in “river sampling,” whereby people are invited to take a
survey while engaging in another online activity. Relative to river sampling, the use of pre-recruited
panels affords greater control over sample composition and selection.

12
Clicking on the link in the invitation message takes the recipient to the online questionnaire.
Respondents who complete the survey receive cash, vouchers or award points, which they can also
donate.
5
Before proceeding to our analysis of the G-SWA data, we drop “speeders,” defined as
respondents in the bottom 5% of the completion-time distribution for each country. After these
drops, our analysis sample contains 42,426 observations across the 34 countries in Wave 3.
Appendix Table A.1 reports statistics on response time, observation counts and dates in the field
for each country. Our samples are broadly representative by age, gender, and education for the
group of full-time workers in each country.
6
This is shown in Appendix Table A.2 which compares
our country-level G-SWA samples to summary statistics retrieved from Gallup data for 2020-22
and OECD statistics (OECD 2022).
References
Aksoy, Cevat Giray, Jose Maria Barrero, Nicholas Bloom, Steven J. Davis, Mathias Dolls, and
Pablo Zarate. 2023a. “Time Savings When Working from Home”, AEA Papers and
Proceedings, Vol. 113, May 2023, 597-603.
Aksoy, Cevat Giray, Jose Maria Barrero, Nicholas Bloom, Steven J. Davis, Mathias Dolls, and
Pablo Zarate. 2023b. “Working from Home Around the World”, Brookings Papers on
Economic Activity, forthcoming.
Barrero, Jose Maria, Nicholas Bloom, and Steven J. Davis. 2021. “Why Working from Home
Will Stick,” NBER Working Paper 28731.
OECD. 2022. “Education at a glance: Educational attainment and labour force status.”
5
We do not contact respondents ourselves, do not collect personally identifiable information, and have no
way to re-contact them.
6
Respondents take the survey on a computer, smart-phone, iPad or like device, so we miss persons who
don’t use such devices.

13
Table A.1: Statistics on Response Time (in minutes), Sample Size, and Dates in the Field
Country Mean 5% Median 95% N
Start date
End date
Argentina 17.76 7.71 13.98 42.17 1,033
April 24
May 23
Australia 12.59 4.77 9.51 29.94 970
April 24
May 22
Austria 14.75 5.81 10.55 32.97 1,039
April 24
May 10
Brazil 18.52 7.12 14.52 42.89 1,030
April 24
May 4
Canada 13.19 4.56 9.8 34.52 1,030
April 24
May 20
Chile 19.53 7.82 14.88 48.05 1,035
April 24
May 4
China 12.66 4.75 10.2 26.53 1,039
April 24
May 10
Czech Rep. 12.65 5.65 10.43 24.24 1,047
April 24
May 12
Denmark 12.44 5.45 9.96 24.3 1,043
April 24
May 23
Finland 11.93 5.53 9.52 24.46 1,040
April 24
May 7
France 13.67 5.22 10.16 31.69 2,588
April 24
May 10
Germany 12.78 4.8 9.5 30.31 2,594
April 24
May 10
Greece 11.79 5.49 10.01 21.17 1,044
April 24
May 12
Hungary 13.81 5.31 10.19 31.57 1,043
April 24
May 13
Israel 14.02 6.06 11.25 27.98 1,044
April 24
May 15
Italy 12.96 4.65 9.57 30.07 2,589
April 24
May 10
Japan 11.41 4.72 9.01 22.81 1,037
April 24
May 8
Malaysia 15.99 5.86 12.3 35.8 1,039
April 24
May 31
Mexico 20.08 8.05 14.75 49.76 1,028
April 24
May 5
Netherlands
12.02 4.35 8.95 25.95 1,039
April 24
May 11
New Zealand
13.56 5.81 10.56 28.56 733
April 24
May 22
Norway 12.79 5.32 10.04 27.24 982
April 24
May 23
Poland 13.13 5.33 9.96 31.56 1,042
April 24
May 10
Portugal 15.6 6.56 11.91 37.22 1,040
April 24
May 4
Romania 13.56 5.94 11.14 28.39 1,044
April 24
May 11
Singapore 14.27 4.84 10.53 37.13 943
April 24
June 2
South Africa
18.75 8.41 15.58 37.79 1,065
April 24
May 8
South Korea
12.61 4.25 8.59 34.82 934
April 24
June 2
Spain 12.61 4.98 9.63 26.74 1,040
April 24
May 16
Sweden 12.7 5 9.55 27.7 1,032
April 24
May 10
Taiwan 10.82 4.74 8.72 20.32 1,037
April 24
May 23
Turkey 11.82 4.6 9.65 25.31 1,045
April 24
May 11
UK 12.77 4.41 9.1 35.31 2,587
April 24
May 16
USA 12.56 4.59 9.43 28.78 2,551
April 24
May 23
Full sample 13.86 5.01 10.44 32 42,426

14
Table A.2: Comparisons of G-SWA Data with Gallup World Poll Data and OECD data for Full-Time Workers
Share of women Aged 20 to 33 Aged 34 to 46 Aged 47 to 64 Secondary education, % Tertiary or more , %
Gallup G-SWA Gallup G-SWA Gallup G-SWA Gallup G-SWA OECD G-SWA OECD G-SWA
Argentina 35.08 35.14 44.42 44.43 33.3 33.21 22.27 22.36 69.9 69.92 30.1 30.08
Australia 42.88 45.63 30.52 32.58 33.25 35.53 36.23 31.89 48.22 51.32 51.82 48.68
Austria 43.51 43.18 26.46 26.35 37.88 38.06 35.67 35.59 65 65.32 35 34.68
Brazil 33.91 34.13 45.03 44.93 34.92 35.24 20.05 19.83 71.33 71.4 28.69 28.6
Canada 45.29 45.3 29.63 29.7 33.25 33.03 37.12 37.27 36.92 36.9 63.08 63.1
Chile 39.08 39.03 35.72 35.72 33.48 33.52 30.8 30.76 65.3 65.56 34.7 34.44
China 42.1 41.9 44.3 44.19 32 31.93 23.7 23.88 77.15 77.22 22.82 22.78
Czech Rep. 42.34 42.4 21.49 21.38 39.54 39.58 38.97 39.04 73.45 73.52 26.55 26.48
Denmark 42.42 42.75 27.11 26.71 29.04 28.81 43.85 44.48 57.33 57.06 42.67 42.94
Finland 48.22 47.99 25.11 24.86 36.74 36.84 38.15 38.3 57.01 57.31 42.99 42.69
France 47.3 47.69 30.43 29.96 32.82 32.93 36.75 37.11 57.21 57.27 42.79 42.73
Germany 48.1 47.95 25.6 25.42 33.13 33.04 41.27 41.54 67.42 67.51 32.58 32.49
Greece 38.3 38.25 27.22 27.14 38.37 38.52 34.42 34.34 61.15 61.2 38.85 38.8
Hungary 39.83 40.02 26.77 26.8 41.02 40.93 32.21 32.27 70.42 70.65 29.58 29.35
Israel 47.65 47.18 35.67 35.79 31.72 31.6 32.61 32.6 47.16 47.36 52.84 52.64
Italy 37.69 37.69 21.77 21.47 45.79 45.76 32.44 32.77 78.91 79.52 21.09 20.48
Japan 36.72 37.4 26.75 25.66 33.11 33.46 40.14 40.88 44.44 44.73 55.56 55.27
Korea 37.72 36.52 23.26 17.29 36.62 41 40.12 41.71 46.58 39.47 53.42 60.53
Malaysia 38.38 38.7 51 50.78 30.33 31.02 18.66 18.21 73.6 73.38 26.4 26.62
Mexico 36.11 36.41 45.53 45.75 30.57 30.31 23.9 23.94 72.83 72.92 27.17 27.08
Netherlands 31.57 31.93 30.02 30.01 29.67 29.46 40.31 40.53 54.17 54.44 45.83 45.56
New Zealand 42.57 60.31 34.54 49.03 28.8 34.63 36.66 16.34 59.5 42.41 40.5 57.59
Norway 43.36 45.69 28.25 27.01 32.98 34.75 38.77 38.24 52.37 49.47 47.63 50.53
Poland 42.8 43.07 30.65 30.66 37.84 38.05 31.51 31.3 66.44 66.61 33.56 33.39
Portugal 47.04 46.71 34.07 34.28 35.54 35.56 30.38 30.16 60.23 60.33 39.77 39.67

15
Table A.2 (Continued): Comparisons of G-SWA Data with Gallup World Poll Data and OECD data for Full-Time Workers
Share of women Aged 20 to 33 Aged 34 to 46 Aged 47 to 64 Secondary education, % Tertiary or more , %
Gallup G-SWA Gallup G-SWA Gallup G-SWA Gallup G-SWA Gallup G-SWA Gallup G-SWA
Romania 40.06 40.07 28.33 28.32 36.18 36.25 35.49 35.43 75.7 75.68 24.3 24.32
Singapore 41.79 45.36 34.29 29.23 37.34 40.73 28.38 30.04 52 46.67 48 53.33
South Africa 40.95 43.53 42.6 42.28 40.24 43.26 17.16 14.45 81.62 81.18 18.38 18.82
Spain 44.77 45.06 28.38 27.79 41.96 42.32 29.66 29.89 56.09 55.39 43.91 44.61
Sweden 45.38 45.07 25.42 24.98 32.3 32.63 42.27 42.4 52.14 52.9 47.86 47.1
Taiwan 42.4 42.9 31.71 31.16 38.85 39.41 29.44 29.42 48.6 47.75 51.4 52.25
Turkey 27 27.05 57.27 57.19 29.97 30.05 12.77 12.75 59.82 59.74 40.18 40.26
UK 46.75 47.02 26.77 25.86 36.99 37.25 36.24 36.88 49.77 49.12 50.23 50.88
USA 43.65 44.58 34.61 35.27 28.7 29.42 36.69 35.31 48.07 44.1 51.93 55.9
